DEVELOPING PV PANEL COOLING SYSTEMS TO ENHANCE OPERATING EFFICIENCY
Feyzullah Behlül ÖZKUL
T.C.
Karabuk University Institute of Graduate Programs Department of Mechanical Engineering
Prepared as Master Thesis
Assist. Prof. Dr. Erhan KAYABAŞI
KARABUK July 2020
ii
I certify that in my opinion the thesis submitted by Feyzullah Behlül ÖZKUL titled “DEVELOPING PV PANEL COOLING SYSTEMS TO ENHANCE OPERATING EFFICIENCY” is fully adequate in scope and in quality as a thesis for the degree of Master of Science.
Assist. Prof. Dr. Erhan KAYABAŞI ………
Thesis Advisor, Department of Mechanical Engineering
APPROVAL
This thesis is accepted by the examining committee with a unanimous vote in the Department of Mechanical Engineering as a Master of Science thesis. July 8, 2020
Examining Committee Members (Institutions) Signature
Chairman : Assist.Prof.Dr. Enes KILINÇ (KBU) ………
Member : Assist.Prof.Dr. Erhan KAYABAŞI (KBU) ………
Member : Assoc.Prof.Dr. Hasan ÖZCAN (KBU) ………
The degree of Master of Science by the thesis submitted is approved by the Administrative Board of the Institute of Graduate Programs, Karabük University.
Prof. Dr. Hasan SOLMAZ ………
iii
“I declare that all the information within this thesis has been gathered and presented in accordance with academic regulations and ethical principles and I have according to the requirements of these regulations and principles cited all those which do not originate in this work as well.”
iv ABSTRACT
M. Sc. Thesis
DEVELOPING PV PANEL COOLING SYSTEMS TO ENHANCE OPERATING EFFICIENCY
Feyzullah Behlül ÖZKUL
Karabük University Institute of Graduate Programs Department of Mechanical Engineering
Thesis Advisor:
Assist. Prof. Dr. Erhan KAYABAŞI July 2020, 59 pages
In this thesis, a new heat sink was designed to be used in cooling PV panels. Considering fin number, fin geometry and material type three different version of heat sink is simulated on ANSYS Software. After that, solar radiation was applied on the simulated heat sink designs on ANSYS Fluent. The PV panel efficiency values, obtained from the analysis, were compared and the optimum heat sink design was determined. In the light of those simulations, one of the designs, which is thought to be the best choice regarding efficiency, cost and applicability, was manufactured and field tests were applied. In field test two different PV panels was used. One of them set with the manufactured heat sink and the other one was used without heat sink. During tests, temperature differences, voltage and power values and efficiency values were taken into consideration. During the tests, in the noontime, at 13:00 and 1045 W/m2 radiation, the one without heat sink had surface temperature of 59.6 ⁰C, 9.83 W power output and 5.5% efficiency. On the other hand, under same conditions, the one
v
with the heat sink had 48.9 ⁰C surface temperature, 12.05 W power output and 6.7 % efficiency. As a result, it is concluded that, with the cooling effect of designed heat sink, efficiency values increase in the range of between 20 to 30 percent in different time intervals.
Key Words : PV Panel, Cooling of PV Panels, PV Panel Operating Efficiency. Science Code : 91408
vi ÖZET
Yüksek Lisans Tezi
PV PANELLERDE ÇALIŞMA VERİMİNİN ARTIRILMASI İÇİN SOĞUTMA SİSTEMLERİNİN GELİŞTİRİLMESİ
Feyzullah Behlül ÖZKUL
Karabük Üniversitesi Lisansüstü Eğitim Enstitüsü Makine Mühendisliği Anabilim Dalı
Tez Danışmanı:
Yrd. Doç. Dr. Erhan KAYABAŞI Temmuz 2020, 57 Sayfa
Bu tez çalışmasında, PV panellerin soğutulmasında kullanılacak yeni bir ısı kuyusu tasarımı yapılmıştır. Kanatçık sayısı, kanatçık geometrisi ve malzeme tipi dikkate alındığında, üç farklı ısı kuyusu tasarımının ANSYS yazılımında simülasyonları yapılmıştır. Daha sonra, ısı kuyusu tasarımlarına ANSYS Fluent üzerinde solar radyasyon uygulandı. Analizden elde edilen PV panel çalışma değerleri karşılaştırılarak en iyi sonucu veren ısı kuyusu tasarımı belirlenmiştir. Bu simülasyonlar ışığında, verimlilik, maliyet ve uygulanabilirlik açısından en iyi seçenek olduğu düşünülen tasarım üretilerek ve saha testlerine yapılmıştır. Testlerde iki farklı PV panel kullanılmıştır. Bunlardan biri üretilen ısı kuyusu ile, diğeri ısı kuyusu olmadan kullanılmıştır. Testler sırasında sıcaklık farklılıkları, voltaj ve güç değerleri kullanılarak verimlilik değerleri hesaplanmıştır. Testler sırasında, öğleden sonra 13:00 ve 1045 W / m2 radyasyonda, ısı kuyusu olmayan panel yüzey sıcaklığı 59.6 ⁰C, 9.83 W güç çıkışı ve %5,5 verimliliğe sahip olduğu gözlemlenmiştir. Diğer yandan, aynı
vii
koşullar altında, ısı kuyusu kullanılan panel 48.9 ⁰C yüzey sıcaklığı, 12.05 W güç çıkışı ve %6,7 verimliliğe sahip olduğu gözlemlenmiştir. Sonuç olarak, tasarlanan ısı kuyusunun verimlilik değerlerini farklı zaman aralıklarında yüzde 20 ila 30 arasında artırdığı tespit edilmiştir.
Anahtar Kelimeler : Pv Panel, Pv Panellerin Soğutulması, Pv Panel Çalışma Verimi. Bilim Kodu : 91408
viii
ACKNOWLEDGMENT
First, I would like to give thanks to my advisor, Assist. Prof. Dr. Erhan KAYABAŞI, for his great interest and assistance in preparation of this thesis. My dear father and sister were also contributed much both mentally and physically during the writing process. I finally thank my dear wife for her sacrifices of family time.
ix CONTENTS Page APPROVAL ... ii ABSTRACT ... iv ÖZET... vi ACKNOWLEDGMENT ... viii CONTENTS ... ix LIST OF FIGURES ... xi
LIST OF TABLES ... xiv
SYMBOLS AND ABBREVITIONS INDEX ... xv
PART 1 ... 1
INTRODUCTION ... 1
1.1. PHOTOVOLTAICS ... 1
1.1.1. What is PV Panel... 2
1.1.2. Advantages of PV Panel ... 2
1.2. IMPORTANCE OF OPERATING TEMPERATURES ON EFFICIENCY ... 3
1.3. PV COOLING METHODS ... 5
1.4. LITERATURE REVIEW ... 5
PART 2 ... 9
MATERIALS AND METHOD ... 9
2.1. COOLING METHOD AND DESIGN CRITERIA ... 9
2.2. CFD SIMULATIONS ... 10
2.3. EXPERIMENTAL SETUP AND PARAMETERS ... 11
PART 3 ... 16
THEORETICAL STUDIES ... 16
3.1. HEAT SINK DESIGN STAGES ... 16
x
Page
3.1.2 Fin Layout ... 17
3.1.3 Fin Number ... 18
3.2. CFD SIMULATIONS AND PARAMETERS ... 20
ANSYS Fluent ... 20
PART 4 ... 22
RESULTS AND DISCUSSION ... 22
4.1. CFD SIMULATIONS ... 22
4.2. EXPERIMENTAL RESULTS ... 41
4.2.1. Temperature Results ... 41
4.2.2. Power Output Results ... 47
4.2.3. Comparison of Experimental and Simulation Results ... 49
4.2.4. Comparison of The Experimental Results with a similar Study ... 51
PART 5 ... 53
CONCLUSION AND FUTURE PLAN ... 53
REFERENCES ... 55
xi
LIST OF FIGURES
Page
Figure 1.1. Effect of temperature on different PV materials [28]. ... 4
Figure 1.2. PV Panel efficiency vs. temperature [26]. ... 4
Figure 1.3. Effects of different cooling techniques on PV panels a) natural convection, b) water cooling, c) heat sink design. ... 6
Figure 2.1. Methodology of the entire study. ... 9
Figure 2.2. Experiment setup. ... 12
Figure 2.3. Anemometer Benetech GM816 ... 12
Figure 2.4. Two identical multimeters to measure voltage output. ... 13
Figure 2.5. Two identical multimeters to measure current output. ... 13
Figure 3.1. Heat sink raw design. ... 16
Figure 3.2. Heat sink second design. ... 17
Figure 3.3. Heat sink perforated. ... 17
Figure 3.4. Heat simk fin layout first design. ... 18
Figure 3.5. Heat sink fin layout second design. ... 18
Figure 3.6. Heat sink fin layout last design. ... 18
Figure 3.7. First phase of heat sink. ... 19
Figure 3.8. Second phase of heat sink. ... 19
Figure 3.9. Final phase of heat sink. ... 19
Figure 3.10. Skewness mesh metrics spectrum. ... 20
Figure 4.1. Solar radiation values at the day and location during experiments [38]. ... 22
Figure 4.2. Flow direction guide. ... 23
Figure 4.3. Top view of first design with 1 m/s horizontal air flow. ... 23
Figure 4.4. Bottom view of first design with 1 m/s horizontal air flow. ... 24
Figure 4.5. Top view of first design with 1.5 m/s horizontal air flow. ... 24
Figure 4.6. Bottom view of first design with 1.5 m/s horizontal air flow. ... 25
Figure 4.7. Top view of first design with 3 m/s horizontal air flow. ... 25
Figure 4.8. Bottom view of first design with 3 m/s horizontal air flow. ... 26
xii
Page
Figure 4.10. Bottom view of second design with 1 m/s horizontal air flow. ... 27
Figure 4.11. Top view of second design with 1.5 m/s horizontal air flow. ... 27
Figure 4.12. Bottom view of second design with 1.5 m/s horizontal air flow. ... 28
Figure 4.13. Top view of second design with 3 m/s horizontal air flow. ... 28
Figure 4.14. Bottom view of second design with 3 m/s horizontal air flow. ... 29
Figure 4.15. Top view of final design with 1 m/s horizontal air flow. ... 29
Figure 4.16. Bottom view of final design with 1 m/s horizontal air flow. ... 30
Figure 4.17. Top view of final design with 1.5 m/s horizontal air flow. ... 30
Figure 4.18. Bottom view of final design with 1.5 m/s horizontal air flow. ... 31
Figure 4.19. Top view of final design with 3 m/s horizontal air flow. ... 31
Figure 4.20. Bottom view of final design with 3 m/s horizontal air flow. ... 32
Figure 4.21. Top view of first design with 1 m/s vertical air flow. ... 32
Figure 4.22. Bottom view of first design with 1 m/s vertical air flow. ... 33
Figure 4.23. Top view of first design with 1.5 m/s vertical air flow. ... 33
Figure 4.24. Bottom view of first design with 1.5 m/s vertical air flow. ... 34
Figure 4.25. Top view of first design with 3 m/s vertical air flow. ... 34
Figure 4.26. Bottom view of first design with 3 m/s vertical air flow. ... 35
Figure 4.27. Top view of second design with 1 m/s vertical air flow. ... 35
Figure 4.28. Bottom view of second design with 1 m/s vertical air flow. ... 36
Figure 4.29. Top view of second design with 1.5 m/s vertical air flow. ... 36
Figure 4.30. Bottom view of second design with 1.5 m/s vertical air flow. ... 37
Figure 4.31. Top view of second design with 3 m/s vertical air flow. ... 37
Figure 4.32. Bottom view of second design with 3 m/s vertical air flow. ... 38
Figure 4.33. Top view of final design with 1 m/s vertical air flow. ... 38
Figure 4.34. Bottom view of final design with 1 m/s vertical air flow. ... 39
Figure 4.35. Top view of final design with 1.5 m/s vertical air flow. ... 39
Figure 4.36. Bottom view of final design with 1.5 m/s vertical air flow. ... 40
Figure 4.37. Top view of final design with 3 m/s vertical air flow. ... 40
Figure 4.38. Bottom view of final design with 3 m/s vertical air flow. ... 41
Figure 4.39. Temperature comparison of PV with and without heat sink at 10:00. . 42
Figure 4.40. Temperature comparison of PV with and without heat sink at 11:00. . 42
xiii
Page Figure 4.42. Temperature comparison of PV with and without heat sink at 13:00. . 43 Figure 4.43. Temperature comparison of PV with and without heat sink at 14:00. . 44 Figure 4.44. Temperature comparison of PV with and without heat sink at 15:00. . 44 Figure 4.45. Temperature comparison of PV with and without heat sink at 16:00. . 45 Figure 4.46. Power difference of PV panels. ... 48 Figure 4.47. Efficiency vs. time graph PV with heat sink and without heat sink. .... 48 Figure 4.48. Temperature difference of PV panels. ... 49 Figure 4.49. Simulation temperature distribution of manufactured design under 1.5
m/s vertical air-flow. ... 50 Figure 4.50. Simulation temperature distribution of manufactured design under 1.5
m/s horizontal air-flow. ... 50 Figure 4.51. Temperature value of manufactured heat sink design in field experiments
under same conditions with simulations. ... 50 Figure 4.52. Efficiency increase values with respect to time. ... 52
xiv
LIST OF TABLES
Page Table 1.1. Temperature decrease and efficiency increase comparisons. ... 7 Table 2.1. Characteristic properties of the used PV panel. ... 14 Table 4.1. Temperature, voltage and current values of PV panel with heat sink. ... 46 Table 4.2. Temperature, voltage and current values of PV panel without heat sink. 47
xv
SYMBOLS AND ABBREVITIONS INDEX
SYMBOLS
To : temperature at zero efficiency is seen (for c-Si To is 270 °C). neff : calculated efficiency
β : temperature coefficient (≈ 0.0045 K-1 for Si crystals) Tc : operating temperature
Treff : reference temperature at reference efficiency 𝜌 : density (kg/m3)
𝜈⃗ : velocity of fluid ∇ : divergence P : the static pressure 𝜏̿ : the stress tensor
𝜌𝑔 : gravitational body force F : external body forces μ : molecular viscosity I : unit tense 𝑢𝑚 : mass velocity 𝑅𝑒𝐿 : Reynolds number ABBREVITIONS PV : Photovoltaic
CFD : Computational Fluid Dynamics a-Si : amorphous Silicon
1 PART 1
INTRODUCTION
Recently, with the industrial developments, the population increase in the world increases the demand for energy rapidly. Today, as a result of the rapid depletion of conventional energy sources, the harm to the environment by hydrocarbons and the limited fossil fuel resources, which are mostly used for electricity generation, renewables have become alternative to a sustainable and environmentally friendly energy source [1–9].
1.1. PHOTOVOLTAICS
In this sense, solar energy stands out as a promising renewable energy source among renewable energy sources today. Solar panels convert the energy coming from sunlight into electrical energy with photovoltaic processes in various designs. High-energy photons from the sun allow the semiconductor materials (usually silicon) on PV panels to break into low-energy electrons in their final orbits and thus generate electrical energy [10–15].
The first PV cell was produced in 1883 and today's technology was developed in 2009 with the addition of a thin film between two glass layers. As the weather conditions vary from region to region, the characteristics of PV panels should be evaluated under different operating conditions and efficiency analyzes should be performed carefully to increase their efficiency. PV panels produced with today's technology provide approximately 15% efficiency and this leads to a significant loss of potential. The part that cannot be converted into electrical energy causes heating of solar panels and this leads to lower efficiency of PV panels [16–20].
2 1.1.1. What is PV Panel
Solar radiation could be harvested using Photovoltaics or PV/T (Photovoltaic-Thermal) systems. At the initial PV systems was used for directly converting solar energy to the electricity. In the early 1900s, with the development of quantum theory, the real logic behind conversion process was understood and developed accordingly [21]. In mid-1900s, first PV cell was manufactured and expeditiously became the main energy source for the devices that was sent to far points of space. In the first place, because it is too vital and dependable, cost of PV cells was ignored and used widely in satellites and space survey vehicles. When it comes to 1970s, with the start of energy crisis on Earth, PV systems started to be used on the ground. Today, the PV systems that we use have advanced technologies [22].
1.1.2. Advantages of PV Panel
In today’s technology, PV panels commonly used with silicon-based semiconductor material and with the help of used material it can directly convert solar energy to electrical energy. When it is compared to other renewable energy systems like wind power plants, the maintenance cost is much lower because of the simplicity of the PV systems regarding physical aspect. i.e. mechanical problems are not likely in PV systems because there is no complex mechanical system. In addition, the silence and less emissivity features of PV panels makes it environmentally friendly [23,24]. Moving on to applicability of PV panels, the source of energy (sun) is available throughout the world and can be used from all points of the world without any additional transportation cost more importantly because the source is unlimited, there is no room for wars to harvest energy from sun. When compared the conventional energy sources like oil, it does not require additional processes to be used. The main problem with PV panels was manufacturing costs, but nowadays the raw silicon material price getting lower and technology behind working principle of PV panels are open to be developed. So, PV panels seem to be promising and unlimited energy source for the future [25].
3
1.2. IMPORTANCE OF OPERATING TEMPERATURES ON EFFICIENCY
When efficiency drop is seen in PV panels, first thing that comes into mind is temperature. In standard test conditions, negative effect of temperature increase is not seen. However, in the field tests it is revealed that, temperature has considerable negative effect on efficiency. However, before field tests, it is needed to know the effect of temperature to the efficiency to determine the best choice without spending for manufacturing. While still in simulation phase, to calculate approximate efficiency values in different temperatures, there is a need in calculation of efficiency change under different temperature values. To achieve that, formulas below were used [26].
𝜂 = 𝜂𝑟𝑒𝑓𝑓[1 − 𝛽(𝑇𝑐− 𝑇𝑟𝑒𝑓𝑓)] (1.1)
Where, ηeff: calculated efficiency, β is temperature coefficient (≈ 0.0045 K-1 for Si crystals), Tc is operating temperature, Treff is reference temperature at reference efficiency.
𝛽𝑟𝑒𝑓𝑓 = 1
𝑇𝑜−𝑇𝑟𝑒𝑓𝑓 (1.2)
To: temperature at zero efficiency is seen (for c-Si To is 270 °C).
It can be easily said that, using any cooling method in PV panels decreases the operating surface temperature and as a result increases efficiency [27].
It has been proposed that constant operating temperature is an important factor for the efficiency of PV panels. As can be seen in Figure 1.1, the decrease of electrons in PV modules in open circuit and the increase in temperature due to increase radiations levels leads to lower efficiencies. In order to prevent the decrease in efficiency due to overheating, many studies have been carried out on cooling of solar panels [4].
Figure 1.1 shows that the material type is also very important for the efficiency of PV panels. According to figure below, a-Si has higher efficiency. However, c-Si is much
4
more accessible and economically reachable in the market. So, to determine the best choice all aspects are needed to be considered.
Figure 1.1. Effect of temperature on different PV materials [28].
In another study, efficiency of three different cooling methods, air cooling, water cooling and cooling with heat sink, were examined and compared in Figure 1.2. Here, heat sink seems to be the best choice considering efficiency value and stability, temperature and needed additional energy for cooling [26].
5 1.3. PV COOLING METHODS
In the literature, PV panel cooling techniques are examined in two groups as passive and active cooling. Wind cooling, cooling with natural convection conditions with water, cooling using heat wells, cooling using natural moisture, cooling with soil covered copper plates, thermoelectric cooling and cooling using nano-fluid as passive cooling were evaluated as; application of forced transport conditions in water cooling systems and the use of high frequency ultrasound waves are considered as active cooling methods. While active cooling methods require extra energy to operate the system, passive cooling systems do not require additional energy. However, active cooling methods cannot go beyond theoretical studies [5,11,13,29–32].
1.4. LITERATURE REVIEW
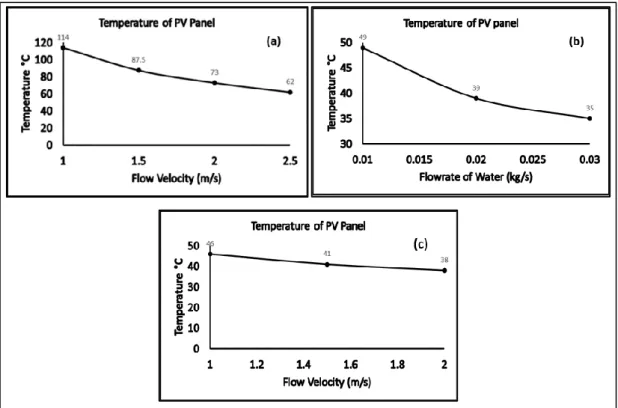
In the literature, lots of different PV panel cooling methods have been examined. Two main branches of cooling methods are that exist, passive and active cooling methods. Passive cooling is the first method that comes to mind with natural convection. In one of the studies on this method, Kayabaşı (2017) examined the effects of different cooling options on the efficiency of PV panels on cooling of solar panels. In this study, natural convection cooling, water cooling and heat sink cooling systems were analyzed and compared. As a result of the study, it was found that natural convection and water-cooling methods were insufficient to decrease the PV panel temperature. As seen in Figure 1.3a, the cooling of the PV panel surface temperature was reduced to 62 °C at 2.5 m/s, which is the maximum passive air velocity. In water cooling, this temperature was obtained as 35 °C for 0.03 kg / s water flow rate (Figure 1.3b). However, in this method, energy input is required to keep the water circulation at this value. This causes to consumption of some of the energy for the circulation of water. In the last method analyzed in the study, the PV panel surface was cooled using heat well and the surface temperature was obtained as 38 °C under natural convection conditions (Figure 1.3c). In this method, surface temperature can be kept at a certain level even at low wind speeds in accordance with natural conditions. As a result, it was determined that cooling method using heat sink is the most suitable method for natural working conditions [28].
6
Figure 1.3. Effects of different cooling techniques on PV panels a) natural convection, b) water cooling, c) heat sink design.
In Table 1.1, PV panel operating temperature decreases and efficiency increase percentages for various cooling methods were shown. To start with, natural vapour cooling method, there is no need for additional energy but the PV panel needed to be set above any kind of water source, where natual evaporation occurs [30].
Using SiC nanofluid as a base-fluid in PV panel cooling is another method. In their study, Al-Waeli et al. used SiC nanofluid, including 3 wt. % nanoparticles, as a cooling fluid in PV panel. Different nanofluids with different percentage nanoparticles were also examined. As a result, up to 24.1 % efficiency increase and 8.24 % temperature drop was observed [34].
7
Table 1.1. Temperature decrease and efficiency increase comparisons.
Sources of Work PV Cooling Method
Decrease in PV Temperature (°C) Efficiency Increase (%) Ebrahimi et al.
(2015) Natural Vapor Cooling 16 12.12
Al-Waeli et al. (2017)
Using Sic Nanofluid as A Base-Fluid in PV Panel Cooling 25 24.1 Rahimi et al. (2015) Multi Header Microchannels In A Hybrid PV Cell Cooling
30 28
Idoko et al. (2018) Multi-Concept Cooling 5 3 Rostami et al.
(2018)
Cooling Method with
Atomized Fluids 27 51.1
Soliman et al.
(2018) Cooling with Heat Sink 19 8
Peter Atkin and Mohammed Farid
(2015)
Cooling with PCM Infused Graphite and
Aluminum Fins
19 12.97
Rahimi et al. compared single and multi-concept cooling in their study. It was revealed that using multi-concept cooling method is 6.8 % better surface temperature and 28 % higher efficiency [31].
In 2018, Idoko et al. examined multi-concept cooling method, combination of conductive, air- and water-cooling methods, in Nigeria. 250W capacity PV panels were used and consequently 5 °C temperature drop and 3 % efficiency increase were observed [5].
Cooling with heat sink method studied by Soliman et al. (2018). Halogen lambs were used to simulate solar radiation in laboratory conditions. 5.4 % temperature decrease and 8 % efficiency increase were observed with air cooling without using additional energy [35].
Peter Atkin and Mohammed Farid (2015), used phase changing material (PCM) in addition to heat sink. Both Matlab simulation and experimental setup were applied. Infused graphite was used as phase changing material. c-Si was used, and experiment
8
was done under laboratory conditions with the help of halogen lambs applying 920 W/m2 radiation. According to results, 19 °C temperature decrease and 13 % efficiency increase were achieved [36]. However, according to literature there is wide gap on the cooling of PV panel considering fluid mechanics, heat transfer sciences and low cost for production.
In this study, novel and more effective heat sink was designed and experimentally approved, considering fluid mechanics and heat transfer sciences with a simple geometry. In design part of this study, an effective and distinctive heat sink was designed in ANSYS SpaceClaim. After, simulations were performed under different conditions using ANSYS Fluent module. Following by the determination of best heat sink design according to simulations results production of heat sink was performed to use in field experiment under real conditions.
9 PART 2
MATERIALS AND METHOD
2.1. COOLING METHOD AND DESIGN CRITERIA
This study consists of two stages: numerical simulations stage and experimental study stage. In numerical simulations, heat sink temperature distributions and flow paths of the cooling air was investigated for different geometries. In experimental studies temperature distributions of the PV panels with and without heat sinks were observed and PV panel efficiencies were calculated according to the voltage and current values recorded during the experiments.
For the experimental stage of study heat sink was manufactured from aluminum material and installed in the PV panel test system. In the installation of the test system, 2 PV panels were mounted on. Extra airflow was not supplied to the system except natural airflow. Experimental results were obtained according to airflows presented that day and air speeds recorded with an anemometer. A thermal camera was also used to examine the temperature distribution of PV panels. Voltage and current output values of solar panels was recorded with the help of 4 multimeters.
10
As summarized in Figure 2.1, PV panel efficiency was calculated using the values to be obtained from the experimental study and was compared with the results of the analysis. As a result of calculations, the optimum operating conditions of the solar panel were determined. In addition, the temperature distribution of the solar panel was recorded under optimum operating conditions.
2.2. CFD SIMULATIONS
In CFD simulations, heat sink types and air-flow velocity values were simulated under field conditions which includes solar radiation and wind speed values of field experiment conditions. One by one, for each air speed, mass, momentum, and energy equations were solved by ANSYS Fluent Software. As demonstrated in the Equation 2.1, conversation of mass equation was solved by the software during simulation.
𝜕𝜌
𝜕𝑡+ ∇ ∙ (𝜌𝜈⃗) = 𝑆𝑚 (2.1)
Where, 𝑆𝑚 is mass change both for compressible and incompressible flows, 𝜌 is density (kg/m3), 𝜈⃗ is velocity of fluid, ∇: is divergence.
At the same time energy conversation was also calculated by using Equation 2.2.
(𝑢
𝜕𝑇 𝜕𝑥+ 𝑣
𝜕𝑇 𝜕𝑦+ 𝑤
𝜕𝑇 𝜕𝑧) = 𝛼 (𝑢
𝜕2𝑇 𝜕𝑥2+ 𝑣
𝜕2𝑇 𝜕𝑦2+ 𝑤
𝜕2𝑇 𝜕𝑧2)
(2.2)Where, u, v and w are velocity values in the x, y and z directions respectively, α is thermal emission coefficient. Conversation of momentum calculations were showed in Equation 2.3.
𝜕
𝜕𝑡(𝜌𝜈⃗) + ∇ ⋅ (𝜌𝜈⃗𝜈⃗) = ∇𝑝 + ∇ ⋅ (𝜏̿) + 𝜌𝑔 + 𝐹⃗ (2.3)
Where P is the static pressure, 𝜏̿ is the stress tensor, 𝜌𝑔 is gravitational body force and F is external body forces.
11
In Equation 2.3 stress tensor calculation formula was given to be used in equation 2.4.
𝜏̿ = 𝜇 [(∇𝜐⃗ + ∇𝜐⃗𝑇) −2
3∇ ⋅ 𝜐⃗𝐼] (2.4)
Where, μ is molecular viscosity, I is unit tensor, ∇ is divergence, 𝜈⃗ is velocity of fluid 𝜏̿ is the stress tensor.
To add on effect of photons coming from the sun, certain moment was simulated via heat flux added on the surface of PV panel.
Two flow options were available in ANSYS Fluent and to determine whether it is steady state flow or turbulent flow, Reynolds number were calculated by using Equation 2.5 [37].
𝑅𝑒𝐿 = 𝑢𝑚𝐿
𝜈
(2.5)
When it was turbulent flow, to continue the process, further module choices must have done. At that point, k-epsilon module was selected, and necessary parameters were set to be more precise in simulations. After setting up necessary parameters, calculations were initialized with 260 iterations where it converged.
2.3. EXPERIMENTAL SETUP AND PARAMETERS
In the experiment, two identical, 20V capacity, PV panels, 4 multimeters and 2 bulbs were used as it is seen in Figure 2.2.
12
Figure 2.2. Experiment setup.
Figure 2.3. Anemometer Benetech GM816
Benetech GM816 anemometer was also included in the setup to measure air velocity instantly.
First, PV panels were placed identically regarding location and angle of repose. After that, two identical multimeters to measure voltage outcome and another two identical multimeters to measure current outcome of the PV panels were used. At his point to be able to read current values of the setup we needed a resistance in our system. To
13
read the values precisely we placed 2 identical, 1.5 ohm, bulbs for each panel. Before starting the experiment, we make sure that multimeters are identical as you see in Figures 2.4 and 2.5.
Figure 2.4. Two identical multimeters to measure voltage output.
Figure 2.5. Two identical multimeters to measure current output.
At this point, experimental setup was installed, and recording started as readings coming from multimeters. At the same time in 20 minutes intervals thermal camera was used to record surface temperatures of both PV panels.
PV panel module type was TPS- 1055 Mono Crystalline Solar Panel with following properties, irradiance 1000 W/m2 & 25 ⁰C ;
14
Table 2.1. Characteristic properties of the used PV panel.
Maximum Power (Pmax) 20 Wp
Open Circuit Voltage (Voc) 22.32 V Short Circuit Current (Isc) 1.13 A Maximum Power Voltage (Vmp) 18.0 V Maximum Power Current (Imp) 1.11 A
To reach instant efficiency value, power input at specific time needs to be calculated by using Equation 2.6.
Pin = Irradiance * Surface Area (2.6)
In efficiency calculations, 13:00 irradiance value was used which was 1045W/m2.
Pin = 1045 W/m2 * (0.6 m * 0.2 m)
Pin = 125.4 W
Fill Factor was calculated using Equation 2.7.
FF = Pmax
Voc∗Isc (2.7)
Irradiance 1000 W/m2 & 25 ⁰C
FF = 20W
22.32V ∗ 1.13A= 0.793
Fill Factor value utilized for operating efficiency percentage of PV panel. In our case, it is calculated as 0.793 using Equation 2.7.
ɳ =
V𝑂𝐶∗I𝑆𝐶∗FF15
After calculating Fill Factor value, efficiency of PV panel in ideal conditions can be calculated via equation 2.8.
ɳ =
22.32V∗1.13A∗0.793125.4W = 0.141
In this section, firstly, backbone of our study was clearly introduced. Then, design process in ANSYS Software examined in detail. For instance, parameters that we consider in simulation were widely mentioned (fin geometry, fin number, fin layout, skewness, flow type). After that, experimental setup equipment was explained. PV panel properties such as material type, power capacity and required parameters for efficiency determination were calculated. Finally, result graphs of the field experiment were shared.
16 PART 3
THEORETICAL STUDIES
3.1. HEAT SINK DESIGN STAGES
Designing heat sink process, mainly three different parameters were taken into consideration. In this part, these three parameters will be explained in detail.
3.1.1 Fin Geometry
In the literature, there are several PV cooling with heat sink studies. Our work was shaped in the light of those studies and developed with our novel approach.
Our starting point was to approach the case in most common way which was directly using flat fins in the heat sink design.
Figure 3.1. Heat sink raw design.
As seen in the Figure 3.1, our first approach was too simple but most economically feasible and effective one.
17
Figure 3.2. Heat sink second design.
In Figure 3.2, airflow ways and contact surface area of directly coming air was tried to be increased. To achieve that and to stay in economically feasible side, edges were not directly rounded but cut with an angle.
After considering horizontal flow, to open airflow ways vertically, we perforated the fins.
Figure 3.3. Heat sink perforated.
With the help of perforation, surface contact area was considerably increased. In addition to that, air coming from vertical side was let in as seen in the Figure 3.3.
3.1.2 Fin Layout
In layout consideration we placed fins in horizontal axis to increase surface contact area all along the airflow way. Placing fins in horizontal axis also helps us in manufacturing process economically. For that reason, in Figures 3.4, 3.5 and 3.6, layout of fins was shown.
18
Figure 3.4. Heat simk fin layout first design.
Figure 3.5. Heat sink fin layout second design.
Figure 3.6. Heat sink fin layout last design.
3.1.3 Fin Number
In our experiment, PV panel that we used had dimensions of 20 cm x 60 cm. Considering this, to keep the optimum balance between airflow ways and contact surface area in heat sink design 5 fins were created. In Figures 3.7, 3.8 and 3.9, the final shape of the heat sinks was shown.
19
Figure 3.7. First phase of heat sink.
Figure 3.8. Second phase of heat sink.
20
3.2. CFD SIMULATIONS AND PARAMETERS
ANSYS Fluent
Firstly, three different heat sink designs were created in ANSYS Mechanical module considering the number of fins, geometry, and layout. In raw design, five parallel placed flat aluminum fins were created. In relatively developed model, flat aluminum fins were perforated to open extra contact surface and airflow ways. As a possibly optimum model, cut edges were rounded to create easier pathways for airflow which also increases cooling effect of airflow.
Completing designing part, models were transferred to the ANSYS Fluent module. The determined radiation value which was 1045 W/m2 was simulated on the PV panel in accordance with the reality. In addition, the wind speed values which are 1 m/s, 1,5 m/s, 2 m/s, 3 m/s are likely to happen in field conditions were added to the simulation.
In meshing part, skewness mesh metrics spectrum was conducted to make sure that whether the skewness value was in an acceptable range or not. In the quality section of mesh process, the skewness value was recorded as 0.94. As seen in the Figure 3.10, our value is in acceptable range.
Skewness Mesh Metrics Spectrum
Excellent Very Good Good Acceptable Bad Unacceptable 0-0.25 0.25-0.50 0.50-0.80 0.80-0.94 0.95-0.97 0.98-1.00
Figure 3.10. Skewness mesh metrics spectrum.
In the next stage, the Reynolds number was calculated, and the simulation configuration was determined according to the flow form created by the wind horizontally and vertically. In both horizontal and vertical flow, 1 m/s, 1.5 m/s, 3 m/s velocity values were simulated. Reynolds number for these velocity values were calculated.
21 ⇒Where kinetic viscosity equals to 1.608*10-5
• For horizontal flow @ 1 m/s velocity (30 mm width) ; Re𝐿 =
1m/s∗0.03m
1.608e−5 = 1866 < 2300 ⇒ Laminar flow
• For horizontal flow @ 1.5 m/s velocity (30mm width) ; Re𝐿 =
1.5m/s∗0.03m
1.608e−5 = 2798 > 2300 ⇒ Transient flow
• For horizontal flow @ 3 m/s velocity (30mm width) ;
Re𝐿 = 3m/s∗0.03m
1.608e−5 = 5596 > 2300 ⇒ Transient flow
• For vertical flow @ 1 m/s velocity (40mm width) ;
Re𝐿 = 1m/s∗0.04m
1.608e−5 = 2488 > 2300 ⇒ Transient flow
• For vertical flow @ 1.5 m/s velocity (40mm width) ; Re𝐿 =
1.5m/s∗0.04m
1.608e−5 = 3732 > 2300 ⇒ Transient flow
• For vertical flow @ 3 m/s velocity (40mm width) ; Re𝐿 =
3m/s∗0.04m
1.608e−5 = 7464 > 2300 ⇒ Transient flow
According to Reynolds number equation, flow types were decided, and the accurate simulation type was chosen in ANSYS software. In the process, 268 iterations were applied for each condition. The results were discussed in Results and Discussions part in figures.
22 PART 4
RESULTS AND DISCUSSION
4.1. CFD SIMULATIONS
In the process of simulations, at the initial first simulation was started without any limitation and waited until it converges. Simulation converged in 268 iterations
As irradiation 1045 W/m2 solar radiation was simulated to the surface of PV panel. That value was decided considering real-life conditions at exact time and location that our field experiments were done as presented in Figure 4.1.
23
Figure 4.2. Flow direction guide.
In Figure 4.2, flow directions were shown to guide the figures used in this part.
In simulation, air velocity values were also simulated considering real-life conditions at specific time and area. In Karabuk University at summertime of 2019, wind speed varies from 3 km/h to 11 km/h. Which is equal to the range between 1 m/s and 3 m/s air speed. For that reason, in ANSYS Fluent software 1 m/s, 1.5 m/s and 3 m/s air velocities were simulated on the created designs.
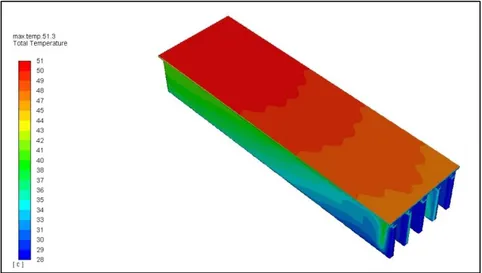
For the first design, initial simulation was carried out with 1 m/s horizontal air velocity. As seen in the Figures 4.3 and 4.4, in coming air, directly affects temperature of PV panel surface. In this simulation, we observed maximum temperature of 51.3 ⁰C.
24
Figure 4.4. Bottom view of first design with 1 m/s horizontal air flow.
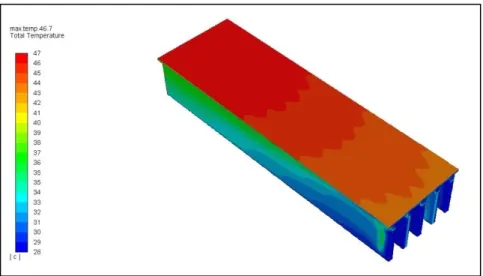
When air velocity increased to the 1.5 m/s, as presented in Figures 4.5 and 4.6, cooling effect of air increased. Consequently, maximum surface temperature was recorded as 46.7 ⁰C in this case.
25
Figure 4.6. Bottom view of first design with 1.5 m/s horizontal air flow.
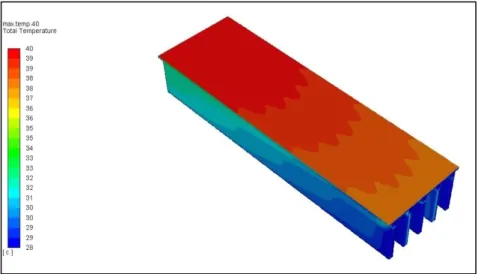
For the last simulation of first design, 3 m/s air flow was applied and results in Figures 4.7 and 4.8 were reached. In this case, by increasing air flow velocity, temperature values decrease about 10 ⁰C.
26
Figure 4.8. Bottom view of first design with 3 m/s horizontal air flow.
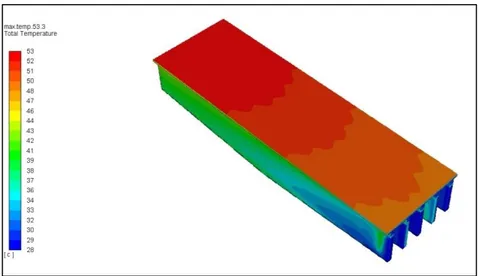
For the second design, at the initial 1 m/s air flow was simulated horizontally and results in Figures 4.9 and 4.10 were acquired. 53.3 ⁰C temperature value showed us at this air speed value, our first design had better results. So, we thought there is still room for further development in design.
27
Figure 4.10. Bottom view of second design with 1 m/s horizontal air flow.
To observe the effect of air flow, we continued simulations for this design although it had worse results than the first design. For that reason, we increased air speed to 1.5 m/s first and 3 m/s for further observations. In Figures 4.11 and 4.12, simulation with 1.5 m/s was presented and 48.4 ⁰C was attained which is again worse that the first design.
28
Figure 4.12. Bottom view of second design with 1.5 m/s horizontal air flow.
As the last case, in Figures 4.13 and 4.14, we showed simulation results of second design with 3 m/s air velocity and observed 41.2 ⁰C temperature value. As a result of these simulations, even if air flow velocity was increased in horizontal axis, first design had better results.
29
Figure 4.14. Bottom view of second design with 3 m/s horizontal air flow.
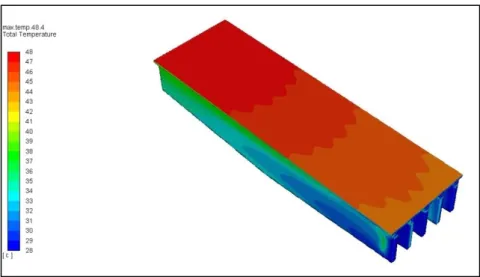
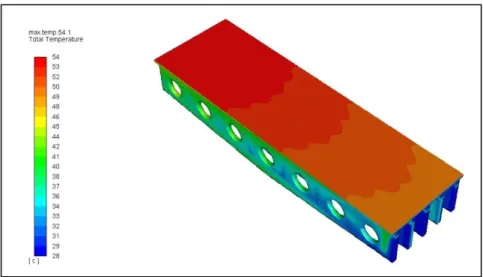
For the last design, when applied horizontal air flow was 1 m/s, in Figures 4.15 and 4.16 temperature value was presented as 54.1 ⁰C which is the worst case in the same conditions.
30
Figure 4.16. Bottom view of final design with 1 m/s horizontal air flow.
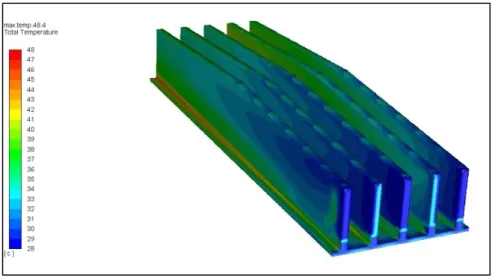
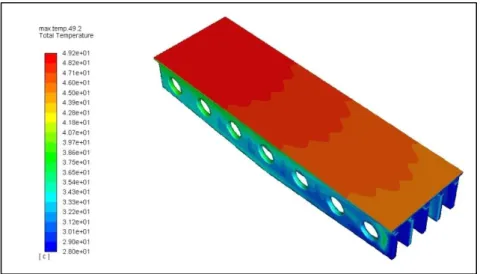
After that, 1.5 m/s air flow velocity was applied and 49.2 ⁰C was acquired which is close but again the worst scenario until this point. However, as seen in Figures 4.17 and 4.18, effect of air flow distributed evenly to the heat sink with the help of perforations.
31
Figure 4.18. Bottom view of final design with 1.5 m/s horizontal air flow.
In the last simulation of horizontal flows, we applied 3 m/s air flow and 41.6 ⁰C was reached as presented in Figures 4.19 and 4.20 which showed us that in horizontal flow with 3 m/s air speed the difference between designs were negligible. However, in real life conditions, air naturally flows in all sides. So, in the upcoming section, effects of vertical flows were studied.
32
Figure 4.20. Bottom view of final design with 3 m/s horizontal air flow.
In this part of simulations, vertical flows were applied and for the first design with 1 m/s air speed 53.6 ⁰C was reached as showed in Figures 4.21 and 4.22 which was 51.3 ⁰C in horizontal case.
33
Figure 4.22. Bottom view of first design with 1 m/s vertical air flow.
When air speed increased 1.5 m/s, temperature was recorded as 49.7 ⁰C. In addition, Figures 4.23 and 4.24 clearly show that air flow was opposed by the first fin. As a result, cooling effect was not evenly distributed. In real life conditions, this phenomenon causes significant results such as high surface temperature distributions and lower power output.
34
Figure 4.24. Bottom view of first design with 1.5 m/s vertical air flow.
Final air speed simulated was 3 m/s, and 41.1 ⁰C was observed in this case. Which showed us in Figures 4.25 and 4.26, if air speed was increased more the advantage of the last design was become more obvious in vertical air flow.
35
Figure 4.26. Bottom view of first design with 3 m/s vertical air flow.
In the following Figures 4.27 and 4.28, 57.1 ⁰C was observed under 1 m/s air speed applied and it was seen that performance of second design was worse than raw design with 1 m/s air velocity.
36
Figure 4.28. Bottom view of second design with 1 m/s vertical air flow.
Figure 4.29 and 4.30 indicated that the temperature gap between first and second designs were closed when air flow velocity was increased to 1.5 m/s.
37
Figure 4.30. Bottom view of second design with 1.5 m/s vertical air flow.
With maximum surface temperature of 42.1 ⁰C, Figures 4.31 and 4.32 showed us that if the air velocity values were kept in high values the new designs would show better results.
38
Figure 4.32. Bottom view of second design with 3 m/s vertical air flow.
When it comes to manufactured design with 1 m/s air velocity from vertical axis, 53.5 ⁰C temperature value was observed as it is seen in Figures 4.33 and 4.34. Which was the best performing design, among others.
39
Figure 4.34. Bottom view of final design with 1 m/s vertical air flow.
After that point, as shown in Figures 4.35 and 4.36, the air velocity value was increased to 1.5 m/s and 49.6 ⁰C surface temperature was reached. Which was 49.7 ⁰C and 51.7 ⁰C in raw and second designs respectively.
40
Figure 4.36. Bottom view of final design with 1.5 m/s vertical air flow.
Finally, in Figures 4.37 and 4.38, air velocity was increased to 3 m/s and 40.1 ⁰C surface temperature was observed. Under same conditions the results were 41.1 ⁰C and 42.1 ⁰C in raw and second designs, respectively. Which clearly showed us that if self-powering system was set up in the field experiments to keep air velocity values in high numbers, the operating efficiency of manufactured design would be much better than other designs.
41
Figure 4.38. Bottom view of final design with 3 m/s vertical air flow.
4.2. EXPERIMENTAL RESULTS
In our experiment, power output values were recorded in twenty minutes intervals. At the same time, by using thermal camera, thermal views of PV panel surface temperature values were recorded in one-hour intervals.
4.2.1. Temperature Results
In the following figures of this part, comparison of PV panel surface temperatures of PV with and without heat sink in one-hour intervals, starting from 10:00 to 16:00. These images were shown in the Figures between 4.39 and 4.45.
42
Figure 4.39. Temperature comparison of PV with and without heat sink at 10:00.
43
Figure 4.41. Temperature comparison of PV with and without heat sink at 12:00.
44
Figure 4.43. Temperature comparison of PV with and without heat sink at 14:00.
45
Figure 4.45. Temperature comparison of PV with and without heat sink at 16:00.
In the Figures above, PV panel surface temperatures from 10:00 to 16:00, approximately 10 ⁰C temperature difference were observed in all recordings. Which results in significant power output difference and as a result considerable amount of efficiency difference. To see the relation between temperature values and power output, power output values were also recorded in the same time intervals and strong relation between them was observed as mentioned in Tables 4.1 and 4.2.
46
Table 4.1. Temperature, voltage and current values of PV panel with heat sink. PV Panel with heat sink
Time Surface Temperature(ºC) Measured Voltage(V) Measured Current(Ω) 10:00 43.4 9.28 1 10:20 46.4 9.67 1 10:40 46.5 9.98 1.01 11:00 47.2 10.19 1.02 11:20 47.5 10.36 1.02 11:40 47.7 10.56 1.03 12:00 48.3 10.92 1.04 12:20 48.5 11.06 1.05 12:40 48.7 11.28 1.06 13:00 48.9 11.26 1.07 13:20 50.7 11.16 1.06 13:40 49.3 11.06 1.05 14:00 48.9 10.53 1.04 14:20 48.5 10.35 1.03 14:40 47.3 10.09 1.02 15:00 46.4 9.94 1.01 15:20 45.1 9.78 1 15:40 44.6 9.45 0.99 16:00 44.4 9.42 0.99
In Table 4.1, it is clearly seen that, highest temperature value were recorded at 13:20. However, highest power output value were recorded at 13:00.
47
Table 4.2. Temperature, voltage and current values of PV panel without heat sink. PV Panel without heat sink
Time Surface Temperature(ºC) Measured Voltage(V) Measured Current(Ω) 10:00 53.4 7.9 0.99 10:20 54.3 8 1 10:40 55.7 8.07 1 11:00 56.2 8.25 1.01 11:20 56.5 8.36 1.01 11:40 56.9 8.67 1.02 12:00 57.1 8.75 1.03 12:20 58 9.1 1.04 12:40 58.9 9.29 1.05 13:00 59.6 9.27 1.06 13:20 59.9 9.23 1.05 13:40 59.5 9.14 1.04 14:00 58.9 8.8 1,03 14:20 58.4 8.62 1,02 14:40 57.6 8.38 1.01 15:00 56.9 8.06 1 15:20 55.5 7.95 1 15:40 53.2 7.73 0.99 16:00 51.5 7.47 0.98
Also, in Table 4.2, although highest temperature value was observed at 13:20, highest power output value was observed at 13:00. So, in the following parts relation between temperature, power output and efficiency was studied in all aspects.
4.2.2. Power Output Results
Figure 4.46 shows the power output differences of PV panel with heat sink and without heat sink. Approximately 20% power output difference was observed throughout the experiment.
48
Figure 4.46. Power difference of PV panels.
After that point, as you see in Figure 4.47, efficiency values were calculated in one-hour intervals and PV panel with and without heat sink was compared in graphs.
Figure 4.47. Efficiency vs. time graph PV with heat sink and without heat sink.
In the same time interval, there is also a similar relation between temperature values. In Figure 4.48, it can clearly be said that heat sink reduces the PV panel surface temperature by 10⁰C.
49
Figure 4.48. Temperature difference of PV panels.
4.2.3. Comparison of Experimental and Simulation Results
In the following figures, Figure 4.49, 4.50 and 4.51, field temperature result and simulation result under 1.5 m/s simulation were shown. In Figure 4.49, when air simulated from vertical axis, the temperature value was observed as 49.6 ⁰C and again with 1.5 m/s airflow but from horizontal axis in Figure 4.50 temperature value came out as 49.2 ⁰C. In Figure 4.51, the footage was taken at exactly 13:00 pm, as taken from Turkish State Meteorological Service, with 1045 W/m2 irradiation and as measured with anemometer air velocity between 1 m/s and 3 m/s. Under these conditions, the temperature value in Figure 4.51 was 48.9 ⁰C.
So, according to acquired result both from field and simulations, it can be clearly said that our study was accurate and successful regarding overlapping of results and comparison of different designs.
50
Figure 4.49. Simulation temperature distribution of manufactured design under 1.5 m/s vertical air-flow.
Figure 4.50. Simulation temperature distribution of manufactured design under 1.5 m/s horizontal air-flow.
Figure 4.51. Temperature value of manufactured heat sink design in field experiments under same conditions with simulations.
51
4.2.4. Comparison of The Experimental Results with a similar Study
In the studies conducted in the literature, various methods were used, and various results were reached. For example, similar to our study, Grubisic-Cabo et al. (2017) conducted an experimental study with a heat sink in the PV system to increase PV panel efficiency. The main idea of their study was to reduce the negative effect of detected airflow losses on cooling on the back of the PV panel. Two specific positions and geometries have been considered to control efficiency and overall performance. The first geometry consists of a series of aluminum fins placed upwards, while the second geometry consists of perforated and randomly placed fins. The second approach was more efficient and found more suitable for prospective experimental work. The proposed technique was tested on a single PV panel and an average yield increase of approximately 2 % at maximum power was observed. It has been observed that the applied technique is more effective in windy periods and is not affected by the radiation level. A heat sink cooling system consisting of a series of thin rectangular fins for heat transfer was designed. Different average temperature values were reached by adjusting many parameters in this system [32].
In another study, Sharma et al. (2016) studied a similar work. In their study, PV system was established with a PCM (Phase Change Material) container as a heat sink. Under 1000 W/m2 irradiation 7.7 % electrical efficiency increase were reached when the temperature dropped by 3.8 ⁰C [41]. In our work, under 1045 W/m2, temperature value dropped from 59.6 ⁰C to 48.9 ⁰C. with 10.7 ⁰C temperature drop we observed 22.6 % power efficiency increase.
To verify our results, we included the work of Sharma et al. which matched almost perfectly with our results.
52
Figure 4.52. Efficiency increase values with respect to time.
In Figure 4.52, efficiency increase values that was recorded in our field experiment were shown including experiment time interval.
53 PART 5
CONCLUSION AND FUTURE PLAN
This study covered entire steps of PV panel, heat sink design and usage. Throughout field experiment, two identical PV panels were used. At the initial stage of this study, after considering available heat sink designs, a base design was determined. Following the parameters of fin type, fin number and fin layout, further studies were structured on the base design with a novel approach. In the next stage, determined designs were simulated on ANSYS Fluent software considering airflow velocity, solar radiation, and airflow direction. After reviewing simulation results, one of the designs which was thought to be best choice for production was manufactured and used in field experiment. In the last stage of this work, produced heat sink was mounted to the bottom of the PV panel and field experiment was accomplished in Karabük University.
To be certain about the effectiveness of chosen heat sink, field experiment was conducted. During this experiment, temperature, voltage, and power values were recorded to calculate the efficiency values of both panels. Field experiment was carried out between 10:00 and 16:00 in Karabük University. During the experiment, with the help of anemometer, wind speed was recorded which was varied between 1 m/s and 3 m/s. At the same time, thermal camera and four multimeters were used to record instant surface temperature and power output values of the PV panel in 20 minutes intervals.
After getting results, necessary calculations were done to find the efficiency values. In the light of these findings, the efficiency difference between PV panel with and without heat sink was found in between 20 to 30 percent range.
In addition, because the simulations gave us different thermal results in different air-flow rates, the determination of heat sink type in different locations could also be done.
54
For instance, in our case with approximately 1.5 m/s air velocity, last design should be used considering simulation results.
For the future, two different ways could be followed. For the first option, an additional experiment using base design could be fulfilled because base design is more economically feasible and easy to produce. Although the design that we chose seems more efficient in simulations, in field experiments base design could possibly shows better performance. For that reason, to be on the safe side in cost analysis, it could be suggested that base design could also be used in the same experiment. For the second option, since the efficiency values of PV panel with the chosen heat sink seems promising, further analysis could be done and including the cost analysis, better performing PV systems could be created.
55
REFERENCES
1. Amanlou, Y., Tavakoli Hashjin, T., Ghobadian, B., and Najafi, G., "Air cooling low concentrated photovoltaic/thermal (LCPV/T) solar collector to approach uniform temperature distribution on the PV plate", Applied Thermal Engineering, 141 (May): 413–421 (2018).
2. Castanheira, A. F. A., Fernandes, J. F. P., and Branco, P. J. C., "Demonstration project of a cooling system for existing PV power plants in Portugal", Applied Energy, 211 (August 2017): 1297–1307 (2018).
3. Golzari, S., Kasaeian, A., Amidpour, M., Nasirivatan, S., and Mousavi, S., "Experimental investigation of the effects of corona wind on the performance of an air-cooled PV/T", Renewable Energy, 127: 284–297 (2018).
4. Hasanuzzaman, M., Malek, A. B. M. A., Islam, M. M., Pandey, A. K., and Rahim, N. A., "Global advancement of cooling technologies for PV systems: A review", Solar Energy, 137: 25–45 (2016).
5. Idoko, L., Anaya-Lara, O., and McDonald, A., "Enhancing PV modules efficiency and power output using multi-concept cooling technique", Energy Reports, 4: 357–369 (2018).
6. Kayabasi, E. and Kurt, H., "Simulation of heat exchangers and heat exchanger networks with an economic aspect", Engineering Science And Technology, An International Journal, 21 (1): 70–76 (2018).
7. Ozturk, S., Kayabasi, E., Celik, E., and Kurt, H., "Determination of lapping parameters for silicon wafer using an artificial neural network", Journal Of Materials Science: Materials In Electronics, 29 (1): 260–270 (2018).
8. Praveen kumar, B., Prince Winston, D., Pounraj, P., Muthu Manokar, A., Sathyamurthy, R., and Kabeel, A. E., "Experimental investigation on hybrid PV/T active solar still with effective heating and cover cooling method", Desalination, 435 (August 2017): 140–151 (2018).
9. Rajput, U. J. and Yang, J., "Comparison of heat sink and water type PV/T collector for polycrystalline photovoltaic panel cooling", Renewable Energy, 116: 479–491 (2018).
10. Al-Addous, M., Dalala, Z., Class, C. B., Alawneh, F., and Al-Taani, H., "Performance analysis of off-grid PV systems in the Jordan Valley", Renewable Energy, 113: 930–941 (2017).
11. Alami, A. H., "Microstructural, optical and thermal characterization of synthetic clay as a passive cooling medium", Energy Conversion And Management, 88: 442–446 (2014).
56
12. Irwan, Y. M., Leow, W. Z., Irwanto, M., Fareq, M., Amelia, A. R., Gomesh, N., and Safwati, I., "Indoor Test Performance of PV Panel through Water Cooling Method", Energy Procedia, Elsevier B.V., 604–611 (2015).
13. Najafi, H. and Woodbury, K. A., .
14. Schiro, F., Benato, A., Stoppato, A., and Destro, N., "Improving photovoltaics efficiency by water cooling: Modelling and experimental approach", Energy, 137: 798–810 (2017).
15. Kayabasi, E., Ozturk, S., Kucukdogan, N., and Savran, M., "Recent Developments in Energy and Solar Energy", The Most Recent Studies In Science And Art, 1883–1892 (2018).
16. Ebaid, M. S. Y., Ghrair, A. M., and Al-Busoul, M., "Experimental investigation of cooling photovoltaic (PV) panels using (TiO2) nanofluid in water -polyethylene glycol mixture and (Al2O3) nanofluid in water- cetyltrimethylammonium bromide mixture", Energy Conversion And Management, 155 (November 2017): 324–343 (2018).
17. Kaya, H., Arslan, K., and Eltugral, N., "Experimental investigation of thermal performance of an evacuated U-Tube solar collector with ZnO/Etylene glycol-pure water nanofluids", Renewable Energy, 122: 329–338 (2018).
18. Kayabasi, E., Kurt, H., and Celik, E., "Determination of micro sized texturing and nano sized etching procedure to enhance optical properties of n-type single crystalline silicon wafer", Journal Of Materials Science: Materials In Electronics, 28 (18): 14085–14090 (2017).
19. Shukla, A., Kant, K., Sharma, A., and Biwole, P. H., "Cooling methodologies of photovoltaic module for enhancing electrical efficiency: A review", Solar Energy Materials And Solar Cells, 160 (October 2016): 275–286 (2017). 20. Zhang, Y., Sakhuja, M., Lim, F. J., Tay, S., Tan, C., Bieri, M., Krishnamurthy,
V. A., Wang, D., Krishnakumar, P. K., Ha, J., Zhao, L., and Reindl, T., "The PV System Doctor - Comprehensive diagnosis of PV system installations", Energy Procedia, 130: 108–113 (2017).
21. Kumar, M. and Kumar, A., "Performance assessment and degradation analysis of solar photovoltaic technologies: A review", Renewable And Sustainable Energy Reviews, 78 (May): 554–587 (2017).
22. Golušin, M., Dodić, S., and Popov, S., "Sustainable Energy Development Monitoring", Sustainable Energy Management, 335–362 (2013).
23. Demircioglu, O., "Optimization of Metalization in Crystalline Silicon Solar Cells", Middle East Technical University, (2012).
24. Parida, B., Iniyan, S., and Goic, R., "A review of solar photovoltaic technologies", Renewable And Sustainable Energy Reviews, 15 (3): 1625– 1636 (2011).
57
25. Beaucarne, G., "Silicon thin-film solar cells", Advances In OptoElectronics, 2007: (2007).
26. Özkul, F. B., Kayabasi, E., Çelik, E., Kurt, H., and Arcaklioǧlu, E., "Comparison of different cooling options for photovoltaic applications", PVCon 2018 - International Conference On Photovoltaic Science And Technologies, (2018).
27. Bayrak, F., Oztop, H. F., and Selimefendigil, F., "Experimental study for the application of different cooling techniques in photovoltaic (PV) panels", Energy Conversion And Management, 212 (March): 112789 (2020).
28. Özkul, F. B., Kayabasi, E., Çelik, E., Kurt, H., and Arcaklioǧlu, E., "Investigating the effects of cooling options on photovoltaic panel efficiency: State of the art and future plan", PVCon 2018 - International Conference On Photovoltaic Science And Technologies, 1–6 (2018).
29. Al-Waeli, A. H. A., Sopian, K., Chaichan, M. T., Kazem, H. A., Ibrahim, A., Mat, S., and Ruslan, M. H., "Evaluation of the nanofluid and nano-PCM based photovoltaic thermal (PVT) system: An experimental study", Energy Conversion And Management, 151 (July): 693–708 (2017).
30. Ebrahimi, M., Rahimi, M., and Rahimi, A., "An experimental study on using natural vaporization for cooling of a photovoltaic solar cell ☆", International Communications In Heat And Mass Transfer, 65: 22–30 (2015).
31. Rahimi, M., Asadi, M., Karami, N., and Karimi, E., "A comparative study on using single and multi header microchannels in a hybrid PV cell cooling", Energy Conversion And Management, 101: 1–8 (2015).
32. Rostami, Z., Rahimi, M., and Azimi, N., "Using high-frequency ultrasound waves and nanofluid for increasing the efficiency and cooling performance of a PV module", Energy Conversion And Management, 160 (January): 141–149 (2018).
33. Al-Waeli, A. H. A., Chaichan, M. T., Kazem, H. A., and Sopian, K., "Comparative study to use nano-(Al2O3, CuO, and SiC) with water to enhance photovoltaic thermal PV/T collectors", Energy Conversion And Management, 148: 963–973 (2017).
34. Al-Waeli, A. H. A., Sopian, K., Chaichan, M. T., Kazem, H. A., Hasan, H. A., and Al-Shamani, A. N., "An experimental investigation of SiC nanofluid as a base-fluid for a photovoltaic thermal PV/T system", Energy Conversion And Management, 142: 547–558 (2017).
35. Soliman, A. M. A., Hassan, H., and Ookawara, S., "An experimental study of the performance of the solar cell with heat sink cooling system", Energy Procedia, 162: 127–135 (2019).
58
using PCM infused graphite and aluminium fins", Solar Energy, 114: 217–228 (2015).
37. Bergman, Lavine, Incropera, D., "Fundamentals of Heat and Mass Transfer 7th Edition", 6–8 (2003).
38. "Cableizer - Solar Radiation Calculator", https://www.cableizer.com/tools/solar_radiation/ (2020).
39. Grubišić-Čabo, F., Nižetić, S., Čoko, D., Marinić Kragić, I., and Papadopoulos, A., "Experimental investigation of the passive cooled free-standing photovoltaic panel with fixed aluminum fins on the backside surface", Journal Of Cleaner Production, 176: 119–129 (2018).
40. Mojumder, J. C., Chong, W. T., Ong, H. C., Leong, K. Y., and Abdullah-Al-Mamoon, "An experimental investigation on performance analysis of air type photovoltaic thermal collector system integrated with cooling fins design", Energy And Buildings, 130: 272–285 (2016).
41. Sharma, S., Tahir, A., Reddy, K. S., and Mallick, T. K., "Performance enhancement of a Building-Integrated Concentrating Photovoltaic system using phase change material", Solar Energy Materials And Solar Cells, 149: 29–39 (2016).
59 RESUME
Feyzullah Behlül ÖZKUL was born in Istanbul in 1990 and he graduated first and elementary education in this city. He completed high school education in Çağdaş Eğitim College in İzmir, after that, he started Middle East Technical University Department of Petroleum and Natural Gas Engineering in 2009. Then in 2017, he became Research Assistant in Karabuk University Department of Mechanical Engineering.
CONTACT INFORMATION
Address: Karabük University
Graduate School of Natural & Applied Science Demir-Çelik Campus/KARABUK
![Figure 4.1. Solar radiation values at the day and location during experiments [38].](https://thumb-eu.123doks.com/thumbv2/9libnet/5399386.101969/37.892.168.789.610.937/figure-solar-radiation-values-day-location-experiments.webp)