205
RESEARCH ARTICLE / ARAŞTIRMA MAKALESİ
COMPARATIVE METHODS IN CLASSIFICATION OF EMG SIGNALS Ayten AKBAY
Altınbaş University, Graduate School of Science and Engineering, Electrical and Computer Engineering, Istanbul [email protected] ORCID No: 0000-0001-6172-8546
Oğuz BAYAT
Altinbaş University, School of Engineering and Natural Sciences, Department of Software Engineering, Istanbul [email protected] ORCID No: 0000-0001-8428-2380
RECEIVED DATE/GÖNDERİ TARİHİ: 30.09.2019 ACCEPTED DATE/KABUL TARİHİ: 24.12.2019 Abstract
With the development of medical applications, the processing of electromyography signals has gained an important place in biomedical field. The detection, processing and classification of EMG signals is crucial because it enables a more standard assessment of different neuromuscular diseases [Kehri et al.( 2016)]. This article examines neuromuscular diseases based on EMG signals by using classification methods as Multilayer Perceptron Neural Networks and C4,5 decision tree classifiers. In these methods, an autoregressive (AR) EMG signal model was used as input to the classification system. 1200 MUAPs data gathered from 7 healthy subjects, 7 myopathy patients and 13 neurogenic patients were analyzed. Total accuracy of Multilayer Perceptron algorithm is 98.1% and the total accuracy of C4.5 Decision Tree is 94.8%. Comparisons between these two classifiers are made using a set of scalar performance criteria for classification.
Keywords: EMG, Neural networks, Decision trees, Myopathy, Neuropathy.
ELEKTROMİYOGRAFİ SİNYALLERİNİN SINIFILANDIRILMASINDA KULLANILAN KARŞILAŞTIRMALI METODLAR
Özet
Tıbbi uygulamaların gelişmesiyle birlikte elektromiyografi sinyallerinin işlenmesi biyomedikal alanda önemli bir yer edinmiştir. EMG sinyallerinin tespiti, işlenmesi ve sınıflandırılması farklı nöromüsküler hastalıkların daha standart bir değerlendirme sağlanması açısından oldukça önemlidir. Bu makale EMG sinyallerine dayanan nöromüsküler hastalıkları Çok Katmanlı Algı Sinir Ağları ve C4,5 Karar Ağacı sınıflandırma yöntemlerini kullanarak incelemektedir.
206
1. INTRODUCTION
Medical data classification is an effective factor in the rapid diagnosis and early treatment. Due to the great impact of biomedical research on human life, the classification of medical data continues to improve in the software field. Accurate and rapid classification of medical data helps specialists make more accurate decisions on serious diseases. Symptoms of patients are used as the nature of a disease data set that takes into account the number of samples [Bayat et al.( 2018)].
Artificial Neural Networks is a very successful technology used in solving many real world problems in recent years [Cohen (2006)]. Decision trees are frequently used algorithms in data classification as well as artificial neural networks. Decision trees are simple in structure and are highly sensitive.
In this study, the use of Multilayer Perceptron and C4.5 algorithms in the classification of neuromuscular diseases has been examined. In Chapter 2, the materials and methods used for classification are given. In Chapter 3, the results obtained and the accuracy of the methods used are discussed. Chapter 4 explains the conclusion.
2. MATERIALS AND METHODS 2.1. Subject and Data Acquisition
The data set was obtained from subjects in the Department of Neurology of Gaziantep University and its measurements were performed here. Diagnostic criteria were determined for patients selected and evaluated according to clinical findings and muscle biopsy was performed when necessary. The specialists evaluated the subject as normal, myopathic and neurogenic. EMG data from 27 subjects were analyzed and these data were obtained from 7 normal, 7 myopathic patients and 13 neurogenic patients [Yaman
et al.( 2011)].
The EMG signal was taken from the biceps brachial using a coaxial needle electrode. In each muscle, minimum 20 MUAPS were gathered by inserting 5 to 7 muscle. At force levels, the EMG signal obtained under isometric conditions of approximately 30% of the maximum voluntary muscle contraction (MVC) was recorded. The signal was obtained over 5 seconds, the band pass was filtered at 5-10 kHz, and sampled with 12 bit A / D resolution at 20 kHz. After all the EMG signal was filtered at low pass 2 kHz [Subasi, Yılmaz and Ozcalik (2006)].
207
Figure 1:Normal, myopathic and neurogenic EMG signals [Mumenthaler and Mattle, (2002)].
a) Normal: Full interface design
b) Re-innervation after a peripheral nerve deformation: personal oscillations c) Total denervation: fibrillation potentials and positive sharp waves
d) Myopathy: a complete interface design despite weakness. The amplitude of each potential is low, which forms the state and is partially fragmented and multiphase.
2.2. AR Method for Spectral Analysis
Parametric methods are obtained by modeling x (n) data series as the output value of a linear system qualified by a rational system. The first of the two steps constituting the spectrum estimation is calculated from the data series defined as the parameters x (n), 0 ≤ n≤N-1.
For the second step, the PSD estimate is from the previous one acquired in the first step. AR method is known as the most widely used parametric method because it facilitates calculation AR methods by
208
solving linear equations. Data can be modeled as the output of a causal, all-pole, discrete filter in the AR method [Yaman et al. (2011)].
The following equation is the representation of the p-series AR method.
× (n) = [Hojjat, Zhou, Dadmehr (2003)]. In the following equation, the AR coefficients are defined by a (k), w (n) is the white variance noise equal to . The AR (p) model can be defined by the AR parameters {a [1], a [2] ... a [p], }. The PSD is
[Cohen (2006) ] . where
[Güler et al. (2001)].
2.3. Classification Methods
2.3.1. Multilayer perceptron neural network model
Neural networks are an excellent practice in recognizing diseases using scans, because there is no need to identify diseases by creating a specific algorithm because it is learned by sampling. It is very important that the selected samples are reliable and sufficient in processing data.
ANN can be used as a classification model by matching the input data to the desired approximate output and consists of an input layer (the layer receiving the inputs), the output layer (the output providing layer), and the hidden layers between them [Bayat et al.(2018)].
With this modeling application, classes can be created which determine which input combination belongs to normal myopathic or neuropathic classifiers. It is used in conjunction with ANN back propagation algorithm to solve pattern classification problems. The contribution of such neural networks is to be an effective training algorithm and to comprehend the behavior of the system.
Determining the input parameters of neural networks is very important for the high performance of neural networks to differentiate between normal, myopathic and neuropathic issues.
It must be specified how training and test data should be differentiated in the use of artificial neural networks. In this study, 18 patient data were used for training and 9 patients were used for testing. In order to achieve a more accurate result in comparison of artificial neural networks, the data of 5 patients were selected. Since the output class is 3, the artificial neural network also has 3 outputs. The basic vectors represent the outputs as follows :
209
[ 1 0 0 ] = normal ; [ 0 1 0 ] = myopathy ; [ 0 0 1 ] = neuropathy .
The entries of the second layer of the network are compose of 9 values corresponding to the three output groups of the first layer of the network. The aim of the second network layer are the same as those of the original data.
If the initial weights are randomly distributed, the ANN outputs will have a different classification than desired. During ANN training, ANN weights are continuously regulated and the desired responses are close to each other in order to obtain the result of the system.
Observing error changes and accuracy parameters during the expansion of the hidden network layer size for each training round is the basis for determining the optimal network. The error is defined as the difference between the desired response and the system output and the error rate can be measured in different ways. The most commonly used methods for error measurement are SSE (Sum Square Error) and MSE (Mean Square Error).
The Multilayer Perceptron is designed with an AR (autoregressive) spectrum of EMG signals. In this structure, the input signal is formed by 16 separate waves. The output layer consists of 3 nodes indicating normal myopathic and neurogenic diseases.
When working on the architecture of ANN, one and two hidden layers, which are hidden node variables used in each layer, are used. A hidden layer appears to be effective in solving the current problem. In this study, the required neural network should consist of three layers: the input layer, the hidden layer and the output layer. The network processes the records separately and the training phase begins to use the weights and functions in the hidden layer. In addition, subjects that had never been used in the developmental stage of the neural network tested the accuracy comparison in test data and training data in the predicted performance of the neural network. Adding nodes expand the neural network one by one to the hidden layer, and the steps taken to form the neural network are repeated as long as the best architecture and the best network link weight are set.
2.3.2. Decision trees
A decision tree is a classification method used to divide a data set containing a large number of records into smaller clusters by applying a set of decision rules. Decision trees are an algorithm that creates a model in the form of tree structure consisting of decision nodes and leaf nodes according to the desired properties and the desired result in the data. The data set to be used in classification problems using decision tree algorithm should be divided into two main parts (training and test). The algorithm creates a model using the training data. This model is applied on the test data and the success of the model in problem solving is calculated.
210
The main aim of the decision tree at this step is to create roots and leaves that will specify which entry combination belongs to normal myopathic or neuropathic classifiers. In this paper, C4.5 decision tree algorithm was run to find the solution for the classification problem. C4.5 The decision tree classifier follows a simple algorithm. In order to classify the data, it is first necessary to establish a decision tree based on the qualitative values of the identified training data. Therefore, whenever it enters a training set, it classifies the feature that clearly differentiate the samples. For the highest level of confidential information acquisition, this feature helps us tell the most about data samples. Then, if there is a value that does not have ambiguity for the specified property that falls into its category, this data sample helps to decide the target value. This branch is then terminated and allocated to it with the target value obtained. In other cases, the operation is repeated until the program’s attributes are exhausted or makes a clear decision as to which combination of attributes gives us a specific target value. The data used in this thesis were taken from 27 subjects. Since the number of output classes is three, there are 3 outputs in the decision tree that generates code for each class. Since the decision tree is made, the property obtained for the tree follows the order of selection. Now, by checking all properties and values, the target value of the new case can be assigned or estimated.
2.4. Cross Validation
When comparing machine learning models to find out which model that can solve the current problem, Cross Validation (CV) is often used [Basheer and Hajmeer (2000)]. Cross-validation in general performs as follows: • Divide the data into fixed number of splits(folds) • Choose the first fold for testing and use the rest of folds for training. • Make classification on this data and acquire performance metrics. • Choose the next splitting as testing while the remaining as training data. • Classification is repeated until each partition is used for the testing. • Compute an average performance from the individual experiments [Haselsteiner and Pfurtscheller (2000)]. 3. RESULTS
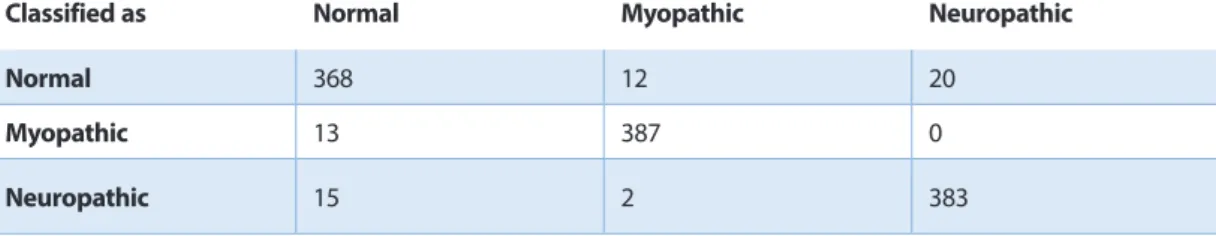
The first algorithm used for classification is the C4.5 decision tree. Decision tree created at 0.2 seconds. The algorithm tree consists of 59 nodes and 30 leaves. 0.5 reliability factor was used in the algorithm. With these numbers, the best C4.5 decision tree results were obtained. The confusion matrix of C4.5 decision tree is shown below.
211 Table 1: C4.5 Confusion Matrix
Classified as Normal Myopathic Neuropathic
Normal 368 12 20
Myopathic 13 387 0
Neuropathic 15 2 383
The second algorithm used in the classification is a multi-layer perceptron. The artificial neural network model ran in 10.39 seconds. . The algorithm works with a learning rate of 0.4 that provides the change in weight value. Increased learning speed affects the change in weight values. The learning process is usually shortened each time. The algorithm also works with a momentum of 0.6 that compensates for the weight change without any substantial overhaul, using a combination of a portion of the previous weight change and a combination of the gradient lowering term. Each time 600 periods pass the entire training set and then test the verification set. These values enabled us to achieve the best multiple perceptron results. The following table shows the confusion matrix of the MLP neural network.
Table 2: Multilayer Perceptron Confusion Matrix
Classified as Normal Myopathic Neuropathic
Normal 387 8 5
Myopathic 8 392 0
Neuropathic 2 0 398
Table 3: Stratified Cross-Validation Correctly classified instances Incorrectly classified instances Total number of instances C4.5 1138 94.8333 % 62 5.1667 % 1200 MLP 1177 98.0833 % 23 1.9167 % 1200
212
The table above shows the success rate of the MLP.
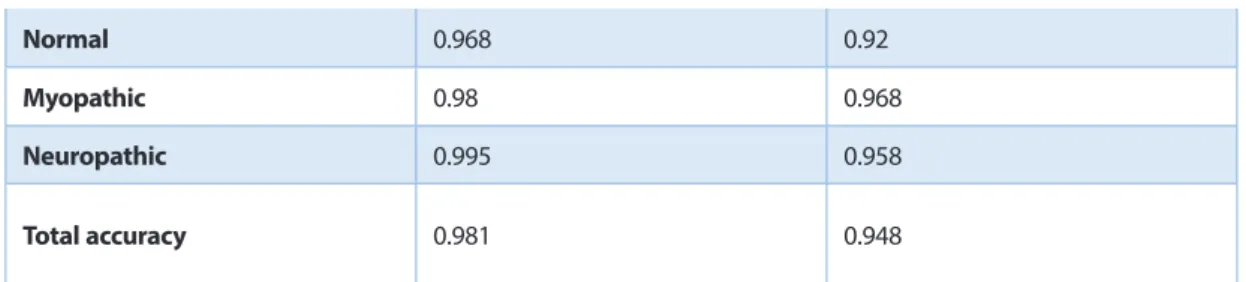
Table 4: Detailed Accuracy by Class
TP rate for MLP TP rate for C4.5
Normal 0.968 0.92
Myopathic 0.98 0.968
Neuropathic 0.995 0.958
Total accuracy 0.981 0.948
The detailed accuracy table shows the TP ratios (True Positive ratio) of C4.5 and MLP. Normal subjects had a TP ratio of 0.968 (MLP) and 0.92 (C4.5), respectively. Myopathic subjects had a TP ratio of 0.98 (MLP) and 0.968 (C4.5). Neuropathic subjects had a TP ratio of 0.995 (MLP) and 0.958 (C4.5). The total accuracy of MLP is 0.981 and the total accuracy of C4.5 is 0.948.
The results show that MLP classifies more accurately than C4.5.
4. CONCLUSION
This study examines the comparative classification of EMG signals using a Multilayer Perceptron and C4.5 Decision Tree. This study examines the comparative classification of EMG signals using a Multilayer Perceptron and C4.5 Decision Tree.
According to the classification, the Multilayer Sensors have an algorithm that is more accurate than C4.5. The use of multi-layer perceptron in classification will be more effective for experts.
1200 MUAPs from 7 normal, 7 myopathic and 13 neuropathic subjects were examined. The C4.5 decision tree correctly classified 1138 samples (94.83%), 62 misclassified samples (5.16 %.). Multilayer Perceptron correctly classified 1177 samples (98.08%) misclassified 23 samples (1.91%). The total accuracy of the Multilayer Perceptron algorithm is 98.1% and the total accuracy of the C4.5 Decision Tree is 94.8%. In Multilayer Perceptron, normal patients have the lowest success in classification and neuropathic patients have the highest success in classification. The classification success rate of normal subjects is the lowest and for myopathic subject is the max. in C4.5.
Although Multilayer Perceptron learns in more time than C4.5, the result (accuracy) is remarkable and the C4.5 Decision Tree is easier to interpret. Decision Trees and Artificial Neural Networks have many positive and negative aspects, but recent research continues to work on a hybrid algorithm that uses the positive side of both algorithms.
213 Conflict of Interests/Çıkar Çatışması
Authors declare no conflict of interests/Yazarlar çıkar çatışması olmadığını belirtmişlerdir
References
Basheer, I. A., & Hajmeer, M. (2000). Artificial neural networks: fundamentals, computing, design, and
application. J Microbiol Meth, 3–31.
Bayat, Oğuz; Salman, İhsan; Uçan, Osman Nuri; Shaker, Khalid;. (2018). Impact of Metaheuristic
Iteration on Artificial Neural Network Structure in Medical Data. İstanbul: MDPI Open Access Journals.
Cohen, A. (2006). Biomedical signals: Origin and dynamic characteristics; frequency-domain analysis. Medical Devices and Systems.
Elamvazuthi, I.; Duy, N.H.X; , Zulfiqar Ali; Su, S.W.; Ahamed Khan, M.K.A.; S., Parasuraman;. (2015).
Electromyography (EMG) based Classification of Neuromuscular Disorders using Multi-Layer Perceptron.
International Symposium on Robotics and Intelligent Sensors. Malaysia.
Güler, İnan; Kıymık, Mustafa Kemal; Akın, Mehmet; Alkan, Ahmet;. (2001). AR spectral analysis of
EEG signals by using maximum likelihood estimation. Computers in Biology and Medicine, 31(6), 441-450.
Haselsteiner, E., & Pfurtscheller, G. (2000). Using time-dependent neural networks for EEG classification. IEEE Trans Rehab Eng, 457–63.
Hojjat, Adeli; Ziqin, Zhou; Nahid, Dadmehr;. (2003). Analysis of EEG records in an epileptic patient
us,ng wavelet transform. Journal of Neuroscience Methods, 123(1), 69-87.
Kehri, V.; Ingle, R.; Awale, R.; Oimbe, S.;. (2016). Techniques of EMG signal analysis and classification of
neuromuscular diseases. Atlantis Press.
Mumenthaler, M., & Mattle, H. (2002). Neurology. Thieme Medical Publishers.
Subasi, A., Yılmaz, M., & Ozcalik, R. (2006). Classification of EMG signals using wavelet neural network. Journal of Neuroscience Methods, 360–367.
Yaman, E.; Yaman, M.A; Subaşı, A.; Rattay, F.;. (2011). EMG SIGNAL CLASSIFICATION USING DECISION
![Figure 1:Normal, myopathic and neurogenic EMG signals [Mumenthaler and Mattle, (2002)].](https://thumb-eu.123doks.com/thumbv2/9libnet/5476516.106095/3.807.246.584.141.629/figure-normal-myopathic-neurogenic-emg-signals-mumenthaler-mattle.webp)