A DESCRIPTIVE INVESTIGATION OF TURKISH HIGH SCHOOL STUDENTS’ SPATIAL VISUALIZATION
ABILITY
A MASTER’S THESIS
BY
DİLARA TOPLU
THE PROGRAM OF CURRICULUM AND INSTRUCTION
İHSAN DOĞRAMACI BILKENT UNIVERSITY ANKARA JULY 2020 Dİ L AR A T OP L U 2020
COMP
COMP
A Descriptive Investigation of Turkish High School Students’ Spatial Visualization Ability
The Graduate School of Education of
İhsan Doğramacı Bilkent University
by
Dilara Toplu
In Partial Fulfilment of the Requirements for the Degree of Master of Arts
in
Curriculum and Instruction Ankara
İHSAN DOĞRAMACI BILKENT UNIVERSITY GRADUATE SCHOOL OF EDUCATION
A Descriptive Investigation of Turkish High School Students’ Spatial Visualization Ability
Dilara Toplu June 2020
I certify that I have read this thesis and have found that it is fully adequate, in scope and in quality, as a thesis for the degree of Master of Arts in Curriculum and
Instruction.
---
Assoc. Prof. Dr. Erdat Çataloğlu (Supervisor)
I certify that I have read this thesis and have found that it is fully adequate, in scope and in quality, as a thesis for the degree of Master of Arts in Curriculum and
Instruction.
---
Prof. Dr. Alipaşa Ayas (Examining Committee Member)
I certify that I have read this thesis and have found that it is fully adequate, in scope and in quality, as a thesis for the degree of Master of Arts in Curriculum and
Instruction.
---
Prof. Dr. Behiye Ubuz, Middle East Technical University (Examining Committee Member)
Approval of the Graduate School of Education
---
iii
ABSTRACT
A Descriptive Investigation of Turkish High School Students’ Spatial Visualization Ability
Dilara Toplu
M.A. in Curriculum and Instruction Supervisor: Assoc. Prof. Dr. Erdat Çataloğlu
June 2020
The purpose of this study was to investigate Turkish high school students’ spatial visualization ability. Gender, school type, and grade were used as independent variables to describe spatial visualization ability as it pertains to the respective dimensions. Descriptive research was used, and the sample consisted of 555 students from private and state high schools. The study was carried out in Çankaya, Ankara. The “Purdue Spatial Visualization Test - PSVT” developed by Roland Guay in 1976, adapted into Turkish by Sevimli (2009) was used to measure students’ spatial
visualization abilities. The data collection took place during the fall semester of the 2018-2019 academic year. The data analyses were conducted by considering students’ total scores of PSVT. Descriptive statistical analyses were conducted to determine students’ spatial visualization levels based on the variables: gender, school type, and grade. An independent samples t-test was conducted to determine whether the mean difference between gender and school types were statistically significant. Welch’s ANOVA test was conducted to determine whether the mean difference between grades was statistically significant. Moreover, Pearson correlation coefficients were computed to find out if there were relationships between the students’ PSVT total scores and their mathematics course grades, also for their socioeconomic status. Analyses revealed that students’ spatial visualization levels were dependent on their gender and school type. It was found that there was not a statistically significant difference between the PSVT mean scores of grades. There was a significant, positive correlation between students’ spatial visualization levels and mathematics grades and socioeconomic status.
iv
ÖZET
Ankara’nın Çankaya İlçesindeki Lise Öğrencilerinin Görsel Uzamsal Becerileri Üzerine Nicel Bir Çalışma
Dilara Toplu
Yüksek Lisans, Eğitim Programları ve Öğretim Tez Yöneticisi: Doç. Dr. Erdat Çataloğlu
Haziran 2020
Bu çalışmanın amacı, Türk lise öğrencilerinin uzamsal görselleştirme becerilerini araştırmaktır. Bu çalışmada cinsiyet, okul türü ve sınıf seviyeleri değişkenleri kullanılmıştır. Çalışmada betimleyici araştırma yöntemi kullanılmıştır ve örneklem bir özel okul ve iki devlet lisesinden 555 lise öğrencisinden oluşmaktadır. Çalışma Ankara'nın Çankaya ilçesinde gerçekleştirildi. Kullanılan enstrüman Sevimli (2009) tarafından “Purdue Uzamsal Görselleştirme Testi- PUGT” nin orijinal İngilizce versiyonu kullanılarak Türkçe’ ye uyarlanmıştır. PUGT, öğrencilerin uzamsal görselleştirme becerilerini ölçmek için 1976 yılında Roland Guay tarafından geliştirilmiştir. PUGT 36 çoktan seçmeli, tek doğru cevaplı soru içermektedir. Veri toplama 2018-2019 akademik yılının sonbahar döneminde gerçekleşmiştir. Verilerin analizleri, öğrencilerin PUGT toplam puanları dikkate alınarak yapılmıştır.
Öğrencilerin cinsiyet, okul türü ve sınıf seviyeleri değişkenlerine göre uzamsal görselleştirme beceri seviyelerini belirlemek için betimleyici istatistiksel analiz yapılmıştır. Cinsiyet ve okul türünün kendi içindeki gruplarının ortalama skorları arasında belirleyici bir fark olup olmadığını ortaya koymak için bağımsız
örneklemler t-testi kullanılmıştır. Sınıf seviyelerinin ortalama skorları arasında belirleyici bir fark olup olmadığını belirlemek için tek yönlü varyans analizi
yapılmıştır. Ayrıca, öğrencilerin PUGT toplam puanı ile matematik dönem sonu ders notları arasında ve sosyoekonomik durumları arasında ilişki olup olmadığını
öğrenmek için Pearson korelasyon katsayıları hesaplanmıştır. Analizler öğrencilerin uzamsal görselleştirme seviyelerinin cinsiyet ve okul türlerine bağımlı olduğunu ortaya koymuştur. Ayrıca, PUGT ortalama puanları ile sınıf seviyeleri arasında istatistiksel olarak anlamlı bir fark olmadığı bulunmuştur. Öğrencilerin uzamsal görselleştirme seviyeleri ile matematik notları ve sosyoekonomik durumları arasında anlamlı ve pozitif bir korelasyon bulunmuştur.
v
ACKNOWLEDGEMENTS
First and most of all, I would like to thank my supervisor, Assoc. Prof. Dr. Erdat Cataloğlu, for his guidance through each stage of the process and inspiring me to stick to my research ambitions and he has provided tremendous guidance and
invaluable feedback that helped me during this research process without his help this study would not have been possible.
I would also like to thank all members of Bilkent University for the opportunity to complete my masters’ degree with a full scholarship and believing in me, the members of the Graduate School of Education, CITE program for their support and encouragement that helped and supported me throughout the process from beginning to end.
Last, but not least, and more importantly I would like to thank my mother and my family for encouraging me and offering moral support throughout each stage and without their unwavering moral support I would not be where I stand today.
vi TABLE OF CONTENTS ABSTRACT ... iii ACKNOWLEDGEMENTS ... v TABLE OF CONTENTS ... vi LIST OF TABLES ... x
LIST OF FIGURES ... xii
CHAPTER 1: INTRODUCTION ... 1 Introduction ... 1 Background ... 3 Problem ... 7 Purpose ... 8 Research questions ... 9 Significance ... 9
Definition of key terms ... 10
CHAPTER 2: REVIEW OF RELATED LITERATURE ... 12
Introduction ... 12
The studies conducted with Purdue Spatial Visualization Test (PSVT) ... 13
Studies investigating possible relations of spatial ability to gender-differences ... 15
Studies in favour of males ... 17
Studies that showed no difference ... 19
Spatial ability as it relates to grade level and/or age ... 21
Spatial ability as it relates to mathematics achievement ... 22
vii CHAPTER 3: METHOD ... 30 Introduction ... 30 Research design ... 31 Context... 33 Sample ... 33 Instrumentation ... 38
Purdue Spatial Visualization Test (PSVT) ... 39
PSVT’s constructs and explanations of these constructs ... 40
Developments: First construct of PSVT ... 40
Rotations: Second construct of PSVT ... 41
Views: Last construct of PSVT ... 42
Demographic form ... 44
Method of data collection ... 45
Method of data analysis ... 46
CHAPTER 4: RESULTS ... 48
Introduction ... 48
The descriptive result on students’ PSVT scores ... 48
Determining the levels of students’ spatial visualization ability based on total PSVT scores ... 52
Correct, incorrect, and unanswered percentage of PSVT responses ... 58
PSVT total and its constructs scores: Gender ... 60
Students’ levels of spatial visualization ability: Gender ... 62
PSVT total and its constructs scores: School type ... 63
Students’ levels of spatial visualization ability: School type ... 65
viii
Students’ levels of spatial visualization ability: Grade ... 70
PSVT total and its constructs scores: SES ... 70
Further evidence towards the research questions ... 71
Statistical analysis between female vs. male PSVT mean score differences ... 71
PSVT scores item analysis by gender ... 72
Statistical analysis between female vs. male PSVT mean score differences by constructs ... 74
Statistical analysis between private and state school students’ PSVT mean score differences ... 75
Statistical analysis between private and state school students’ PSVT mean score differences by constructs ... 75
Statistical analysis among students’ PSVT mean score differences by grades ... 76
Correlation analysis between students’ PSVT scores and mathematics course grades ... 77
Correlation analysis between students’ PSVT scores and socioeconomic status ... 78
Conclusion ... 79
CHAPTER 5: DISCUSSION ... 80
Introduction ... 80
Major findings ... 81
Discussion on descriptive data results ... 81
Discussion on results on gender ... 84
ix
Discussion of results on grades ... 89
Discussion of results on mathematics course grades ... 91
Discussion of results on SES levels ... 93
General results... 93
Implications for practice ... 94
Implications for further research ... 95
Limitations ... 99
REFERENCES ...100
APPENDICES ...109
Appendix A: Turkish version of Purdue Spatial Visualization Test ...109
Appendix B: Demographic Form ...130
Appendix C: Permission for PSVT ...131
x
LIST OF TABLES
Table Page
1 Timetable of thesis ... 30
2 Schools and number of the participant students ... 33
3 PSVT constructs and corresponds items ... 40
4 Cronbach’s alpha test result for PSVT ... 43
5 Descriptive statistical results of all students’ PSVT scores ... 49
6 Students’ classification of spatial visualization abilities ... 58
7 The percentages of answered and unanswered questions by construct... 59
8 Descriptive statistical results of students’ PSVT total and the constructs scores based on gender ... 60
9 Statistics of gender for spatial visualization ability levels ... 62
10 Descriptive statistical results of students’ PSVT total and constructs scores by school types... 63
11 Statistics of school types for spatial visualization ability level ... 66
12 Descriptive statistical results of students’ PSVT total and constructs scores by grade levels ... 66
13 Statistics of grades for spatial visualization ability levels ... 70
14 Statistics of students’ SES levels ... 70
15 Independent samples t-test for PSVT total scores: Gender ... 71
16 Independent samples t-test for PSVT constructs total scores: Gender ... 75
17 Independent samples t-test for PSVT total scores: School type ... 75
18 Independent samples t-test for PSVT constructs total scores: School type ... 76
19 Test of Homogeneity of Variances ... 76
xi
21Correlation analysis between students’ PSVT total scores and mathematics course grades ... 77 22 Correlation analysis between students’ PSVT constructs’ scores and
mathematics grades ... 78 23 Correlation analysis between students’ PSVT total scores and SES ... 78 24 Correlation analysis between students’ PSVT constructs’ scores and
xii
LIST OF FIGURES
Figure Page
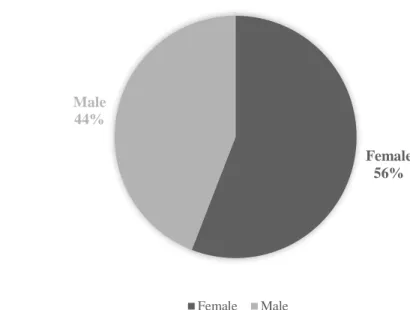
1 Percentage distribution of total participant students by gender ... 36
2 Percentage distribution of total participant students by school type... 36
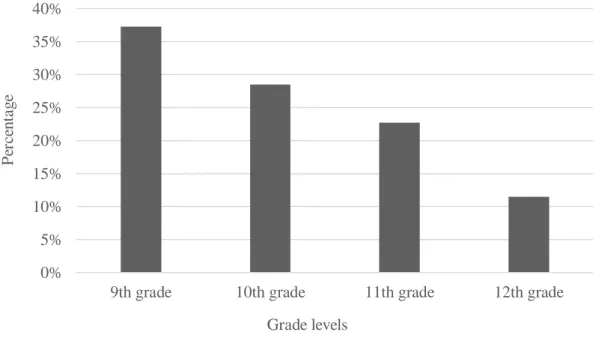
3 The percentage of total participant students by their grade levels ... 37
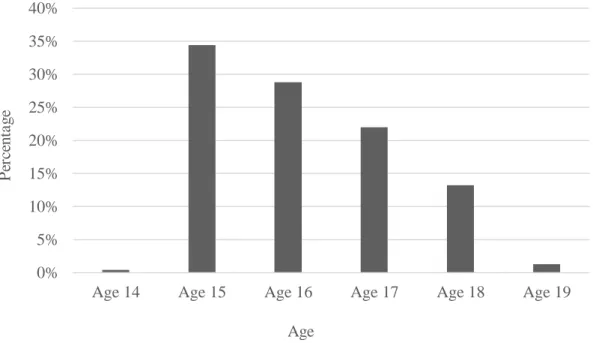
4 The percentage of total participant students by their age ... 38
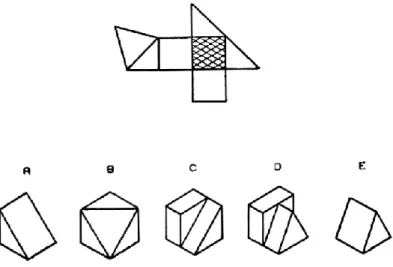
5 A sample question from the Purdue Spatial Visualization Test in developments construct ... 41
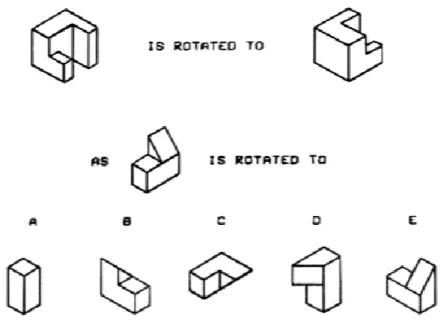
6 A sample question from the Purdue Spatial Visualization Test in rotations construct ... 42
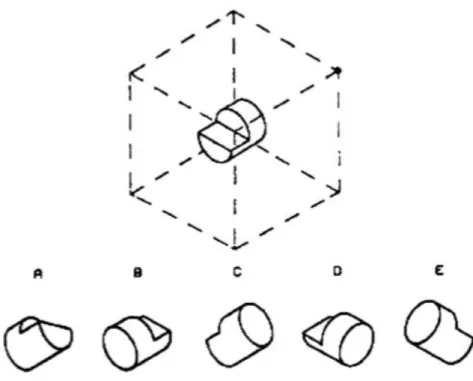
7 A sample question from the Purdue Spatial Visualization Test in views construct ... 43
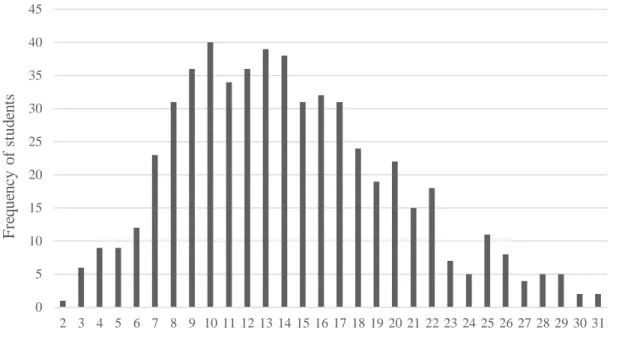
8 Overall distribution of all students’ PSVT total scores ... 50
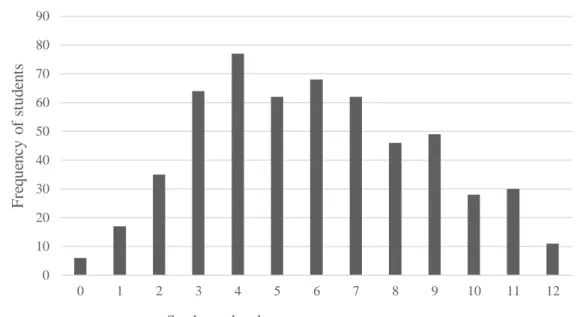
9 PSVT developments construct: Frequency distribution of all students’ scores ... 51
10 PSVT rotations construct: Frequency distribution of all students’ scores ... 51
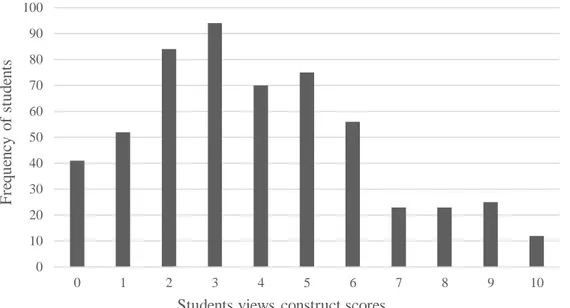
11 PSVT views construct: Frequency distribution of all students’ scores ... 52
12 Normal curve of population and sample based on all students’ total score ... 54
13 Normal curve of population and sample based on all students’ PSVT developments construct score ... 55
14 Normal curve of population and sample based on all students’ PSVT rotations construct score ... 56
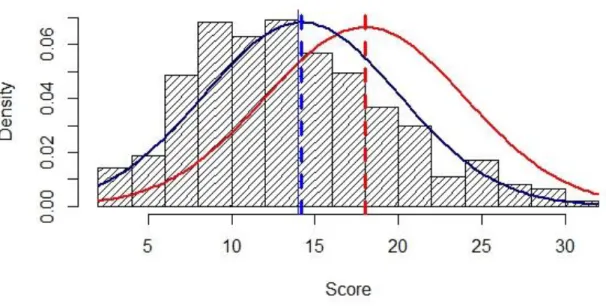
15 Normal curve of population and sample based on all students’ PSVT views construct score ... 57
xiii
17 The distribution of students’ total scores based on school type ... 65
18 The distribution of students’ total scores by grade ... 69
19 The count of unanswered items by gender ... 72
20 Item difficulty values for each item by gender ... 73
21 Item discrimination for each item by gender ... 74
1
CHAPTER 1: INTRODUCTION Introduction
In this chapter, the researcher explains the background, problem, purpose, significance of this study, and concludes with the definition of key terms.
Spatial ability is required to perceive, interpret, and adapt to changes in the environment. Having a good spatial ability skill means having a mental ability to perceive, imagine, and rotate objects mentally. Spatial ability skills make humans function efficiently and safely in the environment. Therefore, there’s no surprise that it has an important role in both daily life and education.; mathematics, especially geometry, science, engineering, etc. For instance, when someone describes an item’s location, the person draws mental maps of the object while providing the
information. We also use it in the manoeuvres we make while parking our car, trying to find a different place, using two-dimensional maps, arranging the furniture in our room and arranging the objects around us according to each other or to ourselves (down-up, front-back, right-left, high-low, far-close, internal-external). Clearly, spatial ability skills have an important place in daily life.
The importance of spatial ability places a mathematical subcategory of geometry because it focuses on shapes and objects, which helps students understand the world they live in, recognize its importance, and explore the world of shapes. In order for an individual to perform the specified mental thinking activities, that is to have good
2
geometric thinking, s/he needs a strong spatial visualization ability as a component of spatial ability. A spatial visualization ability can be defined as an ability to
perceive shapes from different perspectives, to understand the relations between two- and three-dimensional shapes, to create mentally different views, and to visualise nets of the objects. Spatial skills are also needed in order to imagine and draw the views of three-dimensional shapes in two-dimensions. Secondly, it helps to view a three-dimensional shape when drawn in a two-dimensional space. For example, when architects draw the blueprints for a building, they may use spatial ability skills to show a three-dimensional terrain on a two-dimensional map. In many studies, it has been stated that disciplines such as engineering, architecture, science, and art are related to spatial ability skills (Rafi, Anuar, Samad, Hayati, & Mahadzir, 2005).
Even though, a good number of studies conducted separately for the variables gender, grade, school type, mathematics course grades, and socioeconomic status, this study aimed to analyse the variables within one study. Also, some of the studies were conducted with elementary, middle school and college students. This study specifically aimed to describe the variables for the high school students.
There are several tests that measure spatial thinking skills. While some tests measure the spatial orientation level, some tests are concentrated on spatial relations. Among the tests, we chose the Purdue Spatial Visualization test developed by Guay in 1976. This test specifically measures the spatial visualization ability level. In addition, the test has three different sections that measure different constructs. This helped us identify areas where participants are strong, need to be improved, and/or weak.
3
Moreover, a Turkish version of the test was already available, speeding up the process of the research.
In summary, this study investigated Turkish students’ spatial visualization abilities as defined by Guay (1976). The study also examines variables such as gender, grade, school type, mathematics course grades, and socioeconomic status that are related to students’ spatial visualization ability.
Background
Spatial ability is a topic that many researchers have investigated in their studies. Furthermore, many educators advocate for the development of students’ spatial abilities during students’ school years. There is a great interest in the topic of spatial ability because this ability is needed to be successful in disciplines such as art, architecture, engineering, geometry, and science (Wai, Lubinski, & Benbow, 2009). In the literature review of their paper, Mclurg, Lee, Shavalier and Jacobsen (1997) identify a variety of studies to illustrate the role of spatial ability in various
professions. They gave examples of studies as achievement in art, achievement in physics, and achievement in mathematics. Notably, many studies highlight the importance of spatial ability for mathematics, some studies have found a statistically significant positive relationship between spatial ability and mathematics achievement (Battista, Wheatley, & Talsma, 1989; Seng & Chan, 2000; Weckbacher & Okamoto, 2014).
Although there are many studies on spatial ability, researchers have not been able to come up with a common definition for the terminology. Hence, different researchers
4
have studied spatial ability using a variety of words and explanations; consequently, in the literature, there are many different terms to describe spatial ability. Among these terms, spatial skills, spatial perception, spatial reasoning and spatial sense are the terms that define similar processes and commonly used in literature (Clements & Battista, 1992; NCTM, 2000).
Mohler (2009) notes that these varying explanations for spatial ability can be traced as far back as Sir Francis Galton when he discussed mental imagery and innate intelligence. Since then, many researchers started to define spatial ability in several ways (Mohler, 2009). The following are just a few of the different ways to describe spatial ability. French (1951) described spatial ability as the ability to manipulate objects that are in a three-dimensional space, and to imagine those objects in their mind (as cited in McGee, 1979). Lord (1985) explains spatial ability as a need of changing and using images that are created in the mind. Another definition is by Linn and Petersen (1985) who present spatial ability as presenting, creating, rotating, and renaming symbolic nonverbal information. Also, Clements and Battista (1992) define spatial thinking ability as imagining and understanding the movements of objects in two- and three-dimensional space. Lohman (1993) expresses the spatial skill as the ability to visualize, reorganize and transform a form into another form.
The spatial ability is defined as the relationship between a person and his
environment or between objects outside of him by Stockdale and Possin (1998). Olkun (2003) describes spatial ability as a visualization, rotation, and interpretation of two-dimensional and three-dimensional parts of objects in one’s mind. The other definition that using for spatial ability is visually manipulating, rearranging or
5
explaining the expression of relations of objects (Kayhan, 2005). Turgut (2007) expressed it as the ability of movement or interpretation of the objects and their components in three-dimensional space in the mind. According to Yıldız (2009), it is a set of the abilities to be visualized in the mind, to be recognized from different angles, or to move as a whole or to move objects parts separately in space. Spatial ability is also explained as to estimate the appearance of the object from different angles when it is rotated and to construct the open or closed form of an 3D object in the mind by Kösa (2011).
Since there are differences in the definition of spatial ability, there are also
differences in explaining the components of the spatial ability. Different researchers have stated spatial ability as comprising two components, the others have stated as comprising three components. For example, McGee (1979), Clements (1998) and Kayhan (2005) define spatial ability as two different components: spatial
visualization and spatial orientation. Turgut (2007) also classified spatial ability into two components: spatial visualization and spatial relations. However, Linn and Petersen (1985) and Kösa (2011) categorize spatial ability in three components: spatial perception, mental rotation, and spatial visualization. Since the component of the test used in the present study was a spatial visualization ability, the focus will be on spatial visualization. In this sense, McGee (1979) defines spatial visualization as the ability to visualize the state of the object after the movement of the parts, folding and unfolding a 3D object, reshaping objects in different ways in space, and image manipulation of an object in mind. In this study, the researcher focused on spatial visualization ability as a component of spatial ability.
6
Considering that the definitions of these researchers basically share a similar meaning, for the current study the spatial ability is defined as the ability to create visuals in the mind and being able to manipulate these visuals. Generally, spatial ability relates to the mind functions that involve rotation of objects, estimation of views from different angles, imagination of the object according to the location of the individual and studying patterns of 3D objects.
All of these aspects of spatial ability have an important place in the mathematical thinking process. The effect of spatial ability on mathematics, geometry and physics course achievement, and mathematical problem-solving performance have been generally investigated. In the literature, there has been a variety of studies examining the relationship between spatial ability and academic achievement. Since spatial ability have been considered to be a critical factor in mathematical learning, many studies have been conducted to investigate the relationship between spatial ability, mathematics achievement and mathematical problem-solving skills (Clements, 1998; Kayhan, 2005; Lord & Rupert, 1995; Tartre, 1990; Yurt & Sünbül, 2012). For
instance, Yenilmez and Kakmacı (2015) found 6th-grade students with higher cumulative mathematics grades performed better in the spatial visualization test than those with lower grades. Kayhan (2005) in her study in which she investigated the spatial ability of high school students revealed a positive and significant correlation between mathematical achievements. Clements (1998) examined the knowledge of young children about geometry and space and their ideas about certain concepts in this field. For the development of students’ ideas about geometry and space, he made activities that enable children to discover shapes like square, triangle, circle, and so on by touching them, drawing shapes and viewing from different perspectives. Later,
7
he stated that geometry and space perception should take a larger place in the education field and research. The following paragraphs go further to explain how these skills are important to be in mathematics education.
The National Council of Teachers of Mathematics (NCTM, 2000), in the USA, emphasizes the importance of having one-, two-, and three- dimensions study in geometry in different settings in order to help students to develop spatial ability thinking processes. This provides learners with the knowledge to manipulate geometric objects that are studied in the mathematics curriculum. Likewise, NCTM (2000) reports that the high school curricula should include mathematical problems on three-dimensional objects and their relationship with the spatial ability that is integrated into the lesson. Since spatial thinking ability requires the movement of 2D and 3D objects as it is an important part of geometric thinking, it needs to be
considered in more detail. Also, including the construction of these objects in the mind and the ability to imagine these objects from different angles are the expected outcomes for geometry classes. In this respect, spatial thinking, especially
visualization, is vital for geometry; this ability is a building block for comprehending abstract geometric concepts.
Problem
Spatial ability is important; it is particularly valuable for mathematics (e.g. geometry) because learners need to visualize the abstract objects in their mind. The spatial visualization of objects is a challenging skill for many students. Not only do students struggle manipulating objects in the mind, they rarely think about relating their manipulation of two- and three-dimensional objects to the real world. One of the
8
reasons why students have difficulties in spatial visualization is that their spatial thinking ability is not well developed; they lack the ability to construct concrete meanings of spatial operations in their mind. In other words, they are challenged to manipulate abstract and concrete objects and observe their features “in space” mentally.
There has been a variety of studies that have attempted to unveil spatial visualization and its relationship with mathematics achievement, gender, age, school type and socioeconomic status. In PISA (Programme for International Student Assessment) and TIMSS (Trends in International Mathematics and Science Study) reports, it is observed that the desired success in terms of geometric problem solving and spatial ability skills cannot be achieved (OECD, 2016). The findings of these investigations have helped somewhat educators to understand the complex phenomenon of spatial ability. Unfortunately, there have been limited studies in Turkey that have tried to understand the meaning of spatial ability, and how it relates to some other variables such as mathematics course grades, gender age, school type and socioeconomic status. Therefore, there is a need for more research that measures and examines Turkish students’ spatial visualization ability levels.
Purpose
The purpose of this study was to investigate Turkish high school students’ spatial visualization ability level. As the secondary purpose, students’ gender, grade and school type were used as independent variables to describe spatial visualization ability level. Also, this study aimed to look for a relation between students’ spatial
9
visualization scores both for students’ mathematics course scores and socioeconomic status.
Research questions The main research questions of this study were as follows:
1. What are the students’ spatial visualization ability levels as measured by Purdue Spatial Visualization test?
2. Do male and female high school students have significantly different levels of spatial visualization ability and its constructs?
3. Do the students’ spatial visualization ability levels and the constructs of the test vary with respect to school type?
4. Do the students’ spatial visualization ability levels and the constructs of the test change with respect to grade?
5. Do the students’ spatial visualization ability levels and the constructs of the test relate to their mathematics course grades?
6. Do the students’ spatial visualization ability levels and the constructs of the test relate to their socioeconomic status?
Significance
This study is a combination of some factors such as gender, age, socioeconomic factor and school types that influence the development of spatial visualization ability. The identification of the ability level in the high school may help to improve
students’ spatial ability further. Likewise, if the students’ ability is determined earlier it may be useful for their future life in terms of their profession.
10
It is thought that identification of the factors related to spatial visualization ability can be useful in terms of organizing and planning of the teaching and learning environments in order to address the development of spatial abilities of
academicians, educators and practitioners working in this field. It is important for students and teachers to know that spatial visualization ability as a component of spatial ability can be developed. The study may provide resources to the curriculum, curriculum developers and teachers. In this sense, when it comes to spatial ability, we can take a step closer to determining the effectiveness of the mathematics education system.
Definition of key terms
Gender: Refers to the gender of students either male or female.
Purdue Spatial Visualization Test: This instrument was devised to measure students 'spatial visualization skills. PSVT was developed by Roland Guay in 1976. The test was adapted to Turkish by Sevimli (2009) using the original English version.
Spatial ability: The ability to create images in the mind of the individual and to manipulate these images in his mind. In general, spatial ability needs to involve the rotation of an object, estimation of views from different angles, different image of the object according to the location of the individual, visualization of the extended form of an object, or formation of the extended form of an object in the open form can be created in the mind (McGee, 1979).
Spatial visualization ability: Spatial visualization is the ability to visualize the state of the object after the movement of the parts, net of the 3D object, reshaping the objects in different ways in space, and imagine manipulation of an object in mind.
11
Mathematics achievement: Refers to the mathematics Grade Point Average (GPA) scores of the students at the end of the first term of 9th, 10th,11th and 12th grade and the
scores are given on the scale of hundred.
School types: Refers to the two different types of high schools: Private school and state school.
Socioeconomic status (SES): Refers to the gathered information by asking questions about students’ parents’ educational background, second language, monthly income; students’ own study room, number of siblings.
12
CHAPTER 2: REVIEW OF RELATED LITERATURE Introduction
The background and the problem of this study presented briefly in the first chapter. The purpose of this study was to investigate Turkish high school students’ level of spatial visualization ability. The study used gender, grade and school types as
independent variables and described how spatial visualization relates to mathematics course grades and socioeconomic status of the students. This second chapter consists of the literature review to explore the theoretical framework that was used to answer the research questions for the study. This chapter aimed to investigate the main concepts and frameworks of this research which were:
The studies conducted with Purdue Spatial Visualization Test (PSVT) Studies investigating possible relations of spatial ability to
gender-differences
Spatial ability as it relates to grade level and/or age Spatial ability as it relates to mathematics achievement Spatial ability as it relates to socioeconomic status
One important concept related to the learning and teaching of mathematics is the concept of spatial ability. Moreover, according to the NCTM spatial ability is a basic skill for students to be learned. No surprise then, that research in this area dates back and is still lively. Spatial ability studies have been a study field that has been
13
imagery and innate intelligence (Mohler, 2009). Since then, different efforts have been made on what skills spatial ability consists of and what specific skills are expected to be displayed in these areas.
Spatial ability appears in the literature with numerous names and definitions.
Considering the definitions of many researchers described in the first chapter, around the same axis, spatial ability can be defined as the ability of the individual to create images in her/his mind and to manipulate these images in the mind. However, in general, spatial skills, rotating an object, estimating their appearance from different angles, changing the image of the object according to the position, being able to visualize the nets of an object or vice versa. It can be said that it includes the ability to organize. It is clear that these skills, regardless of their definition or content, have an important place in human thought and learning (Höffler, 2010).
Many researchers have studied this ability with the combination of external sub-components thought to be a possible factor. What follows is an exploration of these studies.
The studies conducted with Purdue Spatial Visualization Test (PSVT) PSVT is an international psychometric test used in the literature to determine spatial ability. This section explored some of the studies that were conducted with PSVT. Baki, Kosa, and Guven (2011) conducted an experimental study with pre-service first-year mathematics teachers. For the pre-test and post-test, the PSVT was used as an instrument. They, however, found no statistically significant differences between students’ spatial visualization abilities in the experimental and control groups before
14
training. Students’ PSVT total mean scores were found to be nearly 18 (SD = 5.43) before treatment. And, developments, rotations, and views mean scores were found to be 7 (SD = 2.16), 6.5 (SD = 2.09), 4.5 (SD = 2.59) respectively. In other words, subjects of the studies performed better in development constructs than the other constructs. These results were valid after the treatment for all constructs. So, the subjects of their studies showed better performance in the development construct than the other two constructs.
Turgut, Yenilmez, and Balbağ (2017) looked for possible effects of gender and academic performance on the spatial thinking abilities of mathematics and science prospective teachers. As an instrument, the researcher used PSVT. For PSVT, the number of correctly marked questions was calculated in each section, and scores were collected from the developments and rotations construct counted for spatial visualization ability, and the score obtained from the views construct was directly included in the analysis as a measurement of spatial orientation level. In addition, by calculating the total score of PSVT; the PSVT scores of the students were taken as dependent variables and analysed by gender, department and academic performance a three-way between-subjects analysis of variance. General results showed that prospective teachers had low-level of spatial visualization ability. Also, gender and academic performance had significant effects on spatial visualization ability.
Yazıcı (2014) conducted a study on 447 preservice teachers from different teaching programs in order to determine their spatial visualization ability level through the PSVT. The test is variable and reliable itself, also in his study, the alpha reliability coefficient was calculated to be 0.79. The dependent variables of his study were
15
teachers’ total scores of developments, rotations, and views and one of the independent variables was teachers’ gender. He reached that spatial visualization scores differ between males and females. Male students outperformed female students for each construct (developments, rotations, and views).
Dündar (2014) conducted his correlational study with 96 prospective right-handed Primary Mathematics Education Department students. He categorized the sample based on gender (54 female and 42 male). He investigated if there were any statistical differences on each construct; developments, rotations, and views. The Purdue Spatial Visualization Ability Test was used to examine the spatial ability of prospective teachers. In general, students’ maximum score was at 10 and 18 based on two different groups (field dependent and field independent) of his study. Besides, students performed better in development construct than the rotations and views construct. In his study, he also found that male teachers outperformed female ones in the spatial visualization ability test.
Studies investigating possible relations of spatial ability to gender-differences Gender as a factor has been a major concern in studies related to spatial ability. The existence of possible gender differences in cognitive skills regarding spatial ability is a controversial topic. Some of the studies widely acknowledge that there is a gender-related difference, some other studies acknowledge that there are no or very small gender-related differences. For example, Reilly, Neumann, and Andrews (2017) reported that even though males perform better than females in tests that measure visual-spatial ability on average there is more variability within males and females. (p. 528). Based on his research Feingold (1988) suggested that the gender differences
16
in visual-spatial ability is gradually decreasing. Researchers differ in their
perspectives on the origins of gender differences including the relative factors such as, maturation rate, culture, and birth order (Fairweather, 1976). Therefore, research on this issue has switched its focus on addressing the gender difference in terms of magnitude, and the other factors that affect gender differences such as
environmental, age factors, school types, instructions different types of spatial ability, etc.
Yang and Chen (2010) hypothesized that digital games help to improve students’ spatial skills equally for both genders. They also indicated that spatial skill is a crucial skill in geometry learning. Hence, this study addressed how students’ performances were affected by factors such as gender difference and spatial skills through the development of a digital pentominoes game. The empirical study was conducted quantitatively, and 34 fifth-grade students were selected as participants. The statistical results indicated that students’ spatial abilities were significantly improved after they took the digital pentominoes game. Moreover, it was also demonstrated that digital games can sensibly decrease the spatial ability level differences between boys and girls. Furthermore, the greatest mean differences between gender were found within mental rotation among the other three types of spatial ability. Lastly, Yang and Chen (2010) used the findings of the study to develop a framework that might be employed to help the understanding of gender differences and spatial skills in digital games.
17
Studies in favour of males
Research on gender differences in spatial ability affected by environmental factors dates back to the 1970s. Fennema (1974) stated when a significant difference in performance spatial ability tasks are found, they usually indicate males’ superiority. However, he also noted that such differences were often fairly small in magnitude.
The reason behind obtaining controversial results in terms of gender differences and spatial ability skills lies in the very nature of the studies conducted on this issue. Studies were conducted at different age levels and most of them with different visualizing probing instruments. For example, a meta-analysis of Linn and Petersen (1985) aimed to determine the extent of gender differences in spatial ability, which aspects of spatial ability exist, and the age at which gender differences in spatial ability first appeared. Students had different results according to the components of spatial abilities. They stated that gender differences occur “large only for mental rotation, medium for spatial perception and small for spatial visualization” (p.1491). Also, the effect of gender on spatial ability emerged at the age of 8 years and that male students performed better in the mental rotation than female students.
Some researchers have focused on gender difference issues in terms of age while some of them have changed their focus to instructional and environmental factors. For example, there are gender differences that are not biologically based but are influenced by experience and environment where boys are more exposed to the physical environment than girls (Ferguson, Ball, McDaniel, & Anderson, 2008).
18
Gold et al. (2018) in their studies with undergraduate students, found significant differences in spatial skills that are, male students, did better than female students particularly in the area where mental rotation was required. However, the existence of gender differences was determined after examining various academic factors and their interaction with constructive-based toys, video games or playing sports. In their studies, this indicated existing gender differences were not biological, it developed spatial skills, where differences depended on educational opportunities and students’ interaction with toys affecting spatial ability development. With these results, it was concluded both formal academic education and extracurricular activities enable students to develop spatial abilities throughout their lives.
A meta-analysis study by Maeda and Yoon (2013) was carried out to predict the magnitude of gender differences in three-dimensional rotation ability. The study found out gender differences influenced by test administration conditions. However, the effect occurred because of test conditions such as length of the test, time
limitation, administration mode, biological, experimental and so on. Thus, the results revealed that males outperform females only when time-limit was introduced.
Ben-Chaim, Lappan and Houang (1985) examined the spatial visualization ability of fifth to eighth-grade students. It was argued that spatial visualization was a well-documented feature of gender-related differences in favour of the male. However, after certain instruction, male and female students achieved equal benefits that reduced gender differences on spatial ability as a result of instruction. However, in another study, Smith and Litman (1979) investigated gender-related differences in spatial visualization ability. They focused on the girls and boys from sixth and
19
seventh grades in early adolescence. Even though girls and boys were differentially affected by instruction, the boys showed improvement in this ability as a result of instruction. Scientific studies on gender differences have been stated that generally, males are more successful than females in terms of the stated variables. However, this difference has diminished as females have started to take advantage of
educational opportunities more equally with males. Therefore, studies are finding that there is no longer any significant difference in terms of gender. Similarly, there are studies showing that there is no difference between males and females in terms of spatial abilities (Alias, Black,& Gray, 2002).
Studies that showed no difference
According to Monahan, Harke and Shelley (2008), in contrast to spatial perception and mental rotation, spatial visualization ability is the component with the small effect size and statistically non-significant results in gender differences. While Fennema (1975) specified that “on tasks measuring one kind of spatial ability, i.e., spatial visualization, data from a variety of sources indicate that males perform at a higher level than females starting about adolescence and continuing through high school and adulthood” (p. 34).
In their broad literature review, Maccoby and Jacklin (1974), stated that there were a “well-established” gender-related differences in spatial abilities in favour of males. Also, this difference was emerging in adolescence and continuing into adulthood. Whereas, Voyer (1996) explained that only considering spatial ability studies the magnitude of gender differences differs depending on the task and measurement utilized. A meta-analysis by Hyde (1981) investigated the magnitude of gender
20
differences in the performances of female and male students in spatial ability reported by Maccoby and Jacklin (1974). He found the magnitude of gender differences was very small. He, thus, argued that gender had only a minimal effect on explaining students’ spatial test scores.
Seng and Chan (2000), conducted a study with 127 elementary school students as participants. They aimed to find how gender influenced spatial ability, thus the participants consisted of 72 boys and 55 girls. Their study also investigated spatial ability, spatial orientation, spatial visualization and its relationship to mathematical achievement. Participants’ spatial ability was measured by Spatial
Relations-Orientation Test and the Spatial Visualization Test Results of the study demonstrated despite small gender difference in spatial ability between boys and girls, the boys were not found to be significantly better than the girls in the spatial tasks. Moreover, Seng and Chan (2000) highlighted that cultural factors, training sessions may have influenced spatial ability based on gender in the last ten years. Further results
indicated that there was a significant positive relationship between spatial ability and mathematical performance.
Spatial abilities mature in the ages between 11 and 15 so that it is expected to not show any gender-differences or age-differences after age 15 (Fennema & Leder 1990). On the other hand, Johnson and Meade (1987) found that gender differences occurred from the age ten and the magnitude of advantage remains constant from 18 years on after they applied spatial ability tests at different cognitive development levels of children from ages 6 to 18. Oppositely, A meta-analysis of the three-component of spatial abilities dealt by Voyer, Voyer, and Bryden (1995), which
21
obtained no significant gender differences for the participants younger than 18. Whereas, they found out significant gender differences for participants who were over 18 years old.
This section provided an overview of controversial issue of gender differences in spatial ability, as well as the different results of the research-related areas.
Spatial ability as it relates to grade level and/or age
Many researchers have suggested that as the grade level increases student’s spatial ability performance also increases. Ben-Chaim et al. (1985) measured the spatial visualization abilities of students by making them counting cubes. To give an
example, one of the items was “How many cubes are needed to build this rectangular solid?” by presenting the picture with a rectangle. The researcher’s strategies were that students who missed the items were using the incorrect counting strategies. Some of the students completed two-dimensions rather than three, while others left the hidden part of the figure incomplete. As a result, the performances of the fifth, sixth, seventh and eighth grades were directly proportional to their level. Students' performances increased as the grade level increased.
To give an example for study on grade, the following study tested 107 fifth to eighth graders on spatial rotation multiple-choice items. The purpose was to check the relationship between age and gender in spatial ability. Michaelides (2002) conducted the study, firstly interviewing some of the students. They were required to describe their way of solving four of the items and problem-solving tasks. He identified visual and non-visual strategies that students utilized but noticed that students did not use
22
the strategies consistently. He later added that older students performed better in three-dimensional manipulation. However, there were no any other age and gender differences in the use of strategy in spatial ability.
To give another example, Ben-Chaim, Lappan, and Houang (1988) investigated the effects of grade, gender and region variables on spatial visualization abilities and differences between 5th to 8th-grade students’ spatial visualization abilities. Middle Grades Mathematics Project Spatial Visualization Test was applied as a pre-test and post-test to approximately 1000 students representing different socio-economic levels. For 3 weeks, students were engaged in concrete material activities such as the drawing and construction of cubes. At the end of the research, it was seen that spatial visualization scores of 5th, 6th, 7th, and 8th-grade students increased statistically, and the gains were close to each other after instruction for both male and female students.
Spatial ability as it relates to mathematics achievement
As mathematical concepts were introduced visually and geometrically, e.g. number lines and graphs, success in geometry may bring success in mathematics regarding the spatial ability.
Many scientists, including Voyer and Sullivan (2003), highlighted that spatial ability tests carried out with hands on activities such as drawing of tilted containers,
revealed the males performed better; however, mathematics course grades showed the opposite. The researchers believed that this contradiction occurs for two reasons. The first reason was that the grades were measured in the classroom conditions,
23
where many components of mathematical skills are measured frequently. The second reason was that the hands-on tasks used only a specific measurement that
demonstrated a limited number of mathematical concepts such as three-dimensional, space, spatial concepts than concepts in mathematics objectives. Therefore, it would be better to investigate the final grade in a mathematics course which may reflect more accurate estimation of the relevant skills. In other words, rather than laboratory testing, high school grades in mathematics need to be considered. That is to say, Voyer and Sullivan (2003) investigated the analysis of mathematics course grades as an indicator of the relationship between mathematical performance, spatial skills and gender. In this research participants were equally divided by genders, 144
introductory psychology students. Also, their mean age was 18.6 years with a range from 17 to 28 years.
Research on mathematical achievement regarding spatial ability dates back 1970’s. Fennema (1974) claimed that the relationship between mathematics and spatial ability is a “logically evident” (p.34). Regarding spatial representations used in mathematics, he explained that "not only are spatial visualization components an integral part of the structure of mathematics, spatial representations are being increasingly included in the teaching of mathematics most concrete and pictorial representations of arithmetical, geometrical and algebraic ideas appear to be heavily reliant on spatial attributes" (p. 36).
Weckbacher and Okamoto (2014) examined 113 high school students to analyze the relations between one of the spatial ability components and mathematics
24
mentally rotating blocks. Significant relations emerged between spatial ability and both geometry grades and the standardized geometry measure. However, no
significant relation emerged between spatial ability components and algebra grades. Also, Weckbacher and Okamoto (2014) emphasized how to improve spatial thinking by encouraging students' interests in mathematical and scientific careers were
addressed. Their effort would modify educational curricula for spatially talented students who may help meet the growing demand of several fields such as science, technology, education and mathematics.
Turğut and Yılmaz (2012) investigated the relationship between 674 seventh and eighth grade Turkish students' spatial ability, gender, mathematics achievement and pre-school education in their descriptive studies. A spatial ability test and personal information form were used in their research. Frequency, mean, t-test and correlation analysis were used to interpret the data obtained for the level of spatial abilities of 7th and 8th grade students. The result showed that the spatial abilities of the students were quite low. According to descriptive statistical results of the study, seventh grade students’ mean score of the test was found to be 12.39 (SD=4.49) and eight grade students’ mean score was found to be 11.81 (SD=4.45) out of 23. While there were no significant relationships between spatial ability and gender, a moderate positive and significant relationship was found between spatial ability and mathematics achievement. Moreover, those who received pre-school education were more successful than those who did not. This finding might be another indication to the environmental factor described in the section studies investigating possible relations of spatial ability to gender-differences.
25
In their correlational study, Yenilmez and Kakmaci (2015) examined a possible relationship between sixth grade students’ spatial visualization ability level regarding gender and mathematics achievement. They conducted a study with spatial abilities tests to investigate students’ spatial visualization level and they had students’ latest mathematics grades. T-test analysis revealed a significant difference in spatial visualization achievements in favour of male. From a variance analysis for spatial visualization achievements between mathematical achievement groups it was found that there were significant differences. Correspondingly, students with higher math grades have more success in the spatial visualization test than others.
Battista (1990) examined the relationship between spatial visualization, logical reasoning, geometrical problem-solving strategies, and gender in a study conducted with 75 male and 53 female high school students. An adapted version of the Purdue Spatial Visualization Test: Rotations was selected to measure students' ability for mental rotations of objects in space. As hypothesized by Battista (1990), spatial visualization and the discrepancy between spatial visualization and logical reasoning were attained to be related use of problem-solving strategies. Furthermore, the results revealed spatial visualization ability and logical reasoning were positively related in geometry achievement. Besides, the spatial visualization performance of male students was higher than female students.
Another study conducted by Battista, Wheatley and Talsma (1982) investigated the effect of spatial ability and cognitive development on the learning of geometry and the effect of geometry teaching on the development of spatial ability. The researchers conducted the study with 82 pre-primary teachers. He stated that in order to realize
26
the thinking of individuals in concrete processes, pictorial representation is required, and therefore spatial visualization may be important for these individuals to learn mathematics. As a result of the study, it was concluded that geometry lessons improved spatial ability and spatial visualization and cognitive development.
Karaman and Toğrol (2009) investigated the understanding of plane geometry with the factors gender, spatial visualization, spatial orientation of 120 sixth grade
students in a private school. Correlation analyses were applied for the variables. As a result of these analyses, a significant correlation among each factor except for gender was found. Also, multiple regression analyses were used for more clarification of the relationships among factors. As a result, there was a significant relationship between spatial visualization ability and the performances on plane geometry topics. Karaman and Toğrol concluded that the spatial abilities are the significant factor of the
development of the concept of space.
Another study was conducted by Cheng and Mix (2014) to investigate the relationship between spatial ability and mathematics achievement. Studies were encouraging this relationship as they claimed that math learning is directly related to spatial development. For the study of Cheng and Mix, 58 children mostly from the middle class were selected as participants. Their age ranged from six to eight because these children are still in the period of developing fundamental arithmetic skills. Participants were divided into two groups. There were 17 boys in the spatial experimental group and 17 boys in the control group. The pre-test was applied first to all children. After there were 40 minutes training sessions followed by three post-tests which were called mental rotation test, spatial relations subtest (test of primary
27
mental abilities), and Math test. The analysis indicated a significant difference favouring the spatial training group. However, there was no significant group difference in the Spatial Relations subtest, yet, indicating that our mental rotation training did not lead to a general improvement in spatial ability. On the other hand, even a single session of spatial training led to significant improvement on specific problems. That is to say, spatial cognition and mathematical reasoning are connected, there still need more studies to prove a more concrete link though.
Remarkably, many studies highlight the importance of spatial ability for
mathematics, some studies have found a statistically significant positive relationship between spatial ability and mathematics achievement. Spatial ability is important ability because learners need to visualize the abstract objects in their mind.
Spatial ability as it relates to socioeconomic status
Aydin and Ubuz (2014), in their studies, use parents’ educational attainment as the measure of SES. In the theoretical frameworks of their studies, they emphasized that parents’ educational background, in general, affects the individual development of the students. Some characteristics specific to mothers and fathers can serve to
construct the way their children think differently, and in turn, can develop or weaken different mathematical thinking aspects of children.
Levine, Vasilyeva, Lourenco, Newcombe and Huttenlocher (2005) inquired to find relationship between boys’ spatial ability from diverse socioeconomic status. 547 students (271 girls, 276 boys) were the participants of this study. Boys and girls were roughly equally divided in each of the SES groups, but more participants represented
28
in the middle level SES than other levels. The number of participants at each time changed because the children were often absent from school and because one low level SES school dropped out of the study after the first year. Also, based on parents’ education level, the families’ socioeconomic levels differed as middle to upper-middle class. This longitudinal study was conducted with the children who were asked to do two spatial tasks requiring mental transformations. The results revealed that the boys from middle and high-SES backgrounds outperformed the girls. On the other hand, the participants from a low-SES did not reveal any differences between these two genders.
Verdine, Irwin, Golinkoff and Hirsh-Pasek (2014), in their study of 22 boys and 22 girls with different socioeconomic status, aimed to investigate the effect of spatial ability on pre-school students’ mathematics performances. The relationship between mathematics and pre-school students was evaluated within the framework of a spatial ability measurement, which included the ability to copy 2D and 3D structures.
According to the findings, spatial abilities were found to be an important determinant of general mathematics performance. Also, it was stated that children with low socioeconomic status have low spatial abilities.
In summary, researchers and educators have been aware of the importance of spatial ability for years and have been progressing with spatial ability studies. As the literature review revealed that, research has yet to come to a common understanding of what exactly spatial ability entities since there has been no common definition of spatial ability. In addition, it has been seen that concepts such as spatial ability, spatial skill, spatial visualization, and spatial relationships have been used
29
interchangeably. Whether this phenomenon is a non-gender biased rudimentary skill or an ability has been still discussed by psychologists and mathematics educators alike (Turgut, 2007).
Furthermore, this chapter examined studies on spatial ability and studies
investigating possible relations of spatial ability to external factors. Research has shown a positive relationship between students' mathematics achievement and spatial abilities. It was also concluded that spatial ability was important not only in
mathematics achievement but also in many business areas and even higher thinking skills. The results of the studies insisted that there was a strong relationship between students' spatial abilities and their logical thinking abilities. The following chapter will introduce the methodology conducted in this research.
30
CHAPTER 3: METHOD Introduction
The main purpose of this study was to investigate Turkish high school students’ spatial visualization ability level. As the secondary purpose, students’ gender, grade and school type were used as independent variables to describe spatial visualization ability. This study aimed to look for a possible relation between students’ spatial visualization scores and both for students’ mathematics course scores and socioeconomic status (SES). In this chapter, the researcher explained the
methodology used to conduct this study in general. Particularly, it consisted of an explanation of the research design, context, population and sample, the
instrumentation, data collection procedures, and data analysis procedures. Table 1 presented the timetable that shows the summary of dates and the major steps of the research. Table 1 Timetable of thesis Steps Year 2017-2018 2018-2019 2019-2020 Semester F all S pr ing S umm er F all S pr ing S umm er F all S pr ing Literature Review x x x x x x Meetings with Supervisor x x x x x x x
Permission for the test x
Permission from MoNE x
Collecting data from schools x
Analysis of the data x x
Interpreting the results x
Organizing the thesis x x x
31
Research design
A quantitative research methodology was employed in order to conduct this research. Among the four possible quantitative research designs (i.e. experimental, quasi-experimental, correlational and descriptive), the descriptive research design was the appropriate structure that provided a sound fundamental blueprint in order to reach scientifically valid answers for the research questions. Descriptive research was used because the main purpose was to describe the characteristics of the population or phenomenon being researched. This particular research design did not describe what the direct causes were regarding the phenomenon studied. Two forms exist in
descriptive research design; these are observational and survey type. Survey research is when you systematically gather information from respondents to try to understand and predict some behavioural aspects of the general population that you are
interested in. Simply, it implies the information that has been gathered by type of a questionnaire. The researcher must be concerned with aspects such as sampling, questionnaire design, questionnaire administration, and finally data analysis (Jackson, 2015).
Also, Fox and Bayat (2008) stated descriptive research as “aimed at casting light on current issues or problems through a process of data collection that enables them to describe the situation more completely than was possible without employing this method” (p. 8). Since the purpose of the study was to investigate Turkish high school students’ spatial visualization ability level, in other words, it was aimed to describe the characteristics of the population through the use of Purdue Spatial Visualization Test (PSVT), the descriptive design was deemed to be appropriate. This descriptive study answered the following research questions:
32
1. What are the students’ spatial visualization ability levels and its constructs as measured by Purdue Spatial Visualization test?
2. Do male and female high school students have significantly different levels of spatial visualization ability and its constructs?
3. Do the students’ spatial visualization ability levels and the constructs of the test vary with respect to school type?
4. Do the students’ spatial visualization ability levels and the constructs of the test change with respect to grade?
5. Do the students’ spatial visualization ability levels and the constructs of the test relate to their mathematics course grades?
6. Do the students’ spatial visualization ability levels and the constructs of the test relate to their socioeconomic status?
In the following sections, context, sample, instrumentation, data collection, and the data analysis were explained. The context section provided information about where the study was conducted and included a description of the participant schools and students. In the sample section, the population definition, and the sampling strategy was explained with appropriate justification. The instrument that addressed the research questions, explanation of the instrument and reliability and validity of the instrument were stated in the instrumentation section. Data collection section provides an explanation on data collection and gives information regarding the procedures for ethical allowance. Data analysis was the last section, and it provided information regarding how data were analysed and reported in chapter four.
33
Context
The present study was carried out in Çankaya, a large and diverse district of Ankara. Ankara is the capital city located in the central Anatolia region of Turkey. The study took place during the fall semester of the 2018-2019 academic year. Students from both private and state schools took part in the study. A total of 555 high school students who were enrolled in mathematics courses took part in the study.
Information about the schools and number of students from each school were given in Table 2 below. A detailed explanation follows regarding the sampling for this study. There were three schools and two of them were state and the other one was a private school.
Table 2
Schools and number of the participant students
Schools School type Number of students
School 1 State 129
School 2 State 215
School 3 Private 211
Sample
The population is defined as the whole set of individuals or values that the researcher is interested in. The sample can be defined as the set of individuals or values that were selected from the population. The sample is hypothesized as to represent the population (Dawson & Trapp, 2001). When proper probability sampling processes are employed, then the researcher has the opportunity to validly generalize the conclusion of the research outcome to the population.
Identifying the sample size is categorized as probability and non-probability
sampling methodologies. Essentially, probability sampling allows every individual to set an equal chance of being selected. Systematic sampling, random sampling, and