APPLICATION OF CONJUGATED
CUCURBIT[8]URIL PORPHYRIN
SUPRAMOLECULAR ASSEMBLY IN
ELECTROCHEMICAL HYDROGEN
GENERATION
a thesis submitted to
the graduate school of engineering and science
of bilkent university
in partial fulfillment of the requirements for
the degree of
master of science
in
materials science and nanotechnology
By
Bouthaina Aoudi
August 2020
Application of Conjugated Cucurbit[8]uril – Porphyrin supramolecular assembly in Electrochemical Hydrogen Generation
By Bouthaina Aoudi August 2020
We certify that we have read this thesis and that in our opinion it is fully adequate, in scope and in quality, as a thesis for the degree of Master of Science.
D¨on¨u¸s Tuncel(Advisor)
˙Irem Erel G¨oktepe
Ferdi Karada¸s
Approved for the Graduate School of Engineering and Science:
ABSTRACT
APPLICATION OF CONJUGATED CUCURBIT[8]URIL
PORPHYRIN SUPRAMOLECULAR ASSEMBLY IN
ELECTROCHEMICAL HYDROGEN GENERATION
Bouthaina Aoudi
M.S. in Materials science and nanotechnology Advisor: D¨on¨u¸s Tuncel
August 2020
The ever-increasing demands for energy have encouraged an enormous consump-tion of fossil fuels worldwide. This has presented major concerns due to their limited resources and serious environmental issues. Therefore, the search for an alternative clean energy fuel has been intensively under study. In the past decade, hydrogen has attracted great attention as a promising fuel for the future. Hydro-gen is an eco-friendly fuel that is readily abundant, highly efficient and clean since water is its only combustion product. Herein, this thesis highlights the synthesis and characterization of a novel supramolecular assembly based on cucurbit [8] uril -porphyrin functionalized on electrochemically reduced graphene oxide sheets for application in electrochemical hydrogen evolution. The study conveys optimiza-tion procedures for choosing the best catalytic system. Electrochemical analysis including potentiometry, cyclic voltammetry, chronoamperometry and electro-chemical impedance spectroscopy were used to evaluate activity and stability. Characterization techniques were also performed to analyze the morphology and chemical structures of composites. Electrochemical studies demonstrated that ERGO: Ni-P composite (which comprises of a layer of graphene oxide drop-casted on FTO followed by a layer of nickel CB[8]-porphyrin) can serve as an excellent electrocatalyst for hydrogen evolution in alkaline medium. The composite exhib-ited high activity (onset potentialv -20 mV, 56.9 mmol h−1g−1 hydrogen, faradaic efficiency of 93% ), remarkable rate of charge transfer (Rct v 210 Ω), large
elec-trochemical surface area (Cdl v1.67 mFcm−2) and significant stability without
requiring additional noble metals.
Keywords: supramolecular electrocatalyst, cucurbituril, water-splitting, electro-chemical hydrogen production, porphyrin, graphene oxide.
¨
OZET
ELEKTROKIMYASAL HIDROJEN ¨
URETIMINDE
KONJUGE K ¨
UK ¨
URBIT[8] ¨
URIL-PORFIRIN
SUPRAMOLEK ¨
ULER D ¨
UZENEGININ UYGULANMASI
Bouthaina Aoudi
Malzeme Bilimi ve Nanoteknoloji, Y¨uksek Lisans Tez Danı¸smanı: D¨on¨u¸s Tuncel
A˘gustos 2020
S¨urekli artan enerji talepleri, d¨unya ¸capında muazzam miktarda fosil yakıt t¨uketimine sebep oldu. Bu durum, sınırlı kaynaklar ve ciddi ¸cevre sorunları nedeniyle b¨uy¨uk endi¸seler ortaya ¸cıkarmı¸stır. Bu nedenle, alternatif temiz bir enerji yakıtı arayı¸sı yo˘gun bir ¸sekilde incelenmektedir. Son on yılda hidrojen, gelecek i¸cin umut vaat eden bir yakıt olarak b¨uy¨uk ilgi g¨orm¨u¸st¨ur. Hidro-jen kolayca bol miktarda bulunan, y¨uksek verimli ve tek yanma ¨ur¨un¨u su oldu˘gu i¸cin temiz, ¸cevre dostu bir yakıttır. Bu tezde elektrokimyasal hidro-jen evriminde uygulama i¸cin elektrokimyasal olarak indirgenmi¸s grafen ok-sit tabakaları ¨uzerinde i¸slevselle¸stirilmi¸s k¨uk¨urbit[8]¨uril-porfirine dayanan yeni bir supramolek¨uler d¨uzene˘gin sentezini ve karakterizasyonu vurgulanmaktadır. C¸ alı¸sma, en iyi katalitik sistemi se¸cmek i¸cin optimizasyon prosed¨urlerini ak-tarıyor. Aktiviteyi ve stabiliteyi de˘gerlendirmek i¸cin potansiyometri, d¨ong¨usel voltametri, kronoamperometri ve elektrokimyasal empedans spektroskopisini i¸ceren elektrokimyasal analizler kullanıldı. Kompozitlerin morfolojisini ve kimyasal yapılarını analiz etmek i¸cin karakterizasyon teknikleri de uygulandı. Elektrokimyasal ¸calı¸smalar, ERGO: Ni-P kompozitinin (FTO ¨uzerine damla d¨ok¨ulm¨u¸s bir grafen oksit tabakasından ve ardından bir nikel KB[8]-porfirin tabakasından olu¸san) alkali ortamda hidrojen olu¸sumu i¸cin m¨ukemmel bir elek-trokataliz¨or g¨orevi g¨orebilece˘gini g¨ostermi¸stir. Kompozit ek asal metaller gerek-tirmeden y¨uksek aktivite (ba¸slangı¸c potansiyeli v -20 mV, 56.9 mmol h−1g−1 hidrojen, % 93 faradaik verimlili˘gi), dikkat ¸cekici y¨uk aktarım oranı (Rct v 210
Ω), geni¸s elektrokimyasal y¨uzey alanı (Cdl v1.67 mFcm−2) ve ¨onemli stabilite
g¨ostermi¸stir.
v
Acknowledgement
First and Foremost, I would like to express my sincere gratitude to my supervisor Assoc.Prof.D¨on¨u¸s Tuncel for her exceptional guidance and immense knowledge that has greatly helped me fulfil my thesis studies. I would like to thank com-mittee members Assoc.Prof.˙Irem Erel G¨oktepe and Asst.Prof.Ferdi Karada¸s for their time and valuable efforts.
I want to extend my thanks to all faculty members and staff of UNAM and chemistry department for their tremendous help and contributions. I also thank Bilkent University, UNAM, and T ¨UB˙ITAK for their financial support through-out my master’s studies. I am thankful to all present and former members of Prof. Tuncel’s group, especially Melis ¨Ozkan, Yasaman Sheidaei and Aisan Kha-ligh for their valuable assistance and amazing energies. I am deeply grateful for Melis ¨Ozkan, H¨useyin Can C¸ ami¸ci, Do˘gu ¨Ozyi˘git, Merve ¨Ust¨un¸celik, Ilkay C¸ isil K¨oksaldı, G¨ok¸ce ¨Ozkul and Kerem Kurban for their precious friendship and trea-sured memories. I am very lucky I got to meet such wonderful people, thank you all for adding something special to my life.
My acknowledgement would be incomplete without thanking the biggest source of my strength, my family. I am forever indebted to my father Tarek Aoudi and mother Nazek Arabi, for their continuous and unparalleled love and support that shaped the person I am today. Not to mention, my success wouldn’t have been possible without the three backbones in my life, my brothers Imad, Abdelrahman and Hussain who always believed in me and encouraged me to pursue my dreams. Finally, my special thanks go to my best friend and my sister, Joudi Maskoun for her presence by my side in every step. This journey would not have been possible if it wasn’t for them, and I dedicate this milestone to them.
Contents
1 Introduction 1
1.1 Hydrogen as an alternative fuel . . . 1
1.1.1 Hydrogen production methods . . . 2
1.1.2 Applications of Hydrogen . . . 5
1.2 Electrochemical water splitting . . . 7
1.2.1 Thermodynamics . . . 7
1.2.2 Factors affecting efficiency of the electrochemical cell . . . 9
1.2.3 Electrocatalysts for HER . . . 10
1.3 Activity parameters for HER . . . 18
1.3.1 Overpotentials . . . 18
1.3.2 Tafel plots . . . 19
1.3.3 Turnover Frequency (TOF) . . . 22
CONTENTS viii
1.3.5 Electrochemical Active Surface area (ECSA) . . . 23
1.3.6 Electrochemical impedance spectroscopy (EIS) . . . 24
1.3.7 Amount of hydrogen produced . . . 25
1.4 Aim of study . . . 26
2 EXPERIMENTAL AND INSTRUMENTATION 27 2.1 Materials . . . 27
2.2 Synthesis . . . 28
2.2.1 Synthesis of CB8-porphyrin assembly . . . 28
2.2.2 Synthesis of graphene oxide . . . 30
2.3 Experimental . . . 30
2.3.1 Experimental setup . . . 30
2.3.2 Sample preparation for electrochemical analysis . . . 30
2.3.3 Electrochemical reduction of GO: Ni-P films . . . 31
2.4 Instrumentation . . . 31
2.4.1 Scanning Electron Microscope . . . 31
2.4.2 X-ray Photoelectron Spectroscopy . . . 32
2.4.3 X-ray Diffraction . . . 32
2.4.4 Infrared spectroscopy . . . 32
CONTENTS ix
2.4.6 Electrochemical characterization . . . 33
3 RESULTS AND DISCUSSION 34 3.1 Introduction . . . 34
3.2 Synthesis and characterization . . . 35
3.2.1 CB8-porphyrin frameworks . . . 35
3.2.2 Graphene oxide . . . 40
3.2.3 Electrochemically Reduced Graphene Oxide . . . 44
3.2.4 ERGO nickel CB[8]-porphyrin composites . . . 47
3.3 Electrochemical analysis . . . 52
3.3.1 Nickel CB[8]-porphyrin . . . 53
3.3.2 GO Nickel CB[8]-porphyrin . . . 56
3.3.3 ERGO Nickel CB[8]-porphyrin . . . 62
3.3.4 The optimum sample . . . 66
4 CONCLUSION 73
List of Figures
1.1 Structure of graphene oxide and the different methods to reduce it 12
1.2 Randell cell’s electrical circuits (left) and their equivalent Nyquist plots (right) with and without Warburg element . . . 25
3.1 SEM images of CB[8]-porphyrin assembly at different magnifica-tions using 15.0 kV beam energy . . . 39
3.2 High resolution XPS spectra of C 1s, O 1s and N 1s of CB[8]-porphyrin assembly . . . 39
3.3 Experimental procedure for the sythesis of graphene oxide . . . . 40
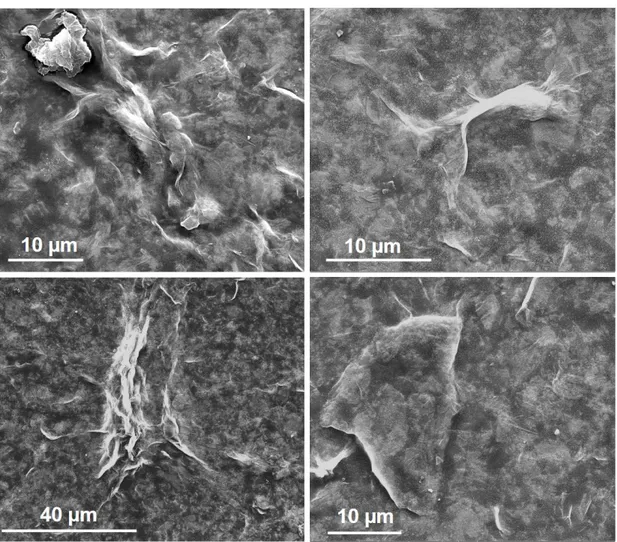
3.4 SEM images for GO-modified FTO at different magnifications . . 41
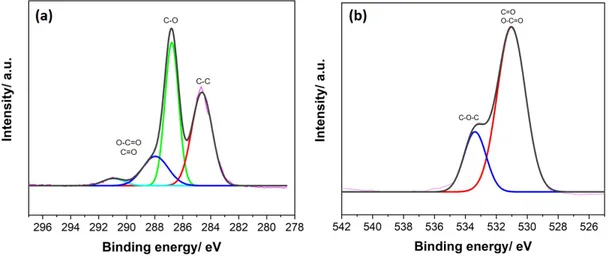
3.5 High resolution XPS spectra of (a) C 1s and (b) O 1s of GO . . . 42
3.6 (a)XRD patterns for graphite flakes and GO-modified FTO (b)XPS elemental survey (c) Raman spectra and (d) FT-IR mea-surements for GO-modified FTO . . . 43
3.7 SEM images for ERGO-modified FTO at different magnifications 44
LIST OF FIGURES xi
3.9 (a)XRD patterns for ERGO-modified FTO (b)XPS elemental sur-vey (c) Raman spectra and (d) FT-IR measurements for ERGO-modified FTO . . . 46
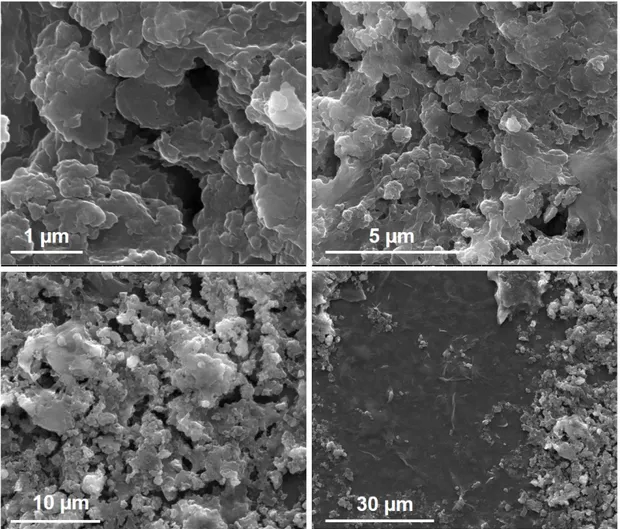
3.10 SEM images for ERGO:Ni-P-modified FTO at different magnifica-tions . . . 48
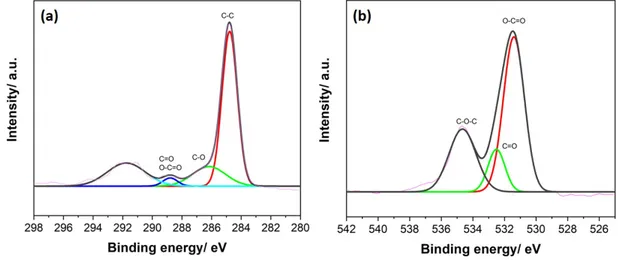
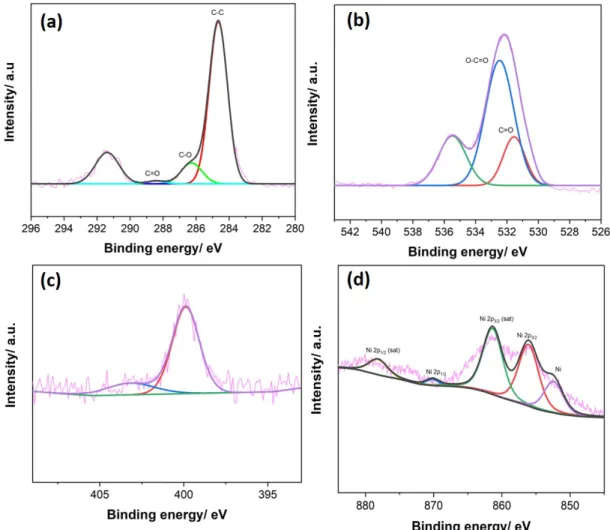
3.11 High resolution XPS spectra of the (a) C 1s and (b) O 1s (c) N1s and (d) Ni 2p of ERGO:Ni-P . . . 49
3.12 (a)XRD patterns for graphite flakes and ERGO:Ni-P-modified FTO (b)XPS elemental survey (c) Raman spectra and (d) FT-IR measurements for ERGO:Ni-P-modified FTO . . . 50
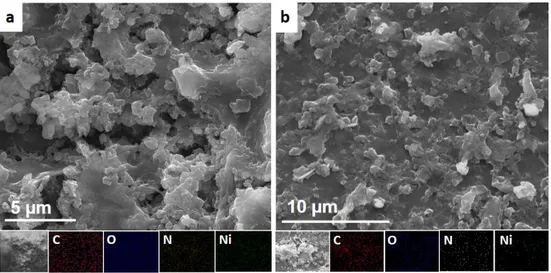
3.13 SEM images of ERGO: Ni-P (a) before and (b) after 3h CA ex-periment showing C, O , N and Ni mappings . . . 51
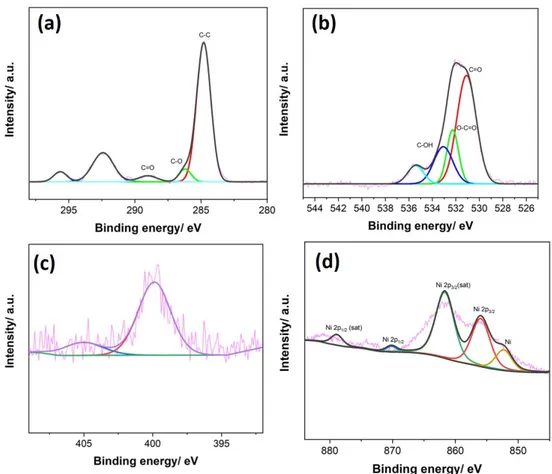
3.14 XPS spectra of (a) C 1s and (b) O 1s (c) N 1s and (d) Ni 2p after 3h CA for ERGO: Ni-P . . . 52
3.15 (a) Polarization curves of Ni.5-P, Ni1-P and Ni2-P in 0.1 M KOH
at scan rate of 1 mV s−1 (b) Tafel plot of same composites showing Tafel slope(c) CV curves in double layer region at scan rates of 50, 60, 70, 80, 90 and 100 mV s−1 of Ni2-P (d)The capacitive currents
at 0.81 V as a function of scan rate for Ni2-P (∆j=janodic-jcathodic) 55
3.16 (a) Chronoamperometry (CA) for Ni2-P at -0.34 V in 0.1 M
KOH(b) Polarization curves for Ni2-P in acidic, neutral and
LIST OF FIGURES xii
3.17 (a) Polarization curves of GO1-Ni.5-P, GO1-Ni1-P, GO1-Ni2-P,
GO.5-Ni2-P and GO2-Ni2-P in 0.1 M KOH at scan rate of 1 mV
s−1 (b) Tafel plot of same composites showing Tafel slope(c) CV curves in double layer region at scan rates of 50, 60, 70, 80, 90 and 100 mV s−1 of GO1-Ni2-P (d)The capacitive currents at 0.81 V as
a function of scan rate for GO1-Ni2-P (∆j=janodic-jcathodic) . . . 59
3.18 (a) Polarization curves of GO1:Ni.5-P, GO1:Ni1-P, GO1:Ni2-P,
GO.5:Ni2-P and GO2:Ni2-P in 0.1 M KOH at scan rate of 1 mV
s−1 (b) Tafel plot of same composites showing Tafel slope(c) CV curves in double layer region at scan rates of 50, 60, 70, 80, 90 and 100 mV s−1 of GO1:Ni2-P (d)The capacitive currents at 0.81 V as
a function of scan rate for GO1:Ni2-P (∆j=janodic-jcathodic) . . . 61
3.19 (a) Polarization curves of ERGO1-Ni.5-P, ERGO1-Ni1-P, ERGO1
-Ni2-P, ERGO.5-Ni2-P and ERGO2-Ni2-P in 0.1 M KOH at scan
rate of 1 mV s−1 (b) Tafel plot of same composites showing Tafel slope(c) CV curves in double layer region at scan rates of 50, 60, 70, 80, 90 and 100 mV s−1 of ERGO1-Ni2-P (d)The capacitive
currents at 0.81 V as a function of scan rate for ERGO1-Ni2-P
(∆j=janodic-jcathodic) . . . 63
3.20 (a) Polarization curves of ERGO1:Ni.5-P, ERGO1:Ni1-P, ERGO1:Ni2
-P, ERGO.5:Ni2-P and ERGO2:Ni2-P in 0.1 M KOH at scan rate of
1 mV s−1 (b) Tafel plot of same composites showing Tafel slope(c) CV curves in double layer region at scan rates of 50, 60, 70, 80, 90 and 100 mV s−1 of ERGO1:Ni2-P (d)The capacitive currents
at 0.81 V as a function of scan rate for ERGO1:Ni2-P (∆j=janodic
-jcathodic) . . . 65
3.21 (a) Polarization curves showing the effect of adding GO and nickel separately (b) Polarization curve showing the effect of number of layers on ERGO1:Ni2-P in 0.1 M KOH . . . 67
LIST OF FIGURES xiii
3.22 (a) Impedance spectra of ERGO1: Ni2-P in 0.1 M KOH solution at
different applied overpotentials. The inset shows the equivalent cir-cuit (b) Bode plot of ERGO1: Ni2-P showing phase and impedance
(c) The capacitive currents at 0.81 V as a function of scan rate (∆j=ja-jc) and (d) Impedance spectra of ERGO, GO1:Ni2-P and
ERGO1: Ni2-P modified FTO electrode in 0.1 M KOH. . . 68
3.23 Polarization curves for ERGO1:Ni2-P in acidic, neutral and basic
mediums . . . 69
3.24 Impedance spectra of ERGO1: Ni2-P-modified FTO in 1 M KOH.
The inset shows the equivalent circuit . . . 70
3.25 (a) CV curves in non-faradaic region at scan rates from 50 to 100 mV/s for ERGO1: Ni2-P in 1 M KOH (b) The
capaci-tive currents at 0.81 V as a function of scan rate (∆=ja-jc) (c)Chronoamperometry at -1.2 V vs RHE in 1 M KOH for 12000 seconds (d) Polarization curves of ERGO1: Ni2-P initially and
af-ter 12000 seconds chronoamperometry test at -1.2 V vs Ag/AgCl in 1 M KOH. . . 71
A.1 Chronoamperometry measurements for (a) Ni-P (b) GO-Ni-P (c)GO:Ni-P and (d) ERGO:Ni-P in 0.1 M KOH . . . 89
A.2 EDX analysis showing elemental composition for (a) GO (b) ERGO and (c) ERGO:Ni-P . . . 90
A.3 Cyclic voltammetry scans in 0.1 M PBS for (a) GO and (b) GO:Ni-P 90
A.4 1H NMR for TPP-4(OCH
3) . . . 91
A.5 1H NMR for TPP-4OH . . . . 91
LIST OF FIGURES xiv
List of Tables
3.1 Compositions of all Ni-P inks . . . 53
3.2 Electrochemical parameters for Ni-P samples from potentiometry 54 3.3 Compositions of GO-Ni-P samples (all in one ink) . . . 57
3.4 Electrochemical parameters for GO-Ni-P samples (all in one ink) . 58 3.5 Compositions of all GO:Ni-P samples . . . 60
3.6 Electrochemical parameters for GO:Ni-P composites . . . 60
3.7 Electrochemical parameters for ERGO:Ni-P composites . . . 62
3.8 Electrochemical parameters for ERGO:Ni-P composites . . . 64
LIST OF TABLES xvii
List of abbreviations
b Tafel slope (mVdec−1) CA Chronoamperometry CB Cucurbit[n]uril CB[8] Cucurbit[8]uril CV Cyclic voltammetry
ECSA Electrochemical active surface area EIS Electrochemical impedance spectroscopy ERGO Electrochemically reduced graphene oxide
ERGO:Ni-P Layer of nickel porphyrin functionalized on layer of electrochemically reduced graphene oxide
ERGO-Ni-P Electrochemically reduced graphene oxide nickel porphyrin all in one ink
ES-MS Electro Spray Mass Spectroscopy F Farady’s constant (96485 C/mol) FE Faradaic efficiency
FT-IR Fourier Transform Infrared Spectroscopy GO Graphene oxide
HER Hydrogen evolution reaction j Current density (mAcm−2) ja Anodic current density jc Cathodic current density jo Exchange current density LSV Linear sweep voltammetry
N Amount of hydrogen produced in moles n Number of electrons transferred
LIST OF TABLES xviii
NA Avogadro’s number (6.023Ö1023 atoms/ mol) NMR Nuclear magnetic resonance
OER Oxygen evolution reaction
Q Total charge
R Resistance
R’ Ideal gas constant
Rct Charge transfer resistance RHE Reversible hydrogen electrode Rs Solution resistance
S Suraface area of electrode SEM Scanning Electron Microscopy T Temperature (K)
TOF Turnover frequency TPP Tetraphenyl porphyrin
XPS X-ray Photoelectron Spectroscopy XRD X-ray Diffraction
Z Impedance
Z’ Real part of Impedance Z” Imaginary part of Impedance η Overpotential
Chapter 1
Introduction
1.1
Hydrogen as an alternative fuel
The consistent increase in energy requirements has introduced the excessive uti-lization of non-renewable energy sources around the world. According to the World Coal Institute, with the current consumption rate of fuels, it is predicted that coal will completely deplete in 130 years, natural gas in 60 years and oil in 42 years.[1] In addition to their limited resources, these fuels introduce major con-cerns due to their serious environmental issues. Moreover, Fuels such as biodiesel or gasoline are not readily available everywhere and require a complicated engine technology for effective production. Therefore, the search for an alternative clean energy fuel has been intensively under study. Renewable fuels, produced from solar or wind energies, are capable of providing greater energy than any conven-tional fossil fuel.[2] It is predicted that by the years 2025 and 2050, 36% and 69% of the energy supplied will come from renewable sources. In specific, 11% of energy supplied will come from hydrogen in 2025 and 34% in the year 2050.[3]
In the past decade, hydrogen has attracted great attention as a promising fuel for the future. It is the simplest, most readily abundant element on earth. It easily combines with other chemicals and produces only water as a combustion
product, allowing it to be a potential candidate for an eco-friendly fuel. Further-more, hydrogen releases three times more energy (122 kJ/g) than fuels based on hydrocarbon. [4]
1.1.1
Hydrogen production methods
Hydrogen can be produced using renewable (solar, wind, hydroelectric and geothermal energy) or nonrenewable resources (natural gas, coal, biomass and nuclear). Currently, most hydrogen is produced from fossil fuels. This is achieved by several process technologies namely: steam reforming of natural gas, thermal cracking of natural gas, partial oxidation of hydrocarbons (heavier than naphtha) and coal gasification. Another production technique is by pyrolysis or gasifica-tion of biomass which produces a mixture of gases (H2, CH4, CO2, CO and N2).
Finally, hydrogen could be produced from water via electrolysis, photolysis, ther-mochemical process, direct thermal decomposition (thermolysis) and biological production. [5]
Currently, more than 95% of the global hydrogen is produced by non-renewable fossil fuels, mostly by steam reforming of natural gas. The rest, less than 5%, is produced by water electrolysis and biomass.[6] The production of hydrogen from steam reforming of natural gas and hydrocarbons results in a high yield with low operational and production costs.[7] The process involves two steps: first the hydrocarbon fuel reacts with steam producing syngas (H2/CO gas mixture). In
the second step, the cooled syngas gas is fed into the carbon monoxide catalytic converter where it is converted into carbon dioxide and hydrogen by the help of steam. The foremost disadvantage of this process is the enormous release of carbon dioxide, 7.05 kg CO2/kg H2. [8] The efficiency of hydrogen production by
this process is usually limited by two main parameters. One is the characteristics of catalysts (e.g. effectiveness factor) due to the heat and mass transfer limitations of reformers. Typically, nickel catalysts are used so the kinetics is scarcely a limitation. [9] The other crucial factor is the ratio of hydrogen to carbon atoms in the reactant fuel. The higher this ratio the less carbon dioxide emission. [10]
Another method for producing hydrogen gas is using Biomass as the starting material. Biomass is any living matter that is produced by organic residues and wastes which is used as a form of energy. The main sources of biomass include: wood, agriculture crops, animal waste and industrial wastes from food processing and aquatic plants. [11] Biomass will play a major rule in the future in the production of chemicals and fuels since it is a renewable and sustainable energy source. [12] It is anticipated that 25% of the world’s primary energy supply will be derived from biomass by the year 2050. [13] Secondary energy carriers such as heat, electricity and fuels can be generated from raw biomass in various conversion methods that could be biological, chemical or thermal.[14] Hydrogen gas in specific, can be produced from biomass by biological means using anaerobic digestion, fermentation and metabolic processing or thermochemical processes such as gasification, high pressure aqueous and pyrolysis.[15] Biomass gasification involves the partial oxidation of materials into a mixture of hydrogen, methane, hydrocarbons, carbon monoxide and carbon dioxide.[16] This process results in a product with low thermal efficiency, due to the vaporization of biomass, and high cost since a large amount of biomass is used initially.[17]
Pyrolysis is the process of heating a biomass in the absence of air at temper-ature of 650-800K and pressure between 0.1 and 0.5 MPa. Pyrolysis can be clas-sified into slow and fast pyrolysis depending on the speed of heating. Hydrogen production is normally performed under fast pyrolysis where the biomass feed-stock is quickly heated to form vapor which further forms a condensed liquid.[18] This process results in products in the three states, gaseous products (H2, CH4,
CO and CO2), liquid products (tar, oils...) and solid state (char and carbon).[19]
Besides the gaseous products, hydrogen can be produced by processing the pro-duced oils. Pyrolysis oil separates into two parts based on solubility where hydro-gen can be produced from the water-soluble fraction. The four crucial parameters that influence the efficiency of this process are: Temperature, heating rate, res-idence time and type of catalyst. For large production rate of hydrogen, long residence time, high temperature and heating rate are desired.[20]
methods include the use of water. This is achieved by either electrolysis, photo-electrolysis or thermolysis. Electrolysis is the simplest water splitting method in which an electrochemical cell is composed of two electrodes and an electrolyzer. When electricity is supplied to the system, water essentially splits into hydrogen and oxygen at cathode and anode respectively. In acidic medium, water oxidizes at the anode forming oxygen, four protons and electrons. The electrons then flow through the external circuit towards the cathode. Meanwhile, protons from anode move across the electrolyte to the cathode. The protons combine with the electrons that came from external circuit to produce hydrogen gas.[21]
The half-reactions that occur at anode and cathode in acidic electrolyte can be written as:
Anode reaction:
2H2O → O2+ 4H++ 4e− (1.1)
Cathode reaction:
4H++ 4e− → 2H2 (1.2)
The most common electrolysis system involves using an alkaline electrolyzer, mainly aqueous potassium hydroxide (KOH) but other techniques such proton exchange membrane (PEM) electrolysis and solid oxide electrolysis cells (SOEC) units are developing. Although alkaline systems are frequently used, they have a low efficiency hence use a huge amount of energy. Therefore, the use of solid oxides for electrolysis is much more efficient than alkaline however, it imposes challenges due to corrosion and seals.[21]
Photoelectrolysis, as the name suggests involves the same working principles as electrolysis with the extra addition of a light source. The sun provides us with 4.3 ×10²⁰ Joules/hr which is enough to fulfil our global energy need for a year. This implies that if only 0.8% of the land on earth is covered with solar cells with an efficiency of 10%, the total power generated is 30TW which is more than enough to satisfy the current annual energy needs (17.7 TW). In a photo-electrochemical cell (PEC), typically a light source, similar to sunlight, is used
to decompose water into hydrogen and oxygen on the surface of a semiconduc-tor. When the energy of the photon incident is greater than the semiconductor’s bandgap, the photon gets absorbed onto the material releasing an electron hence a forming a hole. When a p-type semiconductor (excess holes) or a n-type (excess electrons) is immersed into an aqueous electrolyte, electrons and holes are forced to travel opposite directions. Holes move to the anode where they decompose water to form hydrogen ions and gaseous oxygen, while electrons flow through the outer electrical circuit to the cathode. The hydrogen ions then diffuse into the electrolyte and gain electrons to form hydrogen gas at the cathode. The photoelectrode and semiconductor materials are the most crucial variables that determine the activity of this system.[22]
In order to achieve a PEC cell with good efficiency, the electrode material must have the following characteristics: the semiconductor material must gen-erate a sufficient voltage (>1.23 eV) for water splitting. This means that the irradiated light should attain energy greater than the bandgap of the material. It is convenient to have a material with a small bad gap (< 2.2 eV) for sufficient photocatalytic activity. The electrode material must also be resistant to corrosion in electrolyte and light exposure. Typically, metal oxides are known to be stable semiconductor catalysts, but their band gaps are usually too large for absorption of light (around 3 eV). The material should have a reasonable price of production and operation with a high quantum yield.[21]
Finally, in thermochemical water splitting, or otherwise known as thermolysis, only heat is used to decompose water into hydrogen and oxygen. Water decom-poses at a temperature of 2500°C but it is difficult to sustain materials at such a high temperature. Recent researches are aimed on reducing this temperature and using higher pressures. [21]
1.1.2
Applications of Hydrogen
Hydrogen gas is a foreseen alternative fuel for the near future owing to its out-standing properties that permit its usage in numerous fields. Along with its
application in fuel cells to produce electricity, hydrogen gas is used as transporta-tion fuel in vehicles and even as a rocket fuel in NASA since the 1950s.[23] It has also been used in industry in fertilizer production, pharmaceuticals, glass purification and in petroleum refineries.
Renewable electricity is produced mainly from solar, hydropower, geothermal and wind energies that are challenging to store for later use. Currently, industrial scale electricity is stored in pumped hydropower stations. These storage systems or adiabatic air systems have high efficiencies since the potential energy of various levels or compression can instantly be converted to electricity. But as the demands for renewable energy will increase in future, larger electricity storage systems will be required. Hydrogen has the potential to serve as electricity storage as it stores in the range of 100 GWh in underground salt caverns.[2] This high energy density allows it to store a huge amount of energy, however due to the additional conversions by electrolysis and fuel cell it has a lower efficiency in comparison to pumped hydropower stations. Considering the three main criteria: energy density, efficiency and price, hydrogen makes the best fit for future renewable energy storage that is ready for basic power supply.
As the carbon dioxide emission continues to increase drastically with excessive use of vehicles, more environmentally friendly transportation fuels are constantly under investigation. Recently, fuel cell-based vehicles are being constructed. These vehicles consist of a fuel cell, hydrogen tank, electric motor and a Lithium-Ion battery. It is essential to have a battery in order to recover braking energy by using electric energy as a generator. Also, it is useful in low temperatures as it can preheat the car using waste heat of fuel cell. Typically, the electricity from motor is used to fill the battery and the heat from fuel cell is used for warming up the car. Furthermore, vehicles operated by hydrogen gas are found to be twice as efficient as conventional fuels and power trains used today. Therefore, in order to achieve longer operating ranges, higher payloads and fast refueling abilities vehicles will very likely be based on hydrogen fuel cell in the foreseeable future.[2]
1.2
Electrochemical water splitting
1.2.1
Thermodynamics
The general water splitting reaction at standard conditions (298 K, 1 bar) is described by:
H2O → H2+
1
2O2 (1.3)
At reversible conditions, when pressure and temperature are constant:
∆G = ∆H − T ∆S (1.4)
Where ∆H is the enthalpy change, that is the total amount of energy required for the water splitting reaction to occur, it is measured in J/mol. The enthalpy of water splitting reaction is positive which indicates an endothermic reaction. ∆S is the entropy change which is positive for non-spontaneous reactions such as the reaction above. Here, ∆G is the Gibbs free energy that is the electrical energy demand for water splitting. At room temperature and pressure, ∆G is equal to 237.13 kJ for water splitting (∆H°=285.83 kJ/mol and ∆S°=163.09 J/mol.K). The positive value of Gibbs indicate that water splitting is a non-spontaneous reaction hence requires a large external input to proceed. The standard cell potential E° is related to Gibbs free energy by the following relation.
∆Go = −nF Eo (1.5)
where n is the number of electrons transferred (n= 2 in this case) and F is the Faraday constant (96,485 C/mol). Using these parameters, the value of standard potential of the water electrolysis is calculated to be −1.229 V at 25oC. [21]
The minimum voltage at room temperature required for water splitting is 1.23V. However, additional energy is required to make the reactions proceed
at appreciable rates (that is, activation energy). The faster the rate of water splitting (measured as charge flowing per unit area of electrode per unit time, or ‘current density’), the greater the activation energy that must be supplied. This additional energy manifests as a requirement for potential bias above the 1.23V minimum. The term ‘overpotential’ (often given the symbol η) describes how much additional voltage must be applied to obtain a given current density. The role of electrocatalysts is then to reduce this overpotential as far as possible. The electrochemical water splitting undergoes different mechanisms depending on the electrolyte of use. In acidic mediums for instance, water splits into oxygen gas and protons that further gets reduced at the cathode forming hydrogen gas. In basic mediums however, the absence of protons in electrolyte forces the charge transfer by hydroxide ions instead, as shown in the equations below. Hydrogen gas is again evolved at the cathode and oxygen at the anode.[24]
In H2SO4 Cathode(HER) : 4H++ 4e−→ 2H2 (1.6) Anode(OER) : 2H2O → 4H++ 4e−+ O2 (1.7) In KOH Cathode(HER) : 4H2O + 4e−→ 2H2+ 4OH− (1.8) Anode(OER) : 4OH−→ 2O2+ 2H2O + 4e− (1.9)
Under acidic conditions (Equation 1.6, Equation 1.7), the best electrocatalysts are precious metals (platinum at the cathode and IrO2 or RuO2 at the anode).
Under basic conditions, the HER and OER proceed according to Equation 1.8 and Equation 1.9, in which case first row transition metals (and their alloys) and
oxides make excellent HER and OER catalysts, respectively. The best-known heterogeneous catalysts for the HER are based on platinum. Because platinum is rather expensive and rare, there has been considerable interest in hydrogen evolution electrocatalysts featuring more plentiful elements. Under very alkaline conditions (30% KOH in water), first row transition metals, such as nickel, have long been known to be effective HER catalysts.
1.2.2
Factors affecting efficiency of the electrochemical
cell
The most crucial factor that affects water splitting, is the choice of electrocatalyst. The ideal electrode material for electrochemical water splitting should have a suitable price range, is chemically stable, inert and resistant to corrosion.[25] Platinum, gold, and silver are well-known electrode materials but their high price limits their excessive use at the commercial level. Usually metal oxides and phosphides such as nickel and cobalt are used as electrode materials in alkaline and acidic electrolytic baths.
Another factor that influences the efficiency of an electrochemical cell is tem-perature. The extent of water splitting is reduced as temperature increases be-cause energy demand of reaction decreases.[26] Heat can also reduce the equilib-rium voltage resulting in larger bubbles with lower rising velocities and a decline in efficiency due to larger void fraction.[27] An increase in temperature may in-troduce other issues concerning stability of electrode material, glass ware or may lead to disturbance in the system.
Furthermore, the electrolyte quality and resistance affect the performance of water splitting. The presence of mobile ions in the water is crucial for water splitting to occur therefore, the electrolyte must be either acidic or basic since pure water is strongly resistive to electricity.[28] However, high acidic or basic concentrations of electrolyte are not desired due to their corrosive nature, for ex-ample, 25%–30% aqueous KOH is widely used in electrolyzers. Likewise, very low
concentrations are not used as they increase electrical resistance hence decrease electrocatalytic performance and efficiency of electrochemical cell.[29] Basic medi-ums are more common electrolytes as most electrocatalysts are not very stable in acidic environments. It is also important to free the electrolyte from dissolved gases, therefore, the mediums are usually degassed with argon or nitrogen prior to electrochemical measurements.
Finally, the orientations of the electrodes should also be considered. Size, align-ment, and space between the electrodes are factors that may affect the efficiency of electrocatalysts. It is crucial to use electrodes with similar heights to prevent introducing larger volume of void fractions that lead to additional power dissipa-tion to the cell.[27] Furthermore, vertically placing the electrodes result in easier release of bubbles hence increasing efficiency. Likewise, reducing the distance be-tween the electrodes minimizes the electrical resistance in electrochemical cells. However, too close electrodes will increase void fractions hence reduce efficiency of the process.
1.2.3
Electrocatalysts for HER
Platinum-based catalysts are the most prominent leading catalysts for hydrogen evolution reaction with a nearly zero onset potential and a rapid current increase with voltage.[30] However, their scarcity, high cost in large scale utilization en-courages the continuous search for cheaper and more durable alternatives with high performance. Other less expensive noble metal-based catalysts (Pd, Ru) have been investigated for this purpose yet they have poorer performance.[31] The strong need for an effective HER catalyst has devoted the research on non-precious metals such as Mo, Co, Ni and Fe. Nickel-based materials are potentially considered for HER owing to their low cost, high electrical and thermal conductivity, good ductility, resistance to corrosion and durable strength.[32] Nickel -based electrocatalysts could be very effective alternative to Pt since they both have very similar chemical properties, are in the same group in periodic table and
are much cheaper and more readily abundant that Pt.[33] Besides metal hydrox-ides and oxhydrox-ides, many scholars are modifying nickel based catalysts by implanting other non-metals such as C, N, P and S to control their structures. Gong et al. reported a highly effective HER catalyst based on NiO/Ni−CNT with current density −81 mV at η @-10 mAcm−2. Both Ni and NiO enhanced the HER activ-ity in distinct ways. The study predicts that Ni metal boosts the adsorption of hydrogen onto catalyst surface while NiO was the favored region for absorption of OH− produced by nickel sites. The positive charge of Ni2+ ions along with the
larger number of d orbitals present in the oxide in comparison to metal Ni is the root of the strong electrostatic attraction between NiO and hydroxide ions.[34]
Although metal-free HER catalysts are not that common, organic-based cat-alysts are being taken into consideration owing to their exclusive synthetic flexi-bility, excellent chemical staflexi-bility, strong tolerance to acid and alkaline medium and low processing costs.[35]
1.2.3.1 Graphene oxide
Graphene is a 2-D honey comb structure comprising of a single layer of tightly bonded sp2 carbon atoms.[36] Over the past few years, graphene has drawn
sig-nificant attention because of its unique mechanical, thermal, optical and elec-trical properties. In particular, graphene has a high thermal conductivity (5000 Wm−1K−1), attains good charge carrier mobility at room temperature (200,000 cm2V−1s−1) and has an exceptionally large surface area (2600 m2g−1).[36, 37]
The oxidation of graphite powder by strong oxidizing agents result in the formation of layered graphite oxide that is rich in hydroxyl and epoxide functional groups on its basal planes and carbonyl, carboxyl groups on its edges.[38] Owing to these oxygen-containing functional groups, graphite oxide is readily dispersible in water, forming stable suspensions of extremely hydrophilic graphene oxide sheets.[39, 40] Exfoliation of graphite oxide has been proven to be a reliable method to produce stable suspensions of quasi-2D carbon sheets, making this a strategic starting point for large-scale synthesis of graphene sheets.[41]
Figure 1.1: Structure of graphene oxide and the different methods to reduce it
As shown in Figure 1.1, there are many techniques for synthesis of graphene and the reduction of graphene oxide.[42] To date various methods have been established to produce graphene including micromechanical exfoliation, chem-ical and electrochemchem-ical reduction of graphite oxide and bottom-up organic synthesis.[43, 44, 45] Due to its low cost and significant scalability, reduction of graphene oxide (GO) has shown to be an efficient and reliable process for synthesizing graphene nanosheets. [46]
GO is not a readily abundant compound; its chemical composition and the mechanism of its oxidation remain unclear due to its non-stochiometric charac-ter, robust hygroscopic properties as it is rich in oxygen groups.[47] The removal of theses oxygen entities results in the production of reduced graphene oxide which resembles pristine graphene.[48] Therefore, it is vital to choose a suitable reducing method for this reaction. The reduction process can intensely enhance the electrical conductivity of graphene oxide. The excessive charge carrier con-centration and mobility in the material improves the reflection to incident light hence, RGO results in metallic shine film while GO remains in brown color.[49] Furthermore, the chemical reduction of GO (with hydrazine) produces a black precipitation from the yellow–brown GO suspension. This is most likely due to the increase in the hydrophobicity of the material caused by a decline in polar functional groups on the surface of the sheets.[50]
There are numerous methods to reduce graphene oxide; namely: thermal, chemical, photocatalytic and electrochemical. Graphene oxide can be re-duced exclusively by rapid heating (>2000 °C/min) in a process named thermal
annealing reduction. In the primary stages of reduction, the excessive heat is used to exfoliate graphite oxide to achieve graphene.[51, 52] This abrupt rise in temperature promotes the decomposition of oxygen containing groups on the car-bon plane that results in a massive pressure between the stacked layers. The final product is named graphene rather than reduced graphene oxide as the heating not only exfoliates graphite oxide but also intensively reduces the functionalized oxygen-containing groups on graphene sheets by decomposing at elevated tem-perature.
Chemical reduction involves the usage of strong chemical reducing agents under room temperature or moderate heating. This method doesn’t require spe-cial equipment and environment as that of thermal annealing treatment mak-ing it a cheaper and an easily obtainable technique for the mass production of graphene compared with thermal reduction. Hydrazine and many of its deriva-tives have been considered as the best-known chemical agents for graphene oxide reduction.[53] However, due to its toxic nature hydrazine exhibits some concerns with environment and safety, which have encouraged researchers look for alter-native “green reduction agents”. Ascorbic acid (Vitamin C) is a recently studied green reducing reagent for graphene oxide, which is considered to be an ideal al-ternative for hydrazine. Fernandez-Merino et al. discovered that graphene oxide reduced by Ascorbic acid could attain a carbon to oxygen ratio of about 12.5 and a conductivity of 77 S/cm, which are comparable to the values obtained by using hydrazine.[54] Therefore, the use of Ascorbic acid is favored over hydrazine on account of its non-toxicity and high chemical stability.
Furthermore, reduced graphene oxide can be produced by photocatalyst reduction with the support of a photocatalyst such as TiO2. Williams et al.
conveyed the reduction of colloidal GO by TiO2 particles under ultraviolet (UV)
irradiation. A change in color from light brown to dark brown/black was also observed after UV irradiation for 2h in ethanol.[55]
Another promising method for producing reduced graphene oxide is electrochemical reduction. Electrochemically reduced graphene oxide is found to
be more conductive while possessing a lower oxygen to carbon ratio than the con-ventional chemically reduced one.[56] The electrochemical reduction of graphene oxide is achieved by applying a negative potential that reduces the oxygen func-tional groups on its surface.[57, 58] Graphene or reduced graphene oxide is used as an effective electron acceptor that can be used to improve photoinduced charge transfer and prevent the reverse reaction by separating the evolution sites of hy-drogen and oxygen resulting in an enhanced hyhy-drogen production efficiency.[59] Electrochemical reduction of graphene oxide sheets or films can be conducted in a conventional electrochemical cell at room temperature using an aqueous buffer solution as an electrolyte. This reduction technique requires no special chemical agent, and is primarily triggered by the electron exchange between graphene ox-ide film and electrodes. After depositing a thin film of graphene oxox-ide onto the working electrode, an inert electrode is placed opposite the film, the reduction process begins as the cell in charging. The reduction can be achieved by cyclic voltammetry scanning in the negative potential window and is confirmed by a observing a single cathodic current peak in the first cycle. The position of this peak varies from one study to another, due to the choice of buffer medium and the method of synthesis of graphene oxide.[60] Nevertheless, it is clear that in most cyclic voltammetry studies GO-coated electrode, the cathodic current peak in the first cycle of scanning decreases considerably in the following scanning cy-cle and vanishes almost completely after several scanning cycy-cles indicating that the electrochemical reduction of GO to ERGO is an irreversible process.[61, 62]
1.2.3.2 Porphyrin and its derivatives
Organic materials are recently being considered for various applications due to their unique properties. The molecular structures and functions of these materials can be modified by molecular design and tailoring. These π-conjugated molecules can be used for the fabrication of functionalized nanomaterials and nanodevices owing to their delocalized π-electron system.[63, 64] Porphyrins in particular have attracted major attentions because of their exceptional ability to harvest light, chemical stability, good semiconducting behavior and effective supramolecular
assembly that can be easily modified.[65, 66]
Porphyrins are a group of conjugated macrocycles consisting of 4 pyrrole rings aromatically interconnected through a methylene bridge (=CH-), containing 11 conjugated double bonds.[67] In many cases porphyrin is coordinated with a transition metal in its core which is often used to modify its properties. Such compounds are called metalloporphyrins. This metal center induces the for-mation of a metal-hydrogen and behaves as a redox center in multielectron re-duction processes.[68] Unlike metalloporphyrins, the two basic imine nitrogen atoms in metal-free porphyrins’ core results in the formation of deprotonated porphyrin species.[69] Furthermore, the four nitrogen atoms in the porphyrin core are adequate for combining protons close together to lower the activation energy of hydrogen production by modifying the transition state of H-H bond formation.[70] Owing to the four available nitrogen atoms in the inner core of porphyrin, it can be conjugated to various functional groups. Tetrakis(4-hydroxyphenyl)porphyrin (THPP) for instance, consists of four phenol unit, 5,10,15,20-tetraphenyl-21H,23H-porphyrin (TPP) is made up of 3 benzene rings and one phenol unit while 5-(4-hydroxyphenyl)-10,15,20-tri-(p-phenyl)porphyrin (TPPOH) composes of four benzene groups on its extremes.
With the aid of a catalyst, electron donor and an electron carrier, por-phyrins have been extensively implemented in electrocatalytic systems for ap-plication in water splitting reactions. Owing to their exclusive properties, por-phyrins may act artificial photosensitizers behaving analogously to the natu-rally found photosensitizers chlorophyll and ferredoxin.[71] Qian et al, reported a conjugated polymer based catalytic system for application in hydrogen pro-duction. The photosensitizer used was zinc meso-tetra(1-methylpyridinium-4-yl) porphyrin chloride [ZnTMPyP4+] Cl4, electron carrier and donor were viologens
and ethylenediaminetetraacetic acid (EDTA) respectively and the catalyst uti-lized was hydrogenase.[72] Another similar report by Lazarides et al. studied the same [ZnTMPyP4+] Cl
4 as a photosensitizer but used cobaloxime complex as a
catalyst. This system resulted in good hydrogen efficiency with TON of 280 and over a 20 h stability.[73] Moreover, another study involved the use of conjugated monohydroxylated cucurbit(7)uril(CB7) to tetraphenyl porphyrin (TPP-4CB7)
as a photosensitizer for HER. This novel assembly together with TiO2 and
plat-inum (TPP-CB-TiO2@Pt) resulted in excellent activity with low potentials (onset
= -10 mV and η@10mAcm−2= -470 mV) and produced a large amount of hydro-gen (24.5 mmol h−1 g−1).[74] Other studies involved the application of different photosensitizers that photoinitiated Co, Fe, and Rh porphyrins catalysts for hy-drogen evolution reaction. In one study for example, hyhy-drogen evolution was achieved in 1 M phosphate buffer solution using [Ru(bpy)32+ as the
photosensi-tizer, ascorbic acid as the electron donor and cobalt (II) porphyrin as the catalyst. The resulting system was found to be very effective with fast electron transfer (2.3× 10⁹ M−1s−1) and high TON (725).[75]
Cucurbit[n]urils are robust macrocyclic structures synthesized by a conden-sation reaction between glycoluril units and formaldehyde with the help of an acid catalyst.[76] After its initial discovery, Mock et.al successfully crystallized it from the reaction and the resulting product composed of 6 glycoluril units tightly bound by 12 methylene bridges. This macrocycle was given the name cucurbit[6]uril (CB6), owing to its six glycoluril units.[77] The unique proper-ties of this macrocycle permit easy non-covalent bindings due to its ability to form complexes with cations via interactions with carbonyl units and internalize alkyl chains within its hydrophobic cavity. The Cucurbituril family was fur-ther studied by Kim [78] and Day [79, 80] which resulted in the discovery of new CB[n] homologues containing 5,7,8 and 10 glycoluril units that were named CB[5], CB[7], CB[8] and CB[10] respectively. The variation in the number of glycoluril units lead to difference in cavity size, guest binding affinity, water solubility and size selectivity in the Cucurbituril family.[77] The application of cucurbiturils (mainly CB[5]-CB[8]) have been widely studied in various fields including ap-plications in drug delivery,[81] catalysis [82] fluorescence spectroscopy,[83] and nanotechnology[84].
1.2.3.3 Porphyrin - GO composites
Porphyrin has been commonly investigated in the field of catalysis due to its unique structure, high thermal stability and outstanding electrical properties.[85]
The properties of porphyrin can be improved and modified by introducing dis-tinct functional groups or metal ions. Recently, porphyrin has been linked to carbon based functional groups such as carbon nanotubes and graphene either by covalent or non-covalent interactions.[86] Similarly, the presence of epoxide, hydroxyl and carboxyl functional groups in graphene oxide permit covalent or non-covalent functionalization with various organic and inorganic materials. In many cases, the composite requires a metal linker to promote electron transfer between the two entities. Non-noble metal ions act as interfacial electron-transfer mediators and endorse charge separation by quickly transferring electrons which is the root to enhancing the electrocatalytic activity of GO/porphyrin compos-ites. The composite can be thought of as a donor-acceptor combination where electrons from GO are accepted by porphyrin rings that are delocalized in the π conjugated structures.
Over the past few decades, a series of porphyrin- graphene oxide complexes have been synthesized for the use in various applications. For instance, re-duced graphene oxide-porphyrin complex was used for electrochemical biosen-sor to regulate dopamine and serotonin[87], nanorod composites for solar light harvesting[88], photothermal therapy of brain cancer[89], amperometric biosens-ing [90] and photocatalytic degradation over TiO2 nanotubes.[91] Furthermore,
porphyrin functionalized on reduced graphene oxide sheets has been used for oxygen revolution reactions (OER) and hydrogen revolution reactions (HER). Ma, et al. reported the synthesis of Co porphyrin and electrochemically reduced graphene oxide hybrid film (CoTMPyP/ERGO) for HER in alkaline medium.[92] The onset potential was found to be -220 mV and the Tafel slope was 99 dec−1 in 0.1 M KOH. Another study on Co porphyrin/electrochemically reduced graphene oxide hybrid film was prepared using alternating layer by- layer (LBL) assembly.[93] The overpotential at 1 mAcm−2 was found to be -474 mV and the Tafel slope was 116 dec−1. One more study by Luo, et al. involved the synthesis of graphene oxide hybrid functionalized on tetrakis-(4-hydroxylphenyl) porphyrin (THPP) and 1-pyrenesulfonic acid (PSA) for photocatalytic hydrogen evolution.[94] The average rate of hydrogen evolution for GO/THPP/PSA hybrid was found to be 44.3µmol h−1 g−1.
1.3
Activity parameters for HER
Linear sweep voltammetry, cyclic voltammetry, chronoamperometry and electri-cal impedance spectroscopy are all techniques in potentiostat used to evaluate electrochemical activity of a catalyst. Since water splitting is a non-spontaneous process, it requires an addition potential to drive the reaction, this is known as overpotential (η).
The Nernst equation is used to convert all the potentials measured by poten-tiostat (vs reference electrode) to the reversible hydrogen electrode (RHE). In the case when Ag/AgCl is used a a reference electrode, the potentials obtained are converted as shown below.
ERHE = EAg|AgCl|KCl(sat.)+ 0.059pH + EAg|AgCl|KCl(sat.)o (1.10)
Where ERHE is potential estimated vs. RHE, EAg|AgCl|KCl(sat.) is the measured
potential vs. Ag| AgCl| KCl(sat.) electrode and EoAg|AgCl|KCl(sat.) is the standard
electrochemical potential of the Ag| AgCl| KCl(sat.) electrode i.e. 0.1976 V at room temperature.
1.3.1
Overpotentials
The reversible potentials with respect to standard hydrogen electrode (vs. RHE) for hydrogen evolution reaction (HER) and oxygen evolution reaction (OER) are 0 V it is 1.23 V respectively. Therefore, the overpotentials of HER and OER without iR compensations can be calculated as: ηOER =ERHE - 1.23 V and
ηHER = ERHE - 0 V. The current density of 10 mAcm−2 has been recognized
as a benchmark for the analysis and characterization of different electrocatalytic materials in all media for both HER and OER. The onset potential is the potential at which a drastic increase in reduction current is observed.[96]
1.3.2
Tafel plots
A plot of overpotential(η) vs log current density is known as a Tafel plot, which is a useful tool for evaluating kinetic parameters. The relationship between over-potential and current density at the electrode surface is given by Butler–Volmer equation.[97] j = j0 h eαAnFRT η− e−αC nFRT η i (1.11)
Where j is the current density, j0 is exchange current density respectively, αA
and αC are the charge transfer coefficients for the anodic and cathodic reactions,
respectively. F is the Faraday constant (96485 C/mol), n is the number of elec-trons transferred, R’ is the ideal gas constant, and T is the absolute temperature in K.[97] At high overpotentials, Butler–Volmer equation give rise to Tafel equa-tions of the cathodic and anodic polarizaequa-tions.
Cathodic : ln (j) = ln (j0) + −αCnF RT η (1.12) Anodic : ln (j) = ln (j0) + αAnF RT η (1.13)
The two polarization equations have the form y=b+mx, and will result in a linear plot (Tafel plot) when log(j) is plotted versus η. Considering the conversion from ln to log (ln x = 2.303 log x) the slopes of cathodic and anodic reactions in Tafel plot become:
Cathodic = 2.3R0T −αCnF (1.14) Anodic : 2.3R0T αAnF (1.15)
The exchange current density j0 is found by extrapolating the linear Tafel plot
to the log of current density at the reversible potential. In other words, j0 for
HER is the inverse log of current density at 0 V and similarly, for OER j0 is
the inverse log of current density at 1.23 V overpotential. The Tafel slope and exchange current density are used to predict the kinetics of reaction at electro-catalytic interface. As shown in the Tafel slope equations, the slope is inversely proportional to charge transfer coefficient (α), which indicates the smaller the Tafel slope, the faster the charge transfer across the electrolyte/ catalyst inter-face. In HER, the Tafel slope is typically associated with the HER mechanism at a the electrocatalytic interface. The value of Tafel slope gives an indication on the mechanism of hydrogen evolution reaction at the catalyst interface. There are two main mechanisms for HER, namely: Volmer–Heyrovsky and Volmer–Tafel mech-anisms. Usually, the first step, Volmer, involves the adsorption of hydrogen ions from electrolyte onto the electrode surface. The second step includes either the recombination of two adsorbed hydrogen atoms (Tafel step) or the direct bonding of an adsorbed hydrogen atom and a hydrated proton that includes an electron transfer (Heyrovsky step).[98] The catalysts for HER follow quite different paths in acid and alkaline mediums. The readily available protons in acidic electrolytes promotes a facile electron transfer unlike the basic medium where excess energy is required to break the water molecules. The overall reactions in acidic (Equation 1.16) and basic (Equation 1.20) along with the intermediate reactions are given below. [99]
In acidic electrolyte
2H++ 2e−→ H2 (1.16)
V olmer − step : H++ e− → Hads (1.17)
Heyrovsky − step : H++ Hads+ e−→ H2 (1.19)
In basic electrolyte
2H2O + 2e− → H2+ 2OH− (1.20)
V olmer − step(120mV dec−1) : 2H2O + 2e− → 2Hads+ 2OH− (1.21)
T af el − step(30mV dec−1) : 2Hads→ H2 (1.22)
Heyrovsky − step(40mV dec−1) : H2O + Hads+ e− → H2+ OH− (1.23)
A low Tafel slope (30 – 40 mV dec−1) designates a facile Tafel pathway, rich in electroactive sites at the catalyst interface. Given the large number of available active sites, the initial step in Tafel pathway is the adsorption of hydrogen atom onto active site and the generation of hydrogen in rate determining step. For a material to undergo Tafel pathway, the distance between two active surface sites should be less than the van der Waals radius of the two adsorbed H atoms to increase the chance of desorption. Such materials include precious metals such as platinum and phosphides of 3d transition metals.[97] Other non-precious metal-based electrocatalysts for HER (chalcogens of Fe, Co, Ni, and Mo) undergo a slightly different mechanism that includes an additional adsorption and electro-chemical release of another previously produced proton on active site.[100] This mechanism is called Volmer–Heyrovsky that results in a Tafel slope between 50 and 120 mV dec−1. This pathway is usually taken when there is a small acces-sibility to active sites. These mechanisms are valid for acidic medium, alkaline mediums require additional intermediate number of steps that involve water or
hydroxide ions. This is due to the scarcity of free protons in solution that require extra potential resulting in higher Tafel slopes.
1.3.3
Turnover Frequency (TOF)
Turn over frequency is another kinetic parameter that specifies how quickly a cat-alyst may catalyze an anticipated electrochemical reaction. The general equation for calculation of TOF is shown below.[97]
T OF = j × NA
n × F × Γ (1.24)
where j stands for the current density (Acm−2), NA is Avogadro’s num-ber (6.023Ö1023 mol−1), n is the number of electrons transferred to evolve one molecule of product (n=2 for HER, n=4 for OER), F is the Faraday constant (96485 C) and Γ is the surface concentration of active sites or number of atoms involved in the catalyst material. TOF is rarely used as a distinguishing pa-rameter to evaluate electrocatalysts for water splitting due to the difficulty in calculating the surface concentration (Γ). Usually, the mass of the loaded cata-lyst is used to determine the surface-active concentration of metal sites available assuming a 100% participation of all atoms in the catalyst together with atoms in the inner core of the catalyst. With this assumption in mind, TOF can be calculated as follows[101]
T OF = jS
2F m (1.25)
The number 2 in the equation implies two electrons per H2. S is the surface
area of electrode and m is the number of moles of the metal ions calculated from loading density.
1.3.4
Faradaic Efficiency (FE)
The faradaic efficiency of electrocatalyst indicates the selectivity of catalyst for HER processes. Faradaic efficiency is calculated by comparing experimentally measured evolved hydrogen gas to the theoretically calculated amount obtained from Faraday’s law of electrolysis. The experimental amount of gas evolved is calculated by collecting it and converting the volume obtained to moles. This is compared to the value from Faradaic law using passed charge. A 100% faradaic efficiency indicates that the electrocatalyst is highly specific to hydrogen evolu-tion with no other side reacevolu-tions. Therefore, faradaic efficiency is an essential parameter of HER electrocatalyst as in reflects the selectivity of the catalyst. It is independent of the size, shape or morphology of the catalyst. The faradaic efficiency can be theoretically estimated as follows:
F aradaic ef f iciency = nN F
Q × 100 (1.26)
Where n is the number of electrons transferred in the faradaic process, Q is total charge passed through the whole reaction (calculated from potentiometry), N is the amount of H2 generated in moles (calculated from chronoamperometry).
1.3.5
Electrochemical Active Surface area (ECSA)
ECSA represents the available active sites for an electrochemical reaction. It is a poor activity parameter which cannot be used to compare or evaluate elec-trocatalysts of different studies. This is due to the fact that the meaning of electrochemical surface area differs from one electrochemical process to another and one material to another. However, it can still be used to assess the activi-ties of similar catalysts in the same study. ECSA is commonly estimated using the double layer capacitance of the interface between electrode and electrolyte. From cyclic voltammetry studies at different scan rates in the non-faradaic re-gion, a plot of the difference in anodic and cathodic current densities (∆j=ja-jc)
against scan rate yields a linear line with double layer capacitance as the slope. Since ECSA is calculated from the non-faradaic ion adsorption and desorption processes, it would result in a poor prediction of gas evolution reactions which are faradaic processes.
1.3.6
Electrochemical impedance spectroscopy (EIS)
Electrochemical impedance spectroscopy (EIS) analysis has become a significant technique in studying the charge transfer process involved in a three-electrode system. Typically, in EIS, the steady state response of the cell to distortions by a small alternating signal is monitored by plotting electrode impedance against frequency. The behavior of an electrochemical cell can be mimicked with an electrical circuit. If we consider a resistance R and a capacitance, C in series, when a voltage (E) is applied, the sum of individual components is equal to this total voltage. This eventually leads to the following relation for real and imaginary impedance:
Z (ω) = Zreal+ iZimaginary (1.27)
The variation of impedance with frequency is present in a Bode plot (log Z vs φ) or a Nyquist plot ( Zimaginary vs Zreal ). For simplicity, Zimaginary and Zreal
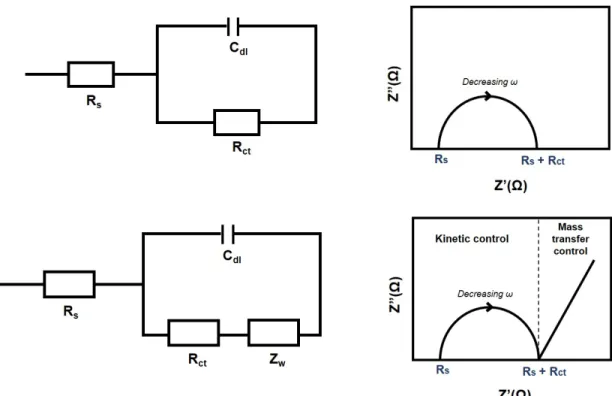
are noted with Z0 and Z00 respectively. A Randel’s circuit represents an electro-chemical cell consisting of a solution resistance Rs in series with a combination of
double layer capacitance (Cdl) and an impedance of faradic reaction represented
by charge transfer resistance element (Rct) positioned in parallel. Often a
diffu-sion element needs to be added to the total faradaic impedance of the system, this component is called a Warburg element and is presented by ZW as shown in
second row of Figure 2.[98]
In kinetically controlled reactions, the charge transfer resistance gives an in-dication of the speed of reaction. The smaller this value, the easier the charge is transferred and the faster the reaction occurs.
Figure 1.2: Randell cell’s electrical circuits (left) and their equivalent Nyquist plots (right) with and without Warburg element
1.3.7
Amount of hydrogen produced
The number of moles of hydrogen gas produced in an hour per mass of catalyst (mol/h.g) is calculated using Faraday’s law:
N umber of moles of H2(mol/hr.g) =
jt
nF m (1.28)
Where j is the current density from chronoamperometry at 3600 seconds in amperes.
1.4
Aim of study
This study focuses on the application of a nickel CB[8]-porphyrin framework functionalized on electrochemically reduced graphene oxide in electrochemical hydrogen production. The work examines the effect of implementing graphene oxide and reduced graphene oxide along with the choice of electrolyte, weight ratios of nickel acetate, ERGO/GO on the electrocatalytic activity of the com-posite. Initially, nickel porphyrin composites are investigated in acidic, basic and neutral electrolytes while varying nickel concentration. Graphene oxide synthesis is then discussed along with the procedure taken to reduce it. Accordingly, GO nickel porphyrin samples were synthesized by either mechanically adding it to Ni porphyrin (all in one ink) or by drop-casting a layer of Ni-P on top of GO layer. Later, these samples were electrochemically reduced. Here the impact of varying GO and nickel salt were separately examined. All samples were evaluated ac-cording to the electrochemical parameters aforementioned. The optimum sample was further characterized and tested in other mediums. The prepared films were characterized by X-ray photoelectron spectroscopy (XPS), scanning electron mi-croscopy (SEM), Energy dispersed X-ray (EDX), Raman spectroscopy, Fourier Transform Infrared Radiation (FT-IR) and X-ray diffractometer (XRD).
To our knowledge, this is the first study on CB-based porphyrin electroactive supramolecular assembly functionalized on ERGO for the application in elec-trocatalytic hydrogen production. In this work, nickel ions are used as metal linkers between graphene oxide and porphyrin assembly. Since graphene oxide is negatively charge due to the ionization of carboxylic acid and phenolic hydroxyl groups on their edge sand surface,[95] it develops electrostatic attraction forces to positively charged nickel porphyrin assembly as well as π-π stacking, which provide intimate contact between them.The composite can be thought of as a donor-acceptor combination where electrons from GO are accepted by porphyrin rings that are delocalized in the π conjugated structures.
Chapter 2
EXPERIMENTAL AND
INSTRUMENTATION
2.1
Materials
All reagents and solvents (purchased from Aldrich, Merck) used throughout this study were of analytical grade and used as received with no further purification unless otherwise stated. Milli-Q water (18.2 MQcm at 25 °C) was used when required. 1H NMR spectra were attained at 400 MHz, using Bruker Avance III 400 MHz NMR spectrometer. Mass spectra were recorded on Agilent 6210 LC/MS TOF mass spectrometer. Column chromatography was done using sil-ica gel which is purchased from Sigma-Aldrich high-purity grade with a 60 A° pore size and between 70 to 230 mesh or using Sephadex G-15 medium. Re-actions were examined by thin layer chromatography (TLC) using silica-coated or cellulose-coated TLC plates. Nickel source used for making the composites was Nickel acetate tetrahydrate salt (Ni(CH3CO2)2·4 H2O). All solvents used in
2.2
Synthesis
2.2.1
Synthesis of CB8-porphyrin assembly
This work utilizes the conjugation of four perhydroxy cucurbit [8] uril units to 5,10,15,20-tetrakis(4-(3-bromopropoxy) phenyl) porphyrin, as the core electro-catalyst for HER. This structure is denoted with the letter P throughout this thesis for simplicity.
2.2.1.1 Synthesis of hydroxy Cucurbit[8]uril
12.50 g of glycoluril was added to 5.54 g of paraformaldehyde in a round bottom flask and 22.5 ml of concentrated hydrochloric acid was added while stirring at room temperature. The reaction mixture was then heated in an oil bath at 95°C and stirred overnight then left aside for five days allowing crystals to grow. The solid phase composes of CB6 and CB7 while the crystalline part consists of CB6 and CB8. With further purifications, CB8 was obtained.
Cucurit[8]uril (1g) was hydroxylated using 2.92 g K2S2O8 and 1.89 g K2SO4
with deionized water. This mixture was refluxed at 85 oC for 12 h under
nitro-gen atmosphere, this was then cooled to room temperature and precipitate was removed while filterate was concentrated. The resulting white solid was dissolved in DMSO then filtered. The filterate was finally dropwise added to acetone and the precipitate of CB8(OH)n was collected and washed again with acetone.
2.2.1.2 Synthesis of TPP-4(OCH3)
The porphyrin core was synthesized by first dissolving 1.5 g of 4-methoxy ben-zaldehyde and 764 of µl pyrrole in 1.5 L CHCl3 under continuous stirring then
adding 450 µL of the Lewis acid catalyst, Et2O.BF3. After an hour of stirring, 614
and left to stirr overnight at room temperature then heated under reflux at 60oC
for an hour. The solvent was then evaporated using vacuum dryer under pressure. The resulting solid was further washed several times with chloroform while pass-ing through silica gel. The filterate was evaporated then suspended and washed several times with methanol to result in TPP-4(OC3H6Br) powder after drying.
2.2.1.3 Synthesis of TPP-4(OH)
BBr3 was added to 250 mg of TPP-4(OCH3) in 30 ml dry DCM while stirring for
an hour at 0 oC then over-weekend at room temperature. The reaction mixture
was again cooled to 0oC then quenched with 10 ml water and sodium bicarbonate
solutions to remove unreacted materials and undesired products resulting in TPP-4OH.
2.2.1.4 Synthesis of TPP-4(OC3H6Br)
The porphyrin precursor for the desired final conjugated polymer was achieved by bromination of TPP-4OH . Typically, 200 mg of TPP-4OH was stirred in 5 mL DMF and NaH under nitrogen atmosphere for half an hour then 0.418 mL 1,3-brompropane and stirred for 72 hours. The final TPP-4(OC3H6Br) product
was first washed with ice water then extracted by chloroform. The progress of the reaction was checked with ESI-MS and NMR analysis.
2.2.1.5 Synthesis of CB[8]-TPP-4(OC3H6Br)
The supramolecular assembly was synthesized by adding 300 mg of CB[8](OH)n
to 5 ml of DMSO and NaH under nitrogen atmosphere. Under stirring, 3ml of TPP-4(OC3H6Br) was poured after 30 min to the solution in DMSO then left to
stir for 72 hour. The product was added dropwise into 15 ml water, centrifuged and washed with water then finally oven-dried to obtain a black solid.
2.2.2
Synthesis of graphene oxide
Graphite oxide was prepared by improved Hummers method (Tour’s method). Typically, 3g of available graphite flakes was added to a 9:1 mixture of con-centrated H2SO4/H3PO4 (360:40 mL) under magnetic stirring. Then, 18.0 g of
potassium permanganate (KMnO4) was slowly dispensed in small portions to the
reaction mixture resulting in a slightly exothermic reaction (∼ 40oC). The reac-tion was further heated to 50oC and left to stir for 12 hours. After stirring, the mixture was left to cool to room temperature and was poured onto 400 ml of ice and 3 ml of H2O2 (30%). The resulting product is a yellowish-brown slurry
of graphite oxide and many impurities that was excessively purified and dried to give graphite oxide powder.
2.3
Experimental
2.3.1
Experimental setup
A conventional three electrode cell was used with Ag/AgCl (3.5 M KCl) as refer-ence electrode, catalyst-modified FTO as the working electrode, and Pt wire as counter electrode. All of the electrochemical experiments were performed using CHI-670 potentiostat at room temperature. The FTO surface was first cleaned with detergent, then with deionized water and isopropanol by ultrasonication for 15 minutes with each. It was then activated by drying in vacuum oven at 450oC
for 2 hours. The reaction system was purged with Argon for 30 min to remove the dissolved gases in electrolyte prior to taking measurements.
2.3.2
Sample preparation for electrochemical analysis
The samples studied in this work can be divided into three main sections: Nickel CB[8]-porphyrin, GO nickel CB[8]-porphyrin and ERGO nicke CB[8]-porphyrin.
![Figure 1.1: Structure of graphene oxide and the different methods to reduce it As shown in Figure 1.1, there are many techniques for synthesis of graphene and the reduction of graphene oxide.[42] To date various methods have been established to produce gra](https://thumb-eu.123doks.com/thumbv2/9libnet/5568784.108789/30.918.183.791.170.321/structure-graphene-different-techniques-synthesis-reduction-graphene-established.webp)
![Figure 3.1: SEM images of CB[8]-porphyrin assembly at different magnifications using 15.0 kV beam energy](https://thumb-eu.123doks.com/thumbv2/9libnet/5568784.108789/57.918.172.793.167.417/figure-images-porphyrin-assembly-different-magnifications-using-energy.webp)