Molecular Modelling and Compound Activity
of The Escherichia Coli and Staphylococcus
Aureus DNA Gyrase B ATPase Site
Acta Pharm. Sci. Vol 55 No: 1. 2017 DOI: 10.23893/1307-2080.APS.0557
Barkın Berk1,*, Gürmen Kaynar2, Merve Ertaş1, Sevde Nur Biltekin1
*Corresponding author. Tel.; +90-216-6815364 Fax: +90-212-5317555. E-mail address: [email protected] (Barkın Berk).
1 İstanbul Medipol University, School of Pharmacy, 34810, İstanbul, Turkey 2 WorldMedicine Corp., İstanbul, Turkey
ABSTRACT
Development of new treatment ligands that can distinguish Escherichia coli (E. coli) from Staphylococcus aureus (S. aureus) is important because of bacterium multiple drug resistance. High-throughput virtual screening (HTVS), docking-scoring and receiver operating characteristic curves are essential components of computational methods used in designing potential new ligands.
Here, we investigated the E. coli and S. aureus DNA gyrase B active site; ami-no acid, water molecule, and ligand interactions using crystallographic data and HTVS to determine potential hits.
Trial and test sets were prepared from the 5000 and 50000 compounds of the ZINC databases with known E. coli and S. aureus DNA gyrase B ATPase inhibitor molecules. Trial sets were evaluated and screened by determining the contribution of water molecules to interactions.
Data analysis led to the identification of novel interaction patterns, which were screened over a test set; 20 maximum scored compounds were identified and fur-ther tested against the novobiocin standard with gel-based E. coli and S. aureus supercoiling assays. The highest scoring N’-(1-naphthylcarbonyl)-2, 1, 3-benzothi-adiazole-5-carbohydrazide structure showed selective inhibition with E. coli and S. aureus DNA gyrase B ATPases.
We determined that in terms of selectivity, some water molecules have a major impact on amino acid-ligand interactions.
Keywords: HTVS, ROC curves, Docking, Escherichia coli, Staphylococcus au-reus, DNA gyrase B ATPase
INTRODUCTION
Escherichia coli (E. coli) and Staphylococcus aureus (S. aureus) are well known
gram-negative and gram-positive bacteria that are a common part of normal
hu-man flora1. When the normal balance of human flora is disrupted for example
by immune system deficiencies such as those observed with human immunode-ficiency virus (HIV), both bacteria assume opportunistic behaviour, which can subsequently lead to death2.
In clinical practice, one of the biggest problems encountered with diseases such as HIV is multi-drug resistance. Unfortunately, over the last 40 years, no new drugs (with the exception of rifampicin and rifabutin) have been introduced and traditional drug combination treatments no longer prevent drug resistance3.
Classically, with antibacterial compound design, when DNA replication or tran-scription at the cell division level is targeted, DNA gyrase enzyme and topoi-somerase IV inhibitions are the first options for gram-negative and gram-pos-itive bacteria4.
Recently, E. coli and S. aureus DNA Gyrase B X-ray crystal structures (Pdb id: 3G7E and 3G7B) and binding dynamics with the inhibitors “prop-2-yn-1-yl [[5-(4-piperidin-1-yl-2-pyridin-3-yl-1,3-thiazol-5-yl)-1H-pyrazol-3-yl]methyl] carbamate” (1a) and “methyl([5-[4-(4-hydroxypiperidin-1-yl)-2-phenyl-1,3-thi-azol-5-yl]-1H-pyrazol-3-yl]methyl) carbamate” (1b), were respectively released from the Protein Data Bank (PDB) (Figure 1)5,6.
Figure 1: Chemical structure of ligands from 3G7E (1a) and 3G7B (1b)
When both amino-acid sequences were aligned and scored by a matrix adjust-ment composition method to verify similarities (using BlastP) entire identity alignment was 100/206 (49%), and on the basis of positives 127/206 (62%) sim-ilarity.7 When the amino acids of both protein sequences are overlapped as pairs
(in the whole chain) the pairwise root-mean-square deviation (RMSD) matrix value is 1.50, and the backbone value is 1.19.
E. coli DNA Gyrase B (Pdb id: 3G7E) and compound (1a) interactions showed
that the nitrogen of the thiazole ring system is in a H bond interaction with Phe 104 and HOH 443, where one of the N atoms of the pyrazole ring system is a H
bond interaction with Ile 78, Gly 77, Thr 165, Asp 73 and HOH 408. There is a H bond bridge between the N atom of the carbamate moiety of the ligand-HOH 406 and ASP 73.
Figure 2: The active site-ligand interactions in E. coli
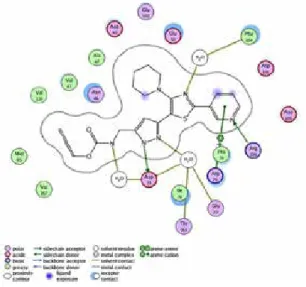
In the case of compound (1b) and the binding site of S. aureus (Pdb id: 3G7B), water molecules are dominantly active by setting boundaries to positioning such as HOH 263, which is trapped in the cavity. Furthermore, the H containing N atom of the pyrazole ring is oriented to Thr173, Gly85, Asp 81 amino acids by using a HOH 235 bridge.
Scorings from BlastP and ligand-active site interactions suggest that positioning of some water molecules especially HOH 408, 443 in E. coli and HOH 235, 263 in S. aureus DNA Gyrase B ATPase sites are essential for bridge and boundary functions, which might cause fractional differences among ligand designs for the both DNA Gyrase B’s in terms of specific selectivity.
Molecular docking and HTVS are two basic tools, which are widely used in com-puter-assisted drug design8,9. Docking software consists of two basic elements;
simulation algorithms that produce “exposure-pose” or “pose”, which determine how structures such as ligand-protein or protein-protein interact with each other and scoring algorithms made of certain mathematical functions that rank these poses9.
Usually, docking software determines poses that are responsible for the most probable interactions. However, until recently, scoring functions that were sup-posed to reflect the relationship between activity and pose were not useful, be-cause many different biological parameters, including basic solvation parame-ters cannot sufficiently be revealed by mathematical algorithms10-14. In all virtual
screening studies, test sets that consist of compounds selected from databanks are enriched, by using a cluster of compounds that have previously been experi-mentally proven to be active on the related target. When the ratio of active com-pounds in the test set is known and when the correct pose is determined, it is possible to measure statistically and numerically the quality of a hypothesis that is screening based by using methods such as receiver operating characteristic (ROC) curves15-18.
In the present study, 36 in vitro experimental active DNA Gyrase ATPase in-hibitor ligands (true positives) were added to the 5000 trial and 50000 test sets of compounds for enrichment purposes and later prepared for docking based HTVS. Subsequently, a trial set was subjected to a series of docking processes with E. Coli and S. aureus DNA Gyrase B ATPase sites. During docking process-es, several GRID files called; “restricted” or “unrestricted” were prepared either by including or excluding the previously referred to water molecules. Scoring and further evaluation of ROC curves with these files identified if the interaction pattern including or excluding water molecules can be considered as “impor-tant” or “necessary” for an inhibition process. Later, the selected GRID files were similarly experimented over the enriched test set of 50000 compounds. Finally, the top 20 scoring compounds were selected and combined and subjected to gel-based supercoiling assays of both microorganisms for inhibition measurement, hypothesis testing and hit finding.
METHODOLOGY
PDB files of the “Crystal structure of E. coli Gyrase B co-complexed with inhibi-tor” and “S. aureus Gyrase B co-complex with inhibiinhibi-tor” (PDB ID; 3G7E and 3G7B) were downloaded from RCSB Protein Data Bank (2). Preparation of protein structures, trial and test sets, GRID files, docking and scoring were per-formed using algorithms from Maestro modules (Schrodinger Inc, USA). Special “ROC Curves SVL” of MOE (Chemical Computing Group Inc., Canada) software were used during preparation of ROC curves and interaction graphics.
After screening, compounds presumed to be active were purchased from Mol-port Chemicals (Letonia) with minimum 99.5 % purity and used after checking their LC-MSMS spectral and elemental analysis results. Biological activities of compounds were assessed by E. coli and S. aureus Gyrase Supercoiling Assay Kits (Inspiralis Inc. UK- Gyrase Supercoiling Assay kits-K0003 and SAS4002) using BIO-RAD (CA, USA) gel electrophoresis and imaging systems against novobiocin (CAS; 1476-53-5, AppliChem, Germany) as a reference.
Preparation of protein structures
3G7E and 3G7B PDB files were subjected to protein preparation wizard work-flow (Maestro), for hydrogen insertion and rotamer adjustment, and H-bond optimization using OPLS 2005 as the energy parameters.
Preparation of trial and test sets
The process begins with the reduction of 1442716 compounds in the content Zinc data base of “clean-leads-subset (# 11)” (LogP values < 3.5, molecular weight < 350 and the number of rotational bonds <= 7) to 50000 randomly selected com-pounds as a test set. The trial set was evaluated by the test set with a second ran-dom selection of 5000 from this group. Later these two sets were transferred to the Lig Prep function of Maestro prepared for their tautomers and ionized forms at various pH levels (pH= 7 ± 2). Later duplicates were eliminated with an auto-matic script. Thirty-six activity proved ligands were prepared in the same man-ner and added for enrichment purposes to both sets before docking and scoring.
Preparation of grid files
Both bacterium DNA Gyrase ATPase active site GRID files were prepared using Maestro’s Glide-Receptor Grid Generation tool. Receptor binding pockets were defined by picking 6 A° surrounding of both ligands existing in each PDB file. During preparation, the original ligands were excluded and a scaling factor of 1.0 and a partial charge cut-off of 0.25 were used as parameters for the Van der Walls radius-scaling factor. For S. aureus Gyrase B active site (PDB ID; 3G7B), three different GRID files were prepared;
- Without water molecules (without restrictions/ places the compounds consid-ering the original ligand as centroid)
- With HOH 235 (with restrictions to make bond either with HOH 235 or define the position of ligand considering the position of HOH 235)
- With HOH 235 and 263 (with restrictions to make bond either with HOH 235 and /or HOH 263 or define the position of ligand considering the position of HOH 235 and 263)
- Similarly for E. coli Gyrase B (PDB ID; 3G7E), three different GRID files were prepared;
- Without water molecules (without restrictions/ places the compounds consid-ering the original ligand as centroid)
- With HOH 408 (with restrictions to make bond either with HOH 408 or define the position of ligand considering the position of HOH 408)
With HOH 408 and 443 (with restrictions to make bond either with HOH 408 and /or HOH 443 or define the position of ligand considering the position of HOH 408 and 443)
Docking and scoring
All docking experiments were performed by using Maestro’s Glide-docking tool. The basic settings for HTVS, SP and XP algorithms were set as;
- Treating receptor as rigid and ligands as flexible, - Dock without using core pattern comparison algorithm, - Use constrains from GRID files if needed,
- Write 1 000 000 poses per docking run and perform top 5 poses a post-docking minimization.
- In trial sets for both bacterium DNA Gyrase ATPase active site, HTVS algo-rithms were performed by using each GRID file stated.
With the enriched test set of S. aureus Gyrase B active site (PDB ID; 3G7B), re-stricted GRID files with HOH 235 and 263 (with restrictions to make bond either with HOH 235 and /or HOH 263 or define the position of ligand considering the position of HOH 235 and 263) was used. 50000 prepared compounds were included with their isomers and tautomers during docking with HTVS and SP algorithms whereas a cut-off of 20000 were experimented and re scored in place by XP algorithms for computational and time concerns.
For E. coli Gyrase B (PDB ID; 3G7E) active site, the enriched test set was docked by using a GRID file without water molecules (without restrictions/placing the compounds consider original ligand as centroid) and GRID HOH 408 and 443 (with restrictions to make bond either with HOH 408 and /or HOH 443 or de-fine the position of ligand considering the position of HOH 408 and 443) in
HTVS mode for detailed evaluation of trial set ROC curves. Additional dockings were accomplished with GRID HOH 408 and 443 (with restrictions to make bond either with HOH 408 and /or HOH 443 or define the position of ligand considering the position of HOH 408 and 443) in SP mode and with a cut-off of 20000 scored in place by XP modes for computational and time concerns. All dockings were ranked according to their docking score and e-model score for further evaluation of ROC curves.
ROC curve evaluation
All ranked results of docking experiments for each bacterium were transferred to the MOE software (Chemical Computing Group Inc., Canada) as SDF files and compiled as databases. Later databases were ranked according to their docking and e-model scores as active 1 and non-predicted 0 and processed with “ROC Curves SVL” using appropriate thresholds.
After assessment of the curves and poses, 20 compounds, nine of which had the highest e-model score during waters 235 and 263 included XP docking to 3G7B and 11 compounds which had highest e-model score during water 408 included XP docking to 3G7E were selected for gel based inhibition assay against standard novobiocin.
Biological evaluation
All 20 compounds were tested with the “Gel Based inhibition Assay” at 1mg/20, 50, 100 µL. concentrations both in S. aureus (for 3G7B) and E. coli (for 3G7E) with novobiocin standard for comparison purposes.
DNA gyrase supercoiling assays were performed with a Gyrase Supercoiling As-say Kit (Inspiralis) according to the manufacturer’s instructions and analysed by monitoring the conversion of relaxed pBR322 plasmid to its supercoiled form using DNA gel electrophoresis. Essentially, 1 U of either E. coli or S. aureus DNA gyrase was first diluted in 5×gyrase buffer and incubated in an assay buffer (35 mM Tris HCl (pH 7.5), 24 mM KCl, 4 mM MgCl 2, 2 mM DTT, 1.8 mM sper-midine, 1 mM ATP, 6.5% (w/v) glycerol, and 0.1 mg/mL BSA), with 0.5 µg of
pBR322 plasmid and purchase twenty compound dilutions at 37 ◦C for 30 min.
Reactions were stopped with the addition of stop dye (40% sucrose, 100 mM Tris HCl (pH 7.5), 1 mM EDTA, and 0.5 mg/mL bromophenol blue) and loaded onto TAE agarose gel (1%). Gels were visualized using a gel documentation system (Bio-Rad ChemiDoc). Since high levels of DMSO are known to affect DNA gyrase activity, titration was used to determine the minimum amount of DMSO to be used in the assays, and 5% DMSO (with negligible or no effect on the gyrase) was chosen to dilute the compounds19.
RESULTS AND DISCUSSION
The trial set (randomly selected 5000 compounds) and the test set (randomly selected 50000 compounds) both enriched with 36 active ligands, were docked to S. aureus Gyrase B (PDB ID: 3G7B) and E. coli Gyrase B (PDB ID: 3G7E) ATP binding sites by using Glide-docking HTVS, SP, XP protocols (as detailed in methodology section ).
During docking processes the novobiocin structure was bound to its original
po-sition with an RMSD range of 0.83-0.94 A°. This revealed similar interactions
with original crystallographic data in both cases.
A weakness of a docking program is its scoring functions. In this study we used maximum docking and e-model scores for ROC curves to evaluate accuracy powers in discriminating interaction patterns. ROC curves used in these experi-ments are plots of the true positive rate (sensitivity) against the false positive rate (1-specificity) for the different possible cut points. They show the trade-off between sensitivity and specificity where any increase in sensitivity will be ac-companied by a decrease in specificity. The closer any curve follows the left-hand border and then the top border of the ROC space, the higher the accuracy. The accuracy of our tests depends on how the groups being tested are separated into those with and without experimental activity. Accuracy is measured by the area under the ROC curve. An area of 1 represents a perfect test; an area of 0.5 repre-sents a poor test during evaluation.
Trial set docking, scoring and ROC curves evaluation
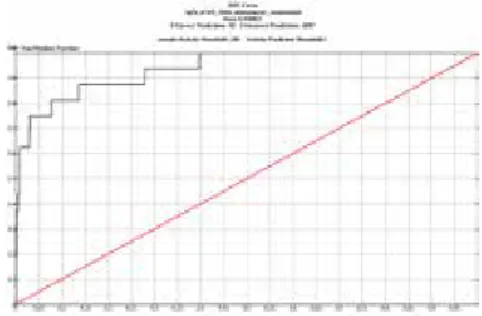
The ROC curves of HTVS dockings for the S. aureus Gyrase B (PDB ID: 3G7B) trial set without water molecules, with HOH 235, with HOH 235 and HOH 263 are shown in Figure 4.
The highest AUC score obtained from all dockings of the trial set using the HTVS protocol was the one scored/ranked according to an e-model score with bond restrictions, either with HOH 235 and/or HOH 263 or those, which defined li-gand position considering the position of HOH 235 and 263. Results paralleled our expectations, as ligand 1b also used these water molecules in interacting with the active site. In general e-model score reflected solvation parameters more ac-curately compared to maximum docking score (Table 1). GRID files with bond restrictions either with HOH 235 and /or HOH 263 or those that defined the position of ligand considering the position of HOH 235 and 263 were selected and used for SP and XP dockings.
3G7B docked without waters, selected and
ranked according to maximum docking score 3G7B docked without waters, selected and ranked according to maximum e-model score
3G7B docked with water 235, selected and
ranked according to maximum docking score 3G7B docked with water 235, selected and ranked according to maximum e-model score
3G7B docked with waters 235 and 263, selected and ranked according to maximum docking score
3G7B docked with waters 235 and 263, selected and ranked according to maximum e-model score
Figure 4: ROC curves of trial set docked to S. aureus Gyrase B (PDB ID: 3G7B) ATP binding site by using HTVS protocol with different GRID files
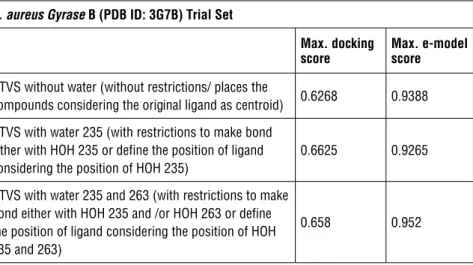
Table 1: AUC scores of S. aureus Gyrase B (PDB ID: 3G7B) trial Set with different GRID files and scoring functions
S. aureus Gyrase B (PDB ID: 3G7B) Trial Set
Max. docking
score Max. e-model score HTVS without water (without restrictions/ places the
compounds considering the original ligand as centroid) 0.6268 0.9388 HTVS with water 235 (with restrictions to make bond
either with HOH 235 or define the position of ligand considering the position of HOH 235)
0.6625 0.9265
HTVS with water 235 and 263 (with restrictions to make bond either with HOH 235 and /or HOH 263 or define the position of ligand considering the position of HOH 235 and 263)
0.658 0.952
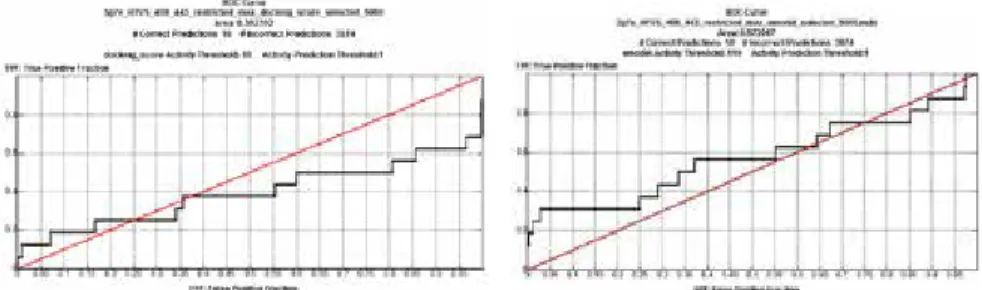
The ROC curves for HTVS docking of the E. coli Gyrase B (PDB ID: 3G7E) trial set without water, with HOH 408, with HOH 408 and HOH 443 are combined in Figure 5.
3G7E docked without waters, selected and
ranked according to maximum docking score 3G7E docked without waters, selected and ranked according to maximum e-model score
3G7E docked with water 408, selected and
Conflicting and poor AUC results led to repeat test set experiments. From the ligand 1a-binding site interactions it seemed that at least HOH 408 was used by ligand 1a for the H-bond bridging purposes with active site amino acids Ile 78, Gly 77, Thr 165 and Asp 73. Therefore, in further experiments, we used GRID files without water molecules (without restrictions/ places the compounds con-sidering the original ligand as centroid) and with HOH 408 (with restrictions to make bond either with HOH 408 or define the position of ligand considering the position of HOH 408) to dock the test set of E. coli Gyrase B (PDB ID: 3G7E) ATP binding sites by using Glide-docking HTVS, SP, XP protocols. AUC scores of E. coli Gyrase B (PDB ID: 3G7E) trial set with different GRID files and scoring functions are detailed in Table 2.
Table 2: AUC scores of E. coli Gyrase B (PDB ID: 3G7E) trial set with different GRID files and scoring functions
E. coli Gyrase B (PDB ID: 3G7E) Trial Set
Max. docking
score Max. e-model score HTVS without water (without restrictions/ places the
compounds considering the original ligand as centroid) 0.4974 0.6585 HTVS with water 408 (with restrictions to make bond
either with HOH 408 or define the position of ligand considering the position of HOH 408)
0.6257 0.5922
HTVS with water 408 and 443 (with restrictions to make bond either with HOH 408 and /or HOH 443 or define the position of ligand considering the position of HOH 408 and 443)
0.3923 0.572
3G7E docked with waters 408 and 443, selected
and ranked according to maximum docking score 3G7E docked with waters 408 and 443, selected and ranked according to maximum e-model score
Figure 5: ROC curves of trial set docked to E. coli Gyrase B (PDB ID: 3G7E) ATP binding site by using HTVS protocol with different GRID files
Test set docking, scoring and ROC curves evaluation
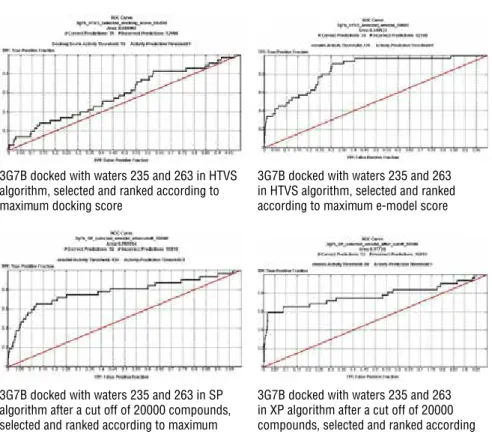
The test set evaluations for S. aureus Gyrase B (PDB ID: 3G7B), GRID file with water 235 and 263 (with restrictions to make bond either with HOH 235 and /or HOH 263 or define the position of ligand considering the position of HOH 235 and 263) was used. ROC curves were produced both with rankings according to HTVS, using maximum docking and e-model scores then SP and XP protocols were run only based on e-model scoring functions with a cut-off of maximum scoring 20000 compounds. (Figure 6).
An AUC value decrease was an expected outcome while changing sets from tri-al to test set as the number of compounds increased ten times. Also changing the docking algorithm from HTVS to more complex parametric SP and XP al-gorithms contribute to this outcome. However, results were still promising for selection of active ligands with e-model scoring functions (Table 3).
3G7B docked with waters 235 and 263 in HTVS algorithm, selected and ranked according to maximum docking score
3G7B docked with waters 235 and 263 in HTVS algorithm, selected and ranked according to maximum e-model score
3G7B docked with waters 235 and 263 in SP algorithm after a cut off of 20000 compounds, selected and ranked according to maximum e-model score
3G7B docked with waters 235 and 263 in XP algorithm after a cut off of 20000 compounds, selected and ranked according to maximum e-model score
Figure 6: ROC curves of test set docked to S. aureus Gyrase B (PDB ID: 3G7B) ATP binding site by using HTVS, SP and XP protocols with HOH 235 and 263 (with restrictions to make bond either with HOH 235 and /or HOH 263 or define the position of ligand considering the position of HOH 235 and 263) GRID file
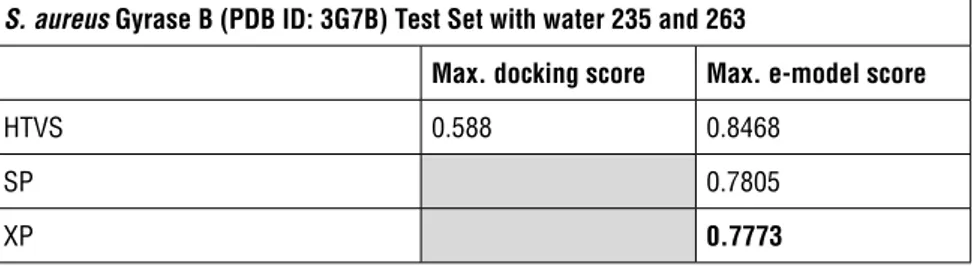
Table 3: AUC scores of S. aureus Gyrase B (PDB ID: 3G7B) test set with different docking algorithms and scoring functions
S. aureus Gyrase B (PDB ID: 3G7B) Test Set with water 235 and 263
Max. docking score Max. e-model score
HTVS 0.588 0.8468
SP 0.7805
XP 0.7773
In trial and test set HTVS experiments of S. aureus (PDB ID: 3G7B), with HOH 235 and 263 there was a high AUC result of 0.952 and 0.8468, respectively in the e-model score ROC curve evaluation, which means that ligands that bind to these sites has to make an H-bond with HOH 235 and must bind a space that is restricted to these waters. All results for S. aureus (PDB ID: 3G7B) were very consistent with an average 30% difference between the docking score and e-model score, which means the ROC curves separate the true positives with very high frequency if the e-model scores were taken as a base. For further SP algorithm analysis the test set of 50000 compounds were assessed for at least 10 poses in the active site. An evaluation score by XP mode dockings with a cut-off of 20000 compounds was preferred to reduce computational load and time. Given results with the trial set of E. coli Gyrase B (PDB ID: 3G7E) were contra-dictory, we ran HTVS of the test set with/without water (without restrictions/ placing the compounds considered original ligand as centroid) and with HOH 408 (with restrictions to make bond either with HOH 408 or define the position of ligand considering the position of HOH 408) GRID files were again used to see if results were affected by the random selected compounds of the trial set. The results were then evaluated for both scoring algorithms for judgment and decision making with SP and XP algorithms. (Figure 7 and table 4).
3G7E docked without waters, using HTVS algorithm, selected and ranked according to maximum docking score
3G7E docked without waters, using HTVS algorithm, selected and ranked according to maximum e-model score
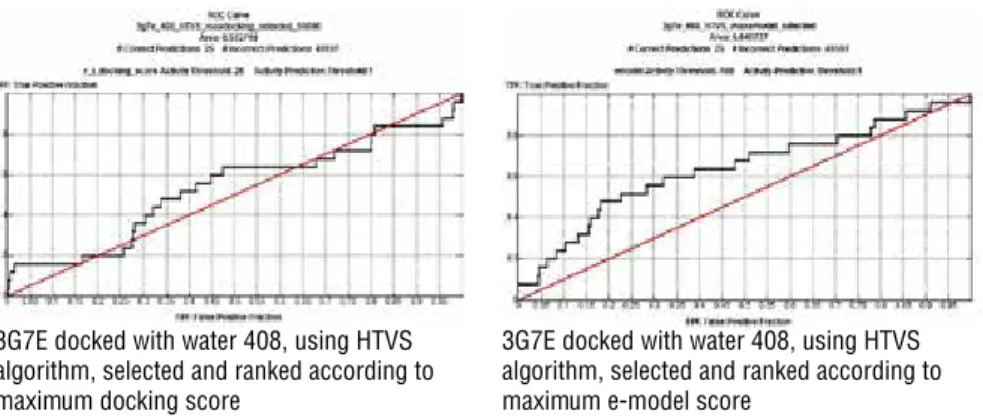
The results for HOH 408 GRID file scoring with the e-model were consistent with previous experiments and algorithm logic. This file was used for further SP and re-scoring XP docking experiments were performed under the same condi-tions previously described for time and computational concerns. (Figure 8)
In all HTVS experiments that were run according to these GRID files, the e-mod-el score process separated true from false positives more successfully than when compared to docking scores, except for E. coli’s with the HOH 408 GRID file where the docking score had an AUC of 0.6257.
E. coli’s unrestricted file scored better with HOH 408 and with HOH 408 and
443 files in general. This is of interest as e-model score algorithms are designed in such a manner for reflecting solvation parameters perfectly to docking score by calculating the positions of the incidental waters.
3G7E docked with water 408, using HTVS algorithm, selected and ranked according to maximum docking score
3G7E docked with water 408, using HTVS algorithm, selected and ranked according to maximum e-model score
Figure 7: ROC curves of test set docked to E. coli Gyrase B (PDB ID: 3G7E) ATP binding site by using HTVS protocol with without waters and with water 408 GRID files.
3G7E docked with water 408 in SP algorithm, selected and ranked according to maximum e-model score
3G7E docked with water 408 in XP algorithm after a cut off of 20000 compounds, selected and ranked according to maximum e-model score
Figure 8: ROC curves of test set docked to E. coli Gyrase B (PDB ID: 3G7E) ATP
Random compound selection in the trial set may have been the reason for this unpredicted result. We therefore repeated HTVS dockings of the test set with higher scoring, unrestricted and with HOH 408 GRID files. A number increase from 5000 to 50000 resulted in inconsistency disappearance and the e-model score of HOH 408 GRID file AUC was 0.6407. Further SP and XP simulations for E. coli by using this file were warranted.
During these processes, although ROC AUCs decreased from HTVS to XP algo-rithms gradually, a combination of the top 20 scoring compounds in the context of each set were selected for in-vitro E. coli and S. aureus DNA Gyrase gel based supercoiling assay against, novobiocin standard.
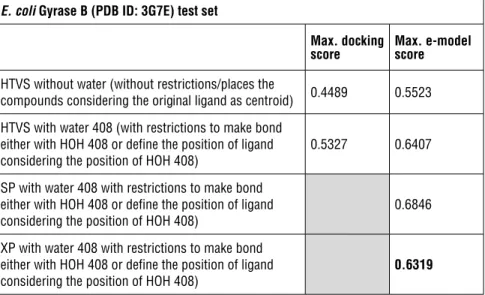
Table 4: AUC scores of E. coli Gyrase B (PDB ID: 3G7E) test set with different GRID files and scoring functions
E. coli Gyrase B (PDB ID: 3G7E) test set
Max. docking
score Max. e-model score HTVS without water (without restrictions/places the
compounds considering the original ligand as centroid) 0.4489 0.5523 HTVS with water 408 (with restrictions to make bond
either with HOH 408 or define the position of ligand considering the position of HOH 408)
0.5327 0.6407
SP with water 408 with restrictions to make bond either with HOH 408 or define the position of ligand
considering the position of HOH 408) 0.6846
XP with water 408 with restrictions to make bond either with HOH 408 or define the position of ligand
considering the position of HOH 408) 0.6319
High scoring compounds of S. aureus and E. coli test sets selected with XP algo-rithms with HOH 235 and 263 and with HOH 408 GRID files for further super-coiling assays are listed in descending order in Tables 5 and 6.
Biological activity
After screening, 11 compounds from the E. coli test set, and nine compounds from the S. aureus were tested against standard novobiocin using E. coli and
S. aureus Gyrase Supercoiling Assay Kits (Inspiralis). All compounds were
ap-plied in a range of 1 mg/20µL, 1 mg/50µL and1 mg/100µL (w/v) dilutions to gel electrophoresis according to instructions of manufacturer. Post run staining was completed using ethidium bromide solution. All results are combined in Figures
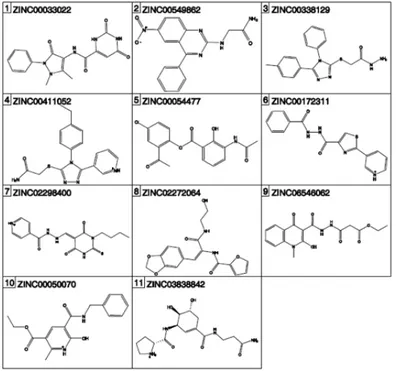
9 -14. The first nine compounds (S. aureus 1-9 test set) followed by the next 11 (E. coli 1-11). All numbering and structures are matched with Tables 5 and 6 and are aligned with descending order maximum e-model scores.
Table 5: Compounds which received highest e-model score during waters 235 and 263 included XP docking to 3G7B and selected for “Gel Based Supercoiling Assay”
Table 6: Compounds which received highest e-model score during water 408 included XP docking to 3G7E and selected for “Gel Based Supercoiling Assay”
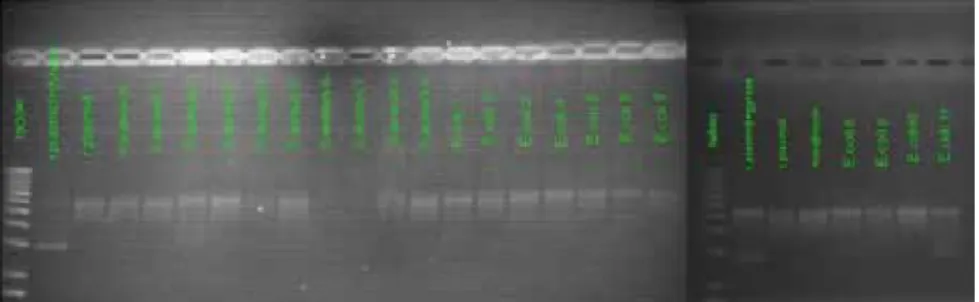
Figure 9: 1 mg/20µL (w/v) dilusion E. coli DNA Gyrase gel electrophoresis results, super-coiled (r. plasmid+gyrase), relaxed (r. plasmid), novobiocin (r. plasmid+gyrase+novobiocin)
Figure 10: 1 mg/50µL (w/v) dilusion E. coli DNA Gyrase gel electrophoresis results, super-coiled (r. plasmid+gyrase), relaxed (r. plasmid), novobiocin (r. plasmid+gyrase+novobiocin)
Figure 11: 1 mg/100µL (w/v) dilusion E. coli DNA Gyrase gel electrophoresis results, super-coiled (r. plasmid+gyrase), relaxed (r. plasmid), novobiocin (r. plasmid+gyrase+novobiocin)
Figure 12: 1 mg/20µL (w/v) dilusion S. aureus DNA Gyrase gel electrophoresis results, super-coiled (r. plasmid+gyrase), relaxed (r. plasmid), novobiocin (r. plasmid+gyrase+novobiocin)
Figure 13: 1 mg/50µL (w/v) dilusion S. aureus DNA Gyrase gel electrophoresis results, super-coiled (r. plasmid+gyrase), relaxed (r. plasmid), novobiocin (r. plasmid+gyrase+novobiocin)
Figure 14: 1 mg/100µL (w/v) dilusion S. aureus DNA Gyrase gel electrophoresis results, super-coiled (r. plasmid+gyrase), relaxed (r. plasmid), novobiocin
(r. plasmid+gyrase+novobiocin)
Eleven compounds from the test set of E. coli, except compound 7 at a 1/20 mg/ µL. dilution, showed no activity over E. coli DNA gyrase supercoiling whereas compounds 2, 5, 7 and 10 showed promising inhibitory activity in a S. aureus DNA gyrase supercoiling assay.
In contrast, except for compound 2 and 3 of S. aureus of the test set all com-pounds in all concentrations showed remarkable activity in S. aureus DNA gy-rase supercoiling assay. Compound 4 and 7 showed a moderate activity in E. coli DNA gyrase supercoiling.
Table 7 shows detailed activities for compounds in E. coli and S. aureus DNA Gyrase supercoiling assays.
Aside from the highest scoring compounds; 1 and 5 from the S. aureus test set, E.
coli test set compounds 2, 5, and 10 selectively inhibited S. aureus DNA Gyrase
supercoiling without effecting E. coli.
In vitro results are of interest because they show that the ROC curve evaluation
was efficient and consistent for either separating actives from inactivity or deter-mining the type of interaction. In addition, the evaluation results of at least 90%
or more were processed for further testing.
Water molecules not only have an important impact on positioning but contrib-ute to ligand selectivity by inhibiting the DNA Gyrase ATPase binding site.
CONCLUSION
Multiple drug resistance is an important and major issue in immune deficiency cases. Normally simple and common human flora bacterium, such as E. coli and
S. aureus, can cause serious complications during treatment. In this study, with
the help of X-ray crystallographic structures of E. coli and S. aureus DNA gyrase B, we attempted to combine the use of ROC curves with docking-scoring algo-rithms to verify the role of water molecules over ligand-active site interactions for identifying selective target structures.
Table 7: Zinc codes and activities of selected compounds during E. coli and S. aureus DNA Gyrase supercoiling assays in different concentrations
E. coli Supercoiling Assay S. aureus Supercoiling Assay Compound No Zinc Code 1/20 1/50 1/100 1/20 1/50 1/100
S. aureus 1 ZINC00155744 - - - + + + 2 ZINC00368254 - - - -3 ZINC00610552 - - - -4 ZINC03067000 + + - + + + 5 ZINC00029706 - - - + + -6 ZINC00441071 + - - + + + 7 ZINC05286123 + + - + + + 8 ZINC00055814 + - - + + -9 ZINC00054801 + - - + + + E. coli 1 ZINC00033022 - - - -2 ZINC00549862 - - - + + + 3 ZINC00338129 - - - -4 ZINC00411052 - - - -5 ZINC00054477 - - - + + + 6 ZINC00172311 - - - + - -7 ZINC02298400 + - - + + + 8 ZINC02272064 - - - -9 ZINC06546062 - - - + - -10 ZINC00050070 - - - + + + 11 ZINC03838842 - - - - -
-Our study results show that water molecules HOH 235 and 263 in the S. aureus DNA gyrase B active site play a crucial role during ligand active site interactions. This must be taken into consideration in molecular modeling studies of S.
au-reus DNA gyrase B because 8/9 ligands showed activity during the gel based
inhibition assay and ROC curve AUC scores were high.
ROC curves successfully determined true positives from false positives during docking-scoring studies, if AUC scores were greater than 0.70.
In gel-based gyrase assays and docking studies, the maximum e-model scores of the N’-(1-naphthylcarbonyl)-2, 1, 3-benzothiadiazole-5-carbohydrazide struc-ture was validated as having selective activity at all concentrations tested. Further study of these selective ligands and additional extensive review of bind-ing modes with other water molecules warrants future study. Studies to synthe-size more effective derivatives using other facilitating computational tools such as molecular interaction are warranted.
REFERENCES
1. Ryan KJ, Ray CG, Sherris JC. Sherris Medical Microbiology. 5th ed. New York: McGraw Hill Medical; 2010 xiv, pp. 1026.
2. Kayser FH. Medical Microbiology. Stuttgart ; New York, NY: Georg Thieme Verlag; 2005 xxvi, pp.698.
3. Tomioka, H.; Namba, K. Rifampin and Their Analogs: A Development of Antitubercular Drugs. Kekkaku 2006, 81, 753-774.
4. Lewis, R.J.; Tsai, F.T.; Wigley D.B. Molecular Mechanisms of Drug Inhibition of DNA Gyrase.
Bioessays 1996, 18, 661-671.
5. Ronkin, S.M.; Badia, M.; Bellon, S.; Grillot, A.L.; Gross, C.H.; Grossman, T.H. et al. Discovery of Pyrazolthiazoles As Novel And Potent Inhibitors of Bacterial Gyrase. Bioorg. Med. Chem.
Lett. 2010, 20, 2828-2831.
6. Berman, H.M.; Westbrook, J.; Feng, Z.; Gilliland, G.; Bhat, T.N.; Weissig, H. et al. The Protein Data Bank. Nucleic Acids Res. 2000, 28, 235-242.
7. Altschul, S.F.; Wootton, J.C.; Gertz, E.M.; Agarwala, R.; Morgulis, A.; Schaffer, A.A. et al. Pro-tein Database Searches Using Compositionally Adjusted Substitution Matrices. FEBS J. 2005,
272, 5101-5109.
8. Lengauer, T.; Rarey, M. Computational Methods For Biomolecular Docking. Curr. Opin.
Struct. Biol. 1996, 6, 402-406.
9. Alvarez J, Shoichet B. Virtual screening in drug discovery. Boca Raton: Taylor & Francis; 2005, pp. 470.
10. Rester, U. From Virtuality to Reality - Virtual Screening in Lead Discovery and Lead Optimi-zation: A Medicinal Chemistry Perspective. Curr. Opin. Drug Discov. Devel. 2008, 11, 559-568. 11. McInnes, C. Virtual Screening Strategies in Drug Discovery. Curr. Opin. Chem. Biol. 2007,
12. Willett, P. From Chemical Documentation to Chemoinformatics: 50 Years of Chemical In-formation Science. J. Inf. Sci. 2008, 34, 477-499.
13. Kromer, R.T. Structure-Based Drug Design: Docking and Scoring. Curr. Protein Pept. Sci. 2007, 8, 312-328.
14. Cavasotto, C.N.; Orry, A.J. Ligand Docking and Structure-based Virtual Screening in Drug Discovery Curr. Top. Med. Chem. 2007, 7, 1006-1014.
15. Triballeau, N.; Acher, F.; Brabet, I.; Pin, J.P.; Bertrand, H.O. Virtual Screening Workflow Development Guided by the “Receiver Operating Characteristic” Curve Approach. Application to High-Throughput Docking on Metabotropic Glutamate Receptor Subtype 4. J. Med. Chem. 2005, 48, 2534-2547.
16. Rizzi, A.; Fioni, A. Virtual Screening Using PLS Discriminant Analysis and ROC Curve Ap-proach: An Application Study on PDE4 Inhibitors. J. Chem. Inf. Model. 2008, 48, 1686-1692. 17. Langer, T.; Hoffmann, R.; Bryant, S.; Lesur, B. Hit Finding: Towards ‘Smarter’ Approaches.
Curr. Opin. Pharmacol. 2009, 9, 589-593.
18. Jacoby, E.; Schuffenhauer, A.; Popov, M.; Azzaoui, K.; Havill, B.; Schopfer, U. et al. Key Aspects of The Novartis Compound Collection Enhancement Project for The Compilation of A Comprehensive Chemogenomics Drug Discovery Screening Collection. Curr. Top. Med. Chem. 2005, 5, 397-411.
19. Maxwell, A.; Burton, N.P.; O’Hagan, N. High-Throughput Assays for DNA Gyrase and Other Topoisomerases. Nucleic Acids Res. 2006, 34, e104.