i··.
İ A İ Z i ' . " - - · ; ' :
ı-j.î^'^Hhys
< 4 « β ·
S4/S-A CS4/S-ASE STUDY: MES4/S-ASURING SERVICE
QUALITY OF A PRIVATE HOSPITAL
USING SERVQUAL METHOD
A THESIS
Submitted to the Faculty of Management
and the Graduate School of Business Administration
of Bilkent University
in Partial Fulfillment of the Requirements
For the Degree of
Master of Business Administration
By
Sibel Bostancı
June, 1995
5415
.r ^ ·
q C| c
Ov^’ O
1 c e r tif y t h a t I h a v e re a d th is th e s is a n d it is fu lly a d e q u a te , in s c o p e a n d in q u a lity , as a th e s is f o r th e d e g r e e o f M a s te r o f B u s in e s s
A d m in is tr a tio n . . . L
A ssist. P ro f. S e lç u k K a ra b a ti
1 c e r tify th a t I h a v e re a d th is th e sis an d it is fu lly a d e q u a te , in s c o p e a n d in q u a lity , as a th e sis f o r th e d e g re e o f M a s te r o f B u sin e s s A d m in is tra tio n . A ssist. P ro f. S e rp il S ay ın I c e rtify th a t I h a v e re a d th is th e s is a n d it is fu lly a d e q u a te , in s c o p e an d in q u a lity , as a th e s is f o r th e d e g re e o f M a s te r o f B u sin e s s A d m in is tra tio n . A ssist. P ro f. M u ra t M e rc a n
A p p ro v e d f o r th e G r a d u a te S c h o o l o f B u sin e s s A d m in is tra tio n .
y /___ ^
P ro f D r/âübidey Togay
M
ABSTRACT
A CASE STUDY: MEASURING SERVICE QUALITY OF A PRIVATE HOSPITAL
BY USING SERVQUAL METHOD
SİBEL BOSTANCI M.B.A. Thesis
Supervisor; Assist. Prof. Dr. Selçuk Karabati
For a long time definitions o f quality mostly referred to the manufacturing world, not the service sector. However, today more and more leaders o f service organizations are discovering that quality is a critical issue for services too. They are aware that improving service in the eyes o f customers is what pays. On the other hand the measurement o f service quality has been an elusive concept.
In this study Servqual method is used to measure the level o f service quality o f a private hospital. Servqual is a framework for understanding service quality, measuring it and diagnosing service quality problems. In fact what Servqual says is that service quality is measurable and can be improved. In this respect it is a valuable tool for service sector.
ÖZET
SERVQUAL METODUNU KULLANARAK ÖZEL BİR HASTANENİN SERVİS
KALİTESİNİN ÖLÇÜMÜ
SİBEL BOSTANCI M B A. Tezi
Tez Yöneticisi; Yard. Doç. Dr. Selçuk Karabatı
Kalite kavramı uzun süre hizmet sektöründen ziyade üretim sektörüyle özdeşleştirilerek kullanıldı. Günümüzde ise, hizmet sektöründe gün geçtikçe daha fazla yönetici kalitenin ne denli önemli olduğunun farkına vanyor. Artık, müşterinin gözünde kaliteyi geliştirmenin avantajlanmn bilincindeler. Diğer taraftan hizmet kalitesinin ölçülebilirliği de halen tartışılan bir konu.
Bu çalışmada Servqual metodu özel bir hastanenin servis kalitesini ölçmek için kullanıldı. Servqual hizmet kalitesini anlamak ve ölçmek ve hizmet kalite problemlerini tanımlamak için hazırlanmış bir metod. Kısaca Servqual bize hizmet kalitesinin ölçülebilir ve iyileştirilebilir bir kavram olduğunu söylüyor. Bu çerçevede, Servqual hizmet sektörü için çok değerli bir araç olarak görülmektedir.
TABLE OF CONTENTS
A B STR A C T... i
O Z E T ... ii
TABLE OF CO N TEN TS... iii
LIST OF FIG U R E S ... v
LIST OF TABLES... vi
I. INTRODUCTION AND PROBLEM DEFINITION... 1
II. LITERATURE R EV IE W ... 4
II. 1. Three Perspectives On Quality... 11
II. 1. 1. Definitions O f Service Quality... 13
II. 2. Quality Management Models Used In Service Sector... 16
II. 2. 1. Total Performance M anagem ent... 16
II. 2. 2. Total Quality M anagement...18
II. 2. 3. Customer W indow...19
III. IMPORTANCE OF SERVICE Q U A L IT Y ... 21
IV. THE CHALLENGE OF DIFFERENTIATING HEALTH-SERVICES THROUGH QUALITY... 24
VI. ABOUT THE HOSPITAL UNDER STU DY ...27
V. SERVQUAL- A NEW APPROACH TO SERVICE QUALITY... 32
V. 1. Identifying The Causes o f Service Quality Shortfalls... 38
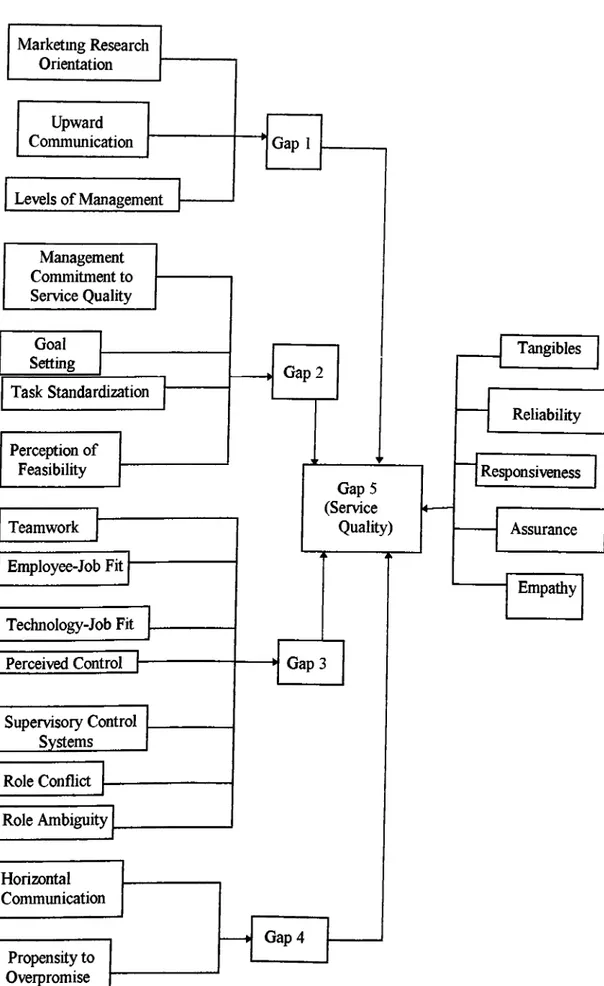
V. 2. Complete Picture o f G a p s ... 47
V. 3. Additional Points About Servqual Applications...49
VI. M ETH O D O LO G Y ...52
VI. 1. Sam ple...52
VI. 2. Main Study...53
VI. 3. Questionnaire Design...54
VIII. DISCUSSIONS OF THE RESULTS... 59
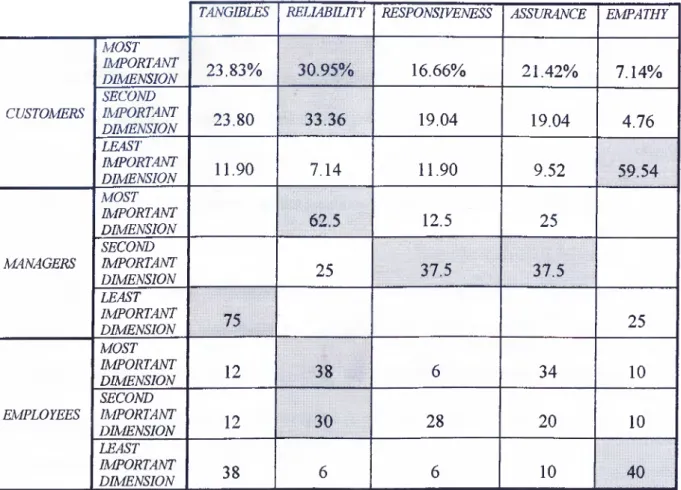
VIII. 1. Importance o f Each Dimension for Customers o f the Hospital...59
VIII. 2. Results o f Gap 5 ... 61
VIII. 3. Results o f Gap 1 Through Gap 4 ...63
VIII. 4. Antecedents o f Gap 1 Through Gap 4 ...71
IX. SUMMARY AND CO N C LU SIO N S... 77
R EFER EN C ES... 80
APPENDIX A - QUESTIONNAIRE FOR PA T IE N T S... 83
APPENDIX B - QUESTIONNAIRE FOR MANAGERS... 89
APPENDIX C - QUESTIONNAIRE FOR CONTACT PERSONNEL... 98
APPENDIX D - SOME INFORMATION ABOUT THE TQM STUDY OF THE H O SPITA L...108
LIST OF FIGURES
Figure 1: The Customer Window M o d el...20
Figure 2: Findings O f Focus Group Interview s... 35
Figure 3: Correspondence Between SERVQUAL Dimensions And Original Ten Dimensions For Evaluating Service Q uality...37
Figure 4: Key Factors Contributing To Gap 5 ... 39
Figure 5: Key Factors Contributing To Gap 1... 40
Figure 6: Key Factors Contributing To Gap 2 ... 41
Figure 7: Key Factors Contributing To Gap 3 ... 44
Figure 8: Key Factors Contributing To Gap 4 ... 46
Figure 9: Conceptual Model O f Service Quality... 47
Figure 10; The Extended Gaps Model O f Service Quality...48
Figure 11: Unweighted Servqual Scores by Service Dimension...62
Figure 12: Gap 1 Scores by D im ensions... 65
Figure 13: Comparison o f Overall Gap 2 Scores for Managers and Em ployees. . 66
Figure 14: Graph Showing Opportunities for Improving Gap 3 ...68
Table 1 Results o f quality multiplier for the hospital... 31
Table 2 Importance o f each dimension for customers, managers and employees...60
Table 3 Servqual sco res... 62
Table 4 Segmented Gap 5 Scores... 63
Table 5 Gap 1 Scores... 65
Table 6 Gap 2 Scores... 66
Table 7 Gap 3 sco res... 67
Table 8 Gap 4 Scores... 69
Table 9 Antecedents o f Gap 1... 71
Table 10 Antecedents o f Gap 2 ... 72
Table 11 Antecedents o f Gap 3 ... 74
Table 12 Antecedents o f Gap 4 ...76
LIST OF TABLES
I. EVTRODUCTION AND PROBLEM DEFINITION
Evidence in both the manufacturing and the service industries indicates that quality is a key determinant o f market share and return on investment as well as cost reduction (Babakus & Mangold, 1992).
For a long time, definitions o f quality mostly referred to the manufacturing world, not the service sector. The idea also spread into the service industry as the understanding o f quahty among manufacturing firms evolved.
M odern methods o f quality assurance were developed and refined mostly in manufacturing industries. The introduction and adoption o f quality assurance programs in service industries has lagged behind manufacturing.
Even though the manufacturing quality assurance framework can be used in service industries they do not fit very well. Services are different and the manufacturing quality assurance systems does not address certain characteristics o f services (Congram, 1993).
The conceptualization and measurement o f service quality has been an elusive concept primarily because o f service intangibility, the problems associated with simultaneous production and receipt o f a service, and the difference between
mechanistic and humanistic quality. In 1984, Parasuraman, Zeithaml, and Berry made a substantial contribution to the understanding o f the concept o f service quality and the factors that influence it by identifying four “gaps’ occurring in organizations that can cause quality problems. These quality problems cause a fifth gap, which is the difference between customer expectations o f service and perceptions o f the service actually received. The authors defined this difference as service quality and the instrument to measure service quality as SERVQUAL (J. M. Carman, 1990)
The SERVQUAL scale was developed based on a marketing perspective with the support o f the Marketing Science Institute (Parasuraman, Zeithaml, and Berry 1986). Its purpose was to provide an instrument for measuring service quality that would apply across a broad range o f services with minor modifications in the scale (Babakus and Mangold 1992).
Defining and measuring the quality has also been a major challenge for health care marketers. While SERVQUAL has been tested in a number o f service settings, its applicability and reliability to the hospital environments remained unknown until the study o f Babakus and Mangold. At the end o f their study they found that SERVQUAL is reliable and valid in the hospital environment and in a variety o f other service industries. They pointed out that, one o f SERVQUAL’s major contributions to the health care industry will be its ability to identify symptoms and provide a starting point for the examination o f underlying problems that inhibit the provision o f quality services (Babakus and Mangold 1992).
The measurement o f patient expectations as well as perceptions provides a valuable dimension o f insight into the process by which the quahty o f health care service is evaluated. Administrators should understand the areas in which expectations are particularly high so that the service delivery process can be tailored to meet those expectations (PZB 1985). Similarly, in order to identify and correct service quality problems quickly, administrators should understand patients’ perceptions o f the quality o f service delivered and the manner in which expectations and perceptions are balanced.
In this study SERVQUAL method is used to measure the level o f service quality o f a private hospital. The aim is to use SERVQUAL as a part o f a case study not to search its relevance.
II. LITERATURE REVIEW
Quality is not a value judgment. However, stating what it is not does not define what it is. In an article in the Fall 1984 Sloan Management Review, David Garvin identifies five major approaches to the definition o f quality (Garvin, 1984).
1- ITie transcendent or philosophic approach: quality is “innate excellence,” which, like beauty, can be understood only through exposure to objects that display its characteristics.
2- The product-based approach: differences in quality reflect differences in measurable attributes. Quality is precise and measurable. This implies that “m ore” or “higher” o f some attribute is “better.” There are two corollaries to this approach:
a- Higher quality can be obtained only at higher cost (attributes are considered costly to produce).
b- Quality is viewed as an inherent characteristic o f goods, rather than as something ascribed to them. Because quality reflects the presence or absence o f measurable product attributes, it can be assessed objectively and is based on more than preferences alone.
3- The user-based approach: quality lies in the eyes o f the beholder. Those goods that best satisfy user wants or needs are those that consumers regard as having highest quality. This is the “fitness for use” idea. The problem is that while “user satisfaction” and quality are related, they are not the same concepts. Preferable may not be better.
4- The manufacturing-based approach: quality is conformance to requirements. Deviation from specifications implies a reduction in quality (“making it right the first time”). This recognizes the customer’s interest in quality. A product made to spec is less likely to be poorly made and unreliable than one that is not, but the focus is internal.
5- Ihe value-based approach: quality is defined in terms o f costs and prices. A quality product is one that provides performance at an acceptable cost.
The manufacturing quality control model starts with quality o f design- the user- based approach, and identifies the product characteristics desired by the user. Standards are then established for those characteristics (product- and value-based approach), and the product is designed to meet those standards. In production, conformance to standards is measured (manufacturing based approach) by testing and/or inspecting the output, and by monitoring the input materials and the production process. Nonstandard output is analyzed to determine the cause o f
failure, so that corrective action can be taken (King, 1987).
M odem methods o f quality assurance were developed and refined in manufacturing industries. The introduction and adoption o f quality assurance programs in service industries has lagged behind manufacturing, perhaps as much as a decade. M anagers o f service organizations had usually assumed that their service was acceptable if the customers did not complain frequently. Only rather recently have they realized that the quality o f service can be managed as a competitive weapon (J. R. Evans 1993).
The importance o f quality in services cannot be underestimated. Studies reveal that (Evans, 1993);
© The average company never hears from 96% o f its unhappy customers. For every complaint received, the company has 26 customers with problems, 6 o f which are serious.
© O f the customers who make complaints, more than half will do business with that organization again if their complaint is resolved. If the customer feels that the complaint was resolved quickly, this figure jumps to 95%.
© The average customer who has had a problem will tell 9 or 10 others about it. Customers who have had complaints resolved satisfactorily will tell only about 5 others.
So, service producing industries must plan for quality to ensure that high quality services are produced efficiently. Because some work processes in service producing industries are similar to those in goods-producing industries, the basic approaches to achieve high quality and productivity are similar (Kacker, 1988).
The theories and principles advocated by such quality leaders as W. Edwards Deming, Joseph M. Juran, and others are relevant not only in the manufacturing setting, but also in the service sector. Deming emphasizes that productivity increases with improvement o f quality. Indeed, both high quality and high productivity result when the work processes are designed and operated optimally. The focus o f improvement, therefore, must be on the design o f the process and the way it is operated (Kacker, 1988).
Kräcker, in his article Quality Planning for Service Industries (1988), says the following about the Juran’s quality trilogy:
“Juran’s quality trilogy lists three basic methods to improve the design and operation o f work processes: quality planning, quality control, and quality improvement. Quality planning is preparing a process to meet quality goals under operating conditions. Quality control is meeting quality goals during operations so that all operations are in accordance with the quality plan. Quality improvement is achieving unprecedented, superior levels o f performance in the operations. The components o f the quality trilogy are analogous to the three components o f total quality control defined by Armand V. Feigenbaum: quality development, quality maintenance, and quality improvement.
Quality control is often a prerequisite for quality improvement, but the only thing quality control itself does is maintain prevailing quality standards. Thus the primary methods for attaining unprecedented, superior levels o f quality are quality planning and quality improvement.”
Eventhough the above mentioned theories and principles are also relevant in the service sector, when service quality dimensions are related to the manufacturing quality assurance framework it is seen that they do not fit very well. Some work processes in service producing industries may be similar to those in goods producing industries, but mainly services are different, and the manufacturing quality assurance system does not address certain characteristics o f services (King 1987). Therefore, the following aspects o f the service processes need to be addressed seperately:
Services are intangible. This characteristic poses major problems for service customers. H ow do you, as a customer, evaluate something that you cannot taste, touch, smell, or feel? Prior to purchase, most customers seek out personal, word- of-mount recommendations because the quality o f a service can only be evaluated as it is experienced- after it has been purchased (Congram & Friedman, 1991).
Intangibility poses such complex questions as these; How do you help customers understand what to expect from your service? How do you manage quality so that customers’ expectations are met and they are satisfied? The answers depend on in-depth understanding o f customers’ perceptions o f quality, and this outside-in perspective is not known in many service organizations (Congram and Friedman, 1991).
Another characteristic o f services is that they are produced and consumed simultaneously (as opposed to products, which are produced first and consumed later). During the service-delivery process, customers and service providers interact, often repeatedly. Customers participate in the delivery process and have contact with several different parts o f the organization (Congram and Friedman 1991). That is customers are often part o f the production and delivery process. For many services, the customer is required to contribute information or effort before the service transaction can be consumed. The quality o f the service delivered is influenced by that information or effort.
All these experiences color their perceptions o f the organization’s quality. In every interaction, service providers frequently influence customers’ perceptions o f quality. As a result customers know these organizations well and are aware o f the degree to which quality is valued (Congram & Friedman, 1991).
From the organization’s perspective, the simultaneity factor means that employees must be supported in ways that help them become sensitive to customer’s
needs. In their dealings with customers, employees embody the organization’s regard for quality (Congram & Friedman, 1991).
Another characteristic differentiating services is that, the production o f goods is person-machine-oriented and the production o f services is person-person-oriented. Social competence, that is, the ability to relate to and interact with the customer on a personal basis, is therefore o f the greatest importance Edvardsson & Gustavsson
1988).
A related characteristic concerns the fact that, within a service organization, no two customer-service provider interactions are alike. Customers and service providers vary in their personalities and needs, so their interactions vary considerably, as well. As a result, it is difficult for an organization to impose rigorous quality standards on such heterogeneous interactions. And it is almost impossible when the service offered involves some degree o f judgm ent (e.g., legal or investment banking services) (Congram & Friedman, 1991).
In addition to these major differences between goods producing and service producing industries major differences between service quality and product quality can be summarized as follows (King 1987):
1- The characteristics on which consumers base their evaluation o f service may have nothing to do with the delivery o f the service. Thus, some o f the characteristics that should be controlled may not be the obvious ones.
2- Consumers may evaluate service as much on the way it is delivered as on the result. Therefore, behavior is a quality characteristic.
3- Customer satisfaction is largely a function o f fulfilling expectations. Since image creates expectations, image is a quality characteristic.
4- Setting the service level may be difficult, since customer evaluations are global and high level, while standards must be based on measurable immediate events.
5- The service quality control system must consider the presence o f the customer in the production process, producing a degree o f unpredictability.
6- Techniques for measuring conformance to standards are different. Testing and inspecting may be used, but do not perform the same fimction.
7- Variances and acceptance ranges may not apply, due to the degree o f customer risk, the inability to reject a service already rendered, and the problem o f cost/benefit determination.
8- Measures o f system efficiency are different: services do not generate scrap and rejects. Labor productivity and resource utilization are more relevant, especially for those services that must be performed on demand and cannot be processed in batches.
9- Many services must be performed on demand, even though conditions may not be optimal. For example, the organization may be understaffed, or experiencing peaks or valleys o f customer demand. The quality control system must recognize and include standards for less-than-optimal operations as well as for the normal operating methods and procedures.
10- Customized and personalized services can be standardized- to a degree. There is usually a standard core, with a certain repertoire o f variations that account for most o f the customized service requirements.
11- Quality control activity may be required at times or in places where supervision and control personnel are not present.
Despite all these differences, in service sector, management often tends to evaluate service quality performance from an operations perspective simply because operations data is under their control and more readily available and they lie on the internal standards to reach high service quality. However, today more and more companies are recognizing that efforts to control quaUty must extend beyond internal standards and specifications to include the perspectives o f customers. They are recognizing that when internal specifications for quality fail to encompass what the consumer has come to expect and/or has been shown to be possible, no amount o f marketing psychology or maneuvering will succeed in turning prospects into buyers, or preventing current customers from becoming former ones. As a consequence, more and more firms are conducting customer satisfaction measurement (CSM) programs (Brandt et al.,1988).
II. 1. Three Perspectives On Quality
Corporate executives are recognizing that there is a link between quality and productivity that affects profits. In organizations o f all types- both service- producing and goods-producing- management is recognizing the significance o f quality improvement as a corporate strategy (Congram & Friedman, 1991).
One example is Xerox Corporation, a recipient o f the Malcolm Baldrige National Quality Award. In the face o f intense competition from Japanese
manufacturers o f photocopy machinery, Xerox personnel looked for ways to cut costs; they found that cost cutting and quality improvement could be done simultaneously. X erox’s Chairman, David T. Kearns, described the potential o f a zero-defects approach as follows: “Pretty early in the process, we realized the cost o f non-conformance was 20% o f revenues.... The opportunity was enormous.” Although financial performance suffered in the short term, the company has regained significant market share fi'om the Japanese. This example illustrates that quality requires the “long-haul” perspective (Congram & Friedman, 1991).
As explained before, developing and implementing a quality improvement process in a service organization is much more complex than it is in manufacturing industries. Consider the multifaceted quality service process developed by American Express and based on the strategy that “quality service...is the most powerful way we can differentiate our product in the market place.” The company’s quality assurance program combines a philosophy that has quality service as its core, input from customers and employees, strong management, customer service requirements that are measurable, and more than 100 programs to recognize employees and increase internal awareness o f service quality. The success o f American Express indicates that leaders who are serious about integrating quality into their organizations must w ork on several “tracks” or “levels” simultaneously, owing to quality’s pervasive nature (Congram & Friedman).
Thus, there are three crucial perspectives: 1- The definition o f quality
Describing service quality is difficult. Generally it is intended to describe service quality in terms o f experiences, especially interactions with customer-contact employees. Service quality is defined under following five headings:
The Quality Is Philosophy Definition
One commonly held view is that “quality is philosophy and it cannot be defined ” Quality seems to result from management example at best and by osmosis at worst. Although a quality-minded philosophy is needed to inspire programs that promote quality, too often the attitude never leads to programs o f substance (Congram & Friedman).
II. 1.1. Definitions of Service Quality
The Technical-Functional Definition
Gronroos proposes that service quality can be divided into two components- technical quality and functional quality. Technical quality involves what the service employee provides during the service provision process. For example, technical quality might consist o f employee knowledge, technical equipment utilized, and technical solutions implemented. Functional quality refers to how the service is provided by the service employee. I f focuses on interpersonal contributions made by the employee to the service encounter (Kelley and Donnelly 1990).
A third approach links quality with certain attributes o f the service. This approach, posits that service quality is controlled if management establishes discrete performance standards for specific points in the service delivery process. I f “helpfulness” is an important attribute to hotel customers, for example, management can develop a set o f “helpful” activities (Congram & Friedman, 1991).
One o f the benefits o f this approach is that a service organization can use these attributes and standards in communicating with customers.
The Process-Based Definition
The premise o f approaches emphasizing process is that quality permeates the service process. This approach takes into account the custom er’s participation in the service and the custom er’s perception o f his or her interaction with the service provider (in addition to the service provider’s perceptions) (Congram & Friedman, 1991).
The challenges management must meet in order to use a process-based frame w ork are considerable. Measurement is one significant problem. How do you assess quality without reducing it to a set o f procedures at a particular point in time? (Congram & Friedman, 1991)
For many service companies, one o f the major areas that must be addressed is the concept o f quality as a moving target. That is, customers and service providers bring to the service delivery process a host o f constantly changing contextual variables having differing degrees o f influence on the process. As a result, the customer’s expectations and definition o f service quality are always changing (Congram & Friedman, 1991).
One fi'amework, based in social psychology, focuses on the service encounter, the interaction between the customer and the service provider. These two individuals interact to achieve mutual gain and, over time, their interactions become stable, thus representing a basis for understanding quality empirically (Congram & Friedman, 1991).
By focusing on the customer-service provider encounter, service managers can acquire a great deal o f knowledge about what factors are most important to customers’ decisions to continue the relationship. These factors might include clients’ attitudes toward and experience with the service, clients’ and service providers’ behaviors during meetings, or cultural influences on service providers. Once service managers understand the salient contextual elements o f the service relationship, they can begin to plan and control encounter outcomes (Brandt et al., 1988).
A zero-defects approach to service should be attempted. Many service organizations accept something less than 99.44 percent as the standard, but consider this. If a 1 % error rate is accepted, it would result in (Congram & Friedman,
1991):
© M ore than 200,000 wrong drug prescriptions annually. 0 W ater that is undrinkable four days per year.
© No telephone service for almost 15 minutes every day.
As new approaches to the definition o f quality are developed and as our measurement tools become more sophisticated, other approaches to the assessment o f quality will evolve, outside-in perspective.
II. 2. Quality Management Models Used In Service Sector
II. 2 . 1 . Total Performance Management
Strategies to create excellence range from one minute actions to highly sophisticated statistical methods. Typically, those that “feel good” are implemented (and die) quickly. Other strategies have produced significant results in manufacturing, but are very hard to implement and maintain in a service environment (Lawton, 1989).
Every organization is familiar with “problems” . And they are also familiar with suggestion programs, quality circles, and all types o f teams to deal with those
problems. In fact, problem centered approaches abound. The hope is that once the problems are eliminated, what is left will be excellence (Lawton 1989).
To solve the measurability problem o f service organization R. L. Lawton approached the situation from a different point o f view. He underlined the challenge in service organizations which is to define and seek out that which is wanted, not that which must be eliminated. The way to do this is by first treating service as a tangible product. A service is generally is thought o f as a verb- somethmg intangible (therefore unmeasurable), and a continuous activity. A product, on the other hand, is a norm; it is tangible, countable, and it occurs in discrete units (Lawton, 1989). Lawton, in his article Creating a Customer Centered Culture for Service Quality, states the following::
“I f a service is viewed as an activity, we try to improve it by focusing on process and efficiency. But when we can see service as a product, we try to improve quality or effectiveness. It is the product-centered strategy that provides the key for creating a customer-centered culture. Creating such a culture, responsive to both internal and external customers, can be done with a method called Total Performance Management (TPM ).”
TPM refers to both a philosophy and a system for simultaneously addressing quality, productivity, profitability, and innovation. This model has six steps (Lawton,
1989):
1. Define the product.
2. Identify customer requirements. 3. Compare product with requirements. 4. Describe the process.
5. Measure productivity, quality, and profitability. 6. Include customers in product development.
TQM is an integrative management concept directed at continuous improvement in the quality o f goods and services by involving all levels and functions o f organization (J. R. Evans 1993). Health care industry has started to adopt Total Quality Management (TQM) in 1991.
TQM seeks to build quality in, not inspect for it. TQM affects the big Q- the total organization. It analyzes the systems interactions within the organization that lead to the problems. For example, if a particular hospital department has a problem, the traditional quality assurance approach is to discover what or who is at fault. However, this is only a short term solution because discovering a single person or thing that is at fault does not always solve the problem. Typically, it is a whole process that needs to be corrected (Labovitz 1991).
The TQM approach starts with the assumption that most problems are interdepartmental. N o one is innocent in a complex organization: very few functions stand alone.
A critical part o f the TQM approach is having the problem solving team incorporate not just decision makers, but also the people who are involved in the problem- the process owners. TQM practitioners feel the most efficient way to solve a problem is to give the people who actually deal with the process the responsibility and power to recommend and implement changes. TQM can transform employees from hired hands to hired heads (Labovitz, 1991).
Kaoru Ishikawa states “the first step in quality control is to know the requirements o f the customer ” (W hat Is Total Quality Control?, Ishikawa 1985) Sound advice. But how can a company be close to the customer? How can a company know the requirements o f the customer? How can customer input become part o f the production line? Several other questions surround this issue.
To address these questions, ARBOR, INC., suggest the use o f a concept called the Customer Window- a method o f identifying customers, gathering customer data, and using these data to deliver a quality product or service. The Customer Window is based on three premises (Cary et al., 1987).
1- Everyone in an organization has customers. The customer may be the ultimate user (external customer) or someone within the organization (internal customer). A customer is anyone to whom someone provides service, information, or a product..
2- Everyone- not just the marketing department- can benefit by becoming more customer oriented.
3- Quality is defined by the customer. To improve quality, find out what the customer wants but is not getting- and then, whenever possible, provide it.
The graphic shown in Figure 1 summarizes the goal o f the Customer Window concept; giving customers what they want. Customer Window Grid is based on quadrant analysis, a marketer research tool. The Grid divides product features into four groups or quadrants (Cary et al., 1987);
1. The customer wants it- and gets it.
2. The customer wants it- and does not get it. 3. The customer does not wants it- and gets it.
4. The customer does not wants it- and does not get it.
The Customer Window Grid provides a concrete, visual guide for discussions about quality and the value o f a product’s attributes. This analysis is applicable for day-to-day decisions about internal customers, as well as for major, critical decisions related to external customers. The customer Window combines simple skills from market research, quality control, and organizational development to help any manager better communicate with customers (Cary et al., 1987).
Wants
Does not get
Customer wants it and Customer wants it
does not get it and gets it
i
---Customer does not want Customer does not want it and does not get it
---3
it and gets it anyway
1 ---Gets
Does not want
Figure 1: The Customer Window Model
m.
IMPORTANCE OF SERVICE QUALITYDuring the last few decades greater emphasis has been placed on quality, particularly in manufacturing. This interest in quality can be traced to the US in the 1920s and to Japan in the 1930s where there was an urgent need to develop the production process for goods. However, it was only in the 1970s that service quality came to be seen as a special field for study for a number o f reasons (Edvadsson, Gustavson 1987):
© Consumerism: the consumer-rights movement has led today’s consumers to believe they have a right to receive products and services that work. © M edia attention: publicity about the high quality o f Japanese products
has made consumers sensitive to the issue o f quality.
© Increased advertising and prom otional attention: in response to consumers’ interest in quality, companies have made an attempt to focus on quality in their marketing efforts.
© Continual technical progress: companies have improved their ability to produce high-quality products.
A recent American Banker’s Survey (1986) found that consumers rank good service first when talking about what satisfies them most about financial institutions and this information helps managers make decisions that will assure good service (Collier 1987).
Leaders o f service organizations are discovering that quality is a critical but intractable element in their organizations’ success. Quality is critical as a source o f competitive advantage because services, in a manner similar to what is happening to tangible products, are becoming commodity-like, and, apparently, lack quality. Consumers are crying out for common courtesy and caring in service delivery. Why? Quality is interactable due, largely, to the complex nature o f services. The more complex operating and delivery environment that services present begs for innovative solutions from service organization leaders (Congram and Friedman
1991).
Today’s customers are more demanding than before. Time pressures on dual income households and business buyers have placed a premium on dealing with firms that do things right the first time. Larger service firms and more complex service offerings make providing high quality, personalized services almost impossible in the absence o f strong quality management programs. And, probably most importantly, firms realize that it is wiser to compete on the basis o f quality than price. Besides all these, it costs more to attract new customers than to retain old ones, which is why firms are beginning to invest more in research and systems to engineer in service quality than in programs to correct problems after they occur. Therefore, American corporations focus on service quality as never before (Bernhardt et all, 1988).
So, in today’s world service quality and service quality improvement is very important. In their book “Delivering Quality Service” Parasuraman, Zeithaml, and Berry say: “ Service managers must not forget that service excellence pays off richly.
With service excellence, everyone wins. Customers win. Employees win. Management wins. Stockholders win. Communities win. The country win.” (Parasuraman, Berry & Zeithaml, 1991).
IV. THE CHALLENGE OF DIFFERENTIATING HEALTH-SERVICES THROUGH QUALITY
Where segmentation is being approached through segment management, service differentiation is a critical and difficult challenge in health care. The environmental factors o f government, employer, and insurance purchasers are forcing providers to compete on price. Where differentiation by price is possible, offering discounts without compensating increases in volume simply reduces provider revenues. It is vital for providers to develop ways o f effectively differentiating on the basis o f service quality or place convenience, rather than on price alone (Congram and Friedman 1991).
In the article “Quality o f Care” (1987) American Medical Associations state the following;
“As government, business, and other payers search for methods to reduce their health care costs, and as competition intensifies in the health sector, efforts to preserve the quality o f health care will become increasingly important. Pressure will grow for changes in delivery and financing systems that may tend to reduce the quality o f care provided. Public debate will increasingly focus on how to define and measure quality, as health professionals, payers, and consumers address such issues as ensuring quality o f care in contracting with provider groups; deceptiveness o f advertisements stating that certain providers give “the highest quality health care available” ; the feasibility o f incorporating a measure o f quality in reimbursing hospitals or any other health care providers; and evaluating the effectiveness o f various treatment modalities and delivery systems.
The challenge posed by this evolving health care environment is threefold; to foster a broader public understanding o f what is meant by the term “high-quality medical care” and o f the current mechanisms used to assess and ensure quality; to develop guidelines regarding appropriate methods for assessing or measuring the quality o f care; and to encourage wide and systematic use o f quality assessment findings to improve the care delivered, and thus increase overall access to care o f high quality.”
Unfortunately, when compared to other industries’ practices, health care’s current approach to quality is underdeveloped and too narrowly focused. Providers certainly do spend time and money documenting quality; they are intensely concerned that the quality o f their care conform to standards because o f regulatory requirements and the malpractice threat (Laffel 1990).
Quality has traditionally been an internal affair in health care. The prevailing doctrine calls for peer review, review o f physician performance by other physicians.
Health service organizations face the challenge o f developing quality indicators that are meaningful to each o f their distinct customer constituencies and market segments. Armed with indicators that can be measured and communicated, providers can then manage their operations so as to maximize their demonstrable quality, or to stay ahead or abreast o f the competition, at least in the eyes o f some segments. They can then use their quality indicators in approaching prospects in order to increase their patient volume, or to protect what they already have (Congram & Friedman, 1991).
Health care organizations have an opportunity, they have four characteristics that will hasten the application o f quality management science (Laffel, 1990).
© First, educational levels are very high. There will be relatively little difficulty teaching basic statistics or quality management theory to many hospital employees.
© Second, dedication to the scientific method is already ingrained in the culture o f health care organizations, at least as it applies to clinical practice. Doctors are taught to observe symptoms, generate hypotheses, design treatments, and monitor results.
© Third, health care providers already possess a deep commitment to kaizen, or continuous improvement, o f all aspects o f patient care. Once providers recognize that quality management science has similar philosophical underpinnings and that it uses empirically tested methods, they will likely be attracted to the science and try these methods.
© Fourth, patients and payers are demanding that providers curb escalating health care costs and approach quality improvement more systematically. Providers should therefore be willing to experiment with quality management science; it is proven to meet both o f these customer needs.
V. ABOUT THE HOSPITAL UNDER STUDY
Hospital management started to work on TQM in October 1994. With the start o f TQM process a change process had also started. Let’s now give information about the hospital and their TQM study.
This hospital is a part o f a group o f companies. The aim o f the hospital’s founders was to establish a physical facility which does not look like traditional hospitals and also that does not smell as a hospital. Because, they thought that these were the things irritating customers as soon as they enter the hospital.
The management style o f the group is determined in personnel by-laws. According to this, teamwork concept is taken as the basis in management o f the group. An organization in which people both love their job and each other & work in harmony is targeted. Besides, each employee is accepted as responsible from the success o f the team and the work done by the unit. Each team member required to know both the goals and strategy o f the team he/she is in and the goals o f the whole organization. To implement this management philosophy, an organization chart is prepared.
The seven shareholders form the board o f directors. Apart from that there is a Hospital Management Council that is led by the General Manager. Hospital Manager, Head doctor. Assistant Head Doctor, Head-nurse, communications group responsible are the members o f this council. Hospital is managed by the Hospital Management Council. In fact, the board o f directors is not effective in the management however, some strategic decisions are taken by them.
The decision taken by the Hospital Management Council are implemented by the responsible service group. However, the job descriptions, authorities and responsibilities o f employees in each unit are not determined explicitly. Because o f this, the employees determine their authorities and responsibilities by themselves. It is also mentioned that an informal and flexible organizational structure is accepted as more suitable at formative days o f the hospital.
Q uality m anagem ent g ro u p o f th e hospital determ ined the follow ing problem s and deficiencies in operations. First o f all, the m anagem ent style targ eted in personnel by-law s is observed n o t to be w orking. T here are serious differences betw een w hat is aim ed at and w hat actually happens. P articip atio n o f em ployees to m anagerial decisions is n o t encouraged. The m em bers o f th e council and som e d o cto rs are dom inating the m anagem ent process. This show s th at th ere is a gap betw een the co n cep t and im plem entation o f a team based design.
Secondly, management tried to force the limits o f the capacity which affected the quality o f the service in a negative way. The problem o f insufficient physical
capacity was disregarded and some strategic decisions were given in a hurry. So, actions o f this nature gave the employees a feeling that, more importance was given to profitability rather than quality by managers.
Mission statement o f the hospital was:
“ This hospital should become the first institution that its customers (patients, doctors, laboratories) are thinking to get service from when they think o f health services and whether the reason is, a customer who has received service from the hospital once, will never consider getting it from another place. The employees o f the hospital, who will be trained to give a service at this level, will be the core element in making the service quality o f this hospital widespread in Turkey.”
Considering this mission statement and the problems stated above, a need for a change in the organization emerged. In line with this thinking, managers decided to start up quality management studies. As a result they started TQM studies under the consultancy o f M ETU group. The aim o f TQM project was stated as :
© to plan TQM system for the hospital
0 to give expert aid to hospital management in implementing TQM © to help increase patient/employee content, increase competitive strength and to decrease costs
Firstly, the consultants analyzed the system o f the hospital and tried to get familiar with it. For doing this, they interviewed thirty employees to get their opinions about the problems they face in their jobs and their comments on possible solutions. The aim o f the system analysis study was to determine quality problems
and quality improvement needs and to find out the root causes o f the stated problems. After that, they carried out pareto analysis and fishbone diagrams o f the problems and then they decided on the problems which are suitable to work on. These are as follows:
© long waiting times o f patients © problems about inaccurate billing © effective usage o f bed capacity © effective usage o f policlinic rooms
© to give right laboratory diagnosis results on time © effective usage o f surgical rooms
© delays in emergency service © employees having low moral levels
© communication problems among people and departments etc.
Consultancy group stated that the hospital has some advantages making it easier to w ork on TQM:
© management’s strong commitment and participation
© employees being volunteer, dynamic and open to new things © usage o f high technology
© high levels o f quahty consciousness among employees
Besides this system analysis they organized some training programs and still they are continuing with training and will continue in the future. In addition to these they reformulate their vision and quality politics (Appendix D).
There was a missing point in determining problems to work on: customers. They started analyzing customers after that, i.e., in November 1994. For taking customers’ views they prepared a questionnaire (Appendix D). They conduct it each month through telephone calls. For interpretation o f the questionnaires they use a “quality multiplier” which is equal to the division o f the number o f patients who are totally satisfied by the total patient number. In the Table 1 results o f this study for February and March are seen for different departments. It can be easily seen that overall quality multiplier decreased in March with respect to February. This gives an important message: they are not on the right way in their quality study or they made improvements but the questionnaire they use fails to measure the progress.
T able 1: Results o f quality multiplier for the hospital
MONTH FEBRUARY MARCH
QUALITY MULTIPLIER (OVERALL VALUE)
VI. SERVQUAL - A NEW APPROACH TO SERVICE QUALITY
Up to this point quality concept, both in manufacturing and service industries, is explained and also the importance and difficulty o f measuring service quality is emphasized.
In this section SERVQUAL, a methodology for measuring service quality, is explained in detail. SERVQUAL was developed by Parasuraman, Berry and Zeithaml and they give a great insight in this subject in their book “Delivering Quality Service- Balancing Customer Perceptions and Expectations” (1990).
SERVQUAL provides a structure for understanding service quality, measuring it, diagnosing service-quality problems. This model is referred as the “gaps model” because it features discrepancies or gaps that need to be closed to offer excellent service. Using this model Parasuraman, Berry and Zeithaml seek to demonstrate that service quality is a subject that one can grap hold of, understand, and do something about (Babakus & Mangold, 1992).
Parasuraman, Berry and Zeithaml* found that the existing literature was not rich enough to develop a comprehensive conceptual foundation for understanding
' For the sake of simplicity the initials (PZB) instead of full names of the authors will be used throughout this stutfy
and improving service quality and a number o f key questions remained unanswered. Therefore to seek answers to these unanswered questions and to reach to the above mentioned goals they conducted focus group interviews among users o f four types o f services: retail banking, credit cards, securities brokerage, and product repair and maintenance. Through the focus group interviews customers’ definition o f service quality is found as meeting or exceeding what customers expect from the service. So, they understood that judgement o f service quality depends on the customers’ expectations and perceptions and discrepancy between expectations and perceptions. SERVQUAL is developed over this understanding (Babakus & Mangold, 1992).
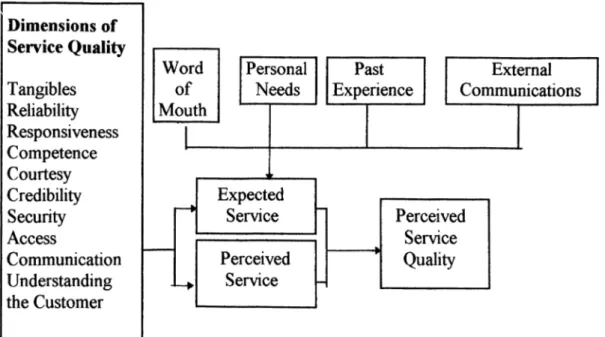
Second outcome o f the focus group interviews is the factors influencing expectations. Focus groups suggested that several key factors might shape customers’ expectations. These are (PZB, 1991):
1. Word-of-mouth communication: what customers hear from other customers. This is the potential determinant o f expectations.
2. Personal needs: individuals characteristics and circumstances o f customers.
3. Past experience
4. External communications from service providers: direct and indirect messages conveyed by service firms to customers.
5. Price: influence o f price on expectations is subsumed under the general influence o f external communications. This factor plays an important role in shaping expectations, particularly those o f prospective customers o f a service.
The next insights emerging from focus groups are the ten general criteria or dimensions o f service quality that customers used in judging service quality (PZB, 1991).
Even though the specific evaluative criteria may vary from service to service, the ten general dimensions o f service quality are exhaustive and appropriate for assessing quality in a broad variety o f services (PZB, 1991).
In fact, this ten dimensions are not independent o f one another. As will be explained latter in this section, after quantitative researches are conducted the overlapping ones are gathered together and the number o f dimensions is decreased to five (PZB, 1991).
The ten dimensions o f service quality and their definitions are as follows (PZB, 1991): 1. Tangibles: Appearance o f physical facilities, equipment, personnel, and communication materials.
2. Reliability: Ability to perform the promised service dependably and accurately.
3. Responsiveness: Willingness to help customers and provide prompt service.
4. Competence: Possession o f the required skills and knowledge to perform the service.
5. Courtesy: Politeness, respect, consideration, and fnendliness o f contact personnel.
6. Credibility: Trustworthiness, believability, honesty o f the service provider.
7. Security: Freedom from danger, risk, or doubt. 8. Access: Approachability and ease o f contact.
9. Communication: Keeping customers informed in language they can understand and listening to them.
10. Understanding the Customer: Making the effort to know customers and their needs.
Figure 2 illustrates the findings o f focus group interviews.
Figure 2: Findings o f focus group interviews
Source: Parasuraman, A., Berry, L. L., Zeithaml, V.A., Delivering Quality Service: Balancing Customer Perceptions and Expectations. Collier Macmillan Publishers, London, 1990
Customer surveys, that is the quantitative research phase, followed the exploratory, i.e., qualitative (focus group) phase. The qualitative phase o f the research yielded a definition o f service quality, identified the factors that influence customers’ expectations and revealed ten general dimensions that customers use in assessing service quality. The major outcome o f the second phase is the
SERVQUAL- an instrument for measuring customers’ perceptions o f service quality (PZB, 1991).
SERVQUAL consists o f two sections (PZB, 1991):
1. An expectations section containing 22 statements to ascertain the general expectations o f customers concerning a service.
2. A perceptions section containing a matching set o f 22 statements to measure customers’ assessments o f a specific firm within the service category.
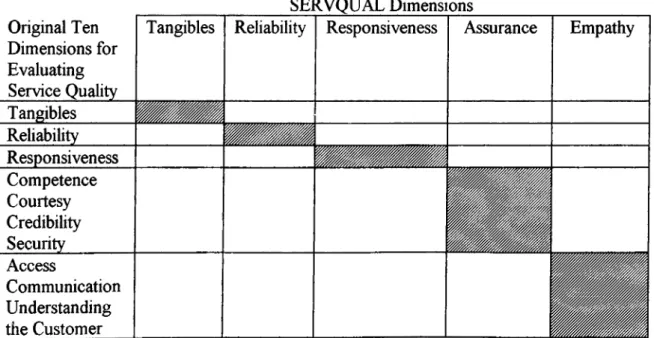
The statistical analyses conducted in constructing SERVQUAL revealed considerable correlation among the ten dimensions. Therefore, the last seven dimensions are consolidated into two broader dimensions labeled as assurance and empathy. Figure 3 shows the correspondence between the original ten dimensions and SERVQUAL’s five dimensions (PZB, 1991).
Last outcome o f the second phase is the relative importance o f the SERVQUAL dimensions. W hat is found is that reliability is the most critical dimension, regardless o f the service being studied. The results o f the studies showed that customers gives an important message to service providers: appear neat and organized, empathetic, and most o f all, be reliable: do what you say you are going to do. O f course, one must not forget that the relative rankings o f the dimensions as perceived by customers might change in the future (PZB, 1991).
SERVQUAL Dimensions Original Ten
Dimensions for Evaluating Service Quality
Tangibles Reliability Responsiveness Assurance Empathy
Tangibles Reliability Responsiveness Competence Courtesy Credibility Security Access Communication Understanding the Customer
Figure 3: Correspondence between SERVQUAL Dimensions and Original Ten Dimensions for Evaluating Service Quality
Source: Parasuraman, A., Beny, L. L., Zeithaml, V.A, Delivering Quality Service: Ralanrin^ Customer Perceptions and Expectations. Collier Macmillan Publishers, London, 1990
The definitions o f the new two dimensions along with the three original ones that remained intact are as follows;
Tangibles Appearance o f physical facilities,
equipment, personnel, and communication materials
R eliability Ability to perform the promised service dependably and accurately
Responsiveness Willingness to help customers and provide prompt service
A ssurance Knowledge and courtesy o f employees and their ability to convey tm st and confidence Em pathy Caring, individualized attention the firm
VI. 1. Identifying The Causes Of Service Quality Shortfalls
Up to this point discussions are focused on assessing and understanding customers perceptions o f service quality. From this point on potential causes o f service quality shortfalls are discussed together with the service quality shortfall perceived by customers.
The authors, as a part o f the exploratory research phase, interviewed executives from four nationally recognized companies chosen from the same four sectors in which they conducted customer focus group interviews. These interviews with executives provided information concerning potential causes o f service-quality shortfalls. As a result, four key discrepancies (that they labeled them also as gap) pertaining to executive perceptions o f service quality and the tasks associated with service delivery to customers are formed. These four gaps, are defined by the authors as the major causes o f the service-quality gap (Gap 5) customers may perceive (i.e., the discrepancy between their expectations and perceptions) (PZB,
1991).
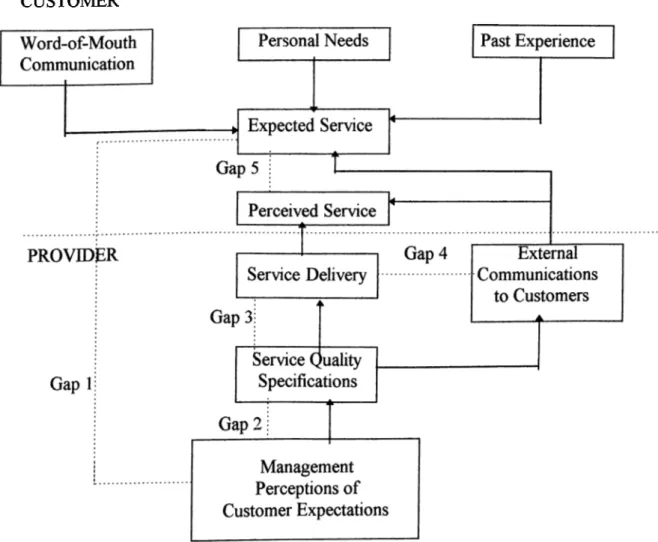
As a result o f all these qualitative and quantitative studies the authors identified five gaps that need to be closed to reach excellence (PZB, 1991);
GAP 1 : Customers’ Expectations-Management Perception Gap GAP 2: Management’s Perception-Service Quality Specification Gap GAP 3. Service Quality Specifications-Service Delivery Gap
GAP 4: Service Delivery-External Communications Gap GAP 5: Customers’ Expectations-Perceived Service Gap
GAP 5: Customers’ Expectations-Perceived Service Gap
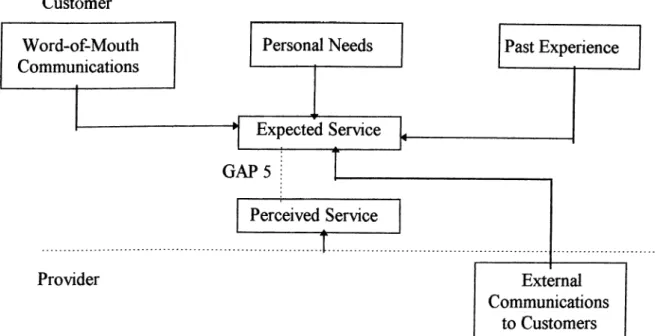
Gap 5 represents the potential discrepancy between the expected and perceived service from the customers’ standpoint. As can be seen from Figure 4 key determinants o f the service expected by customers are word-of-mouth, communications, personal needs, past experience, and external communications from the service-provider (PZB, 1991).
Customer
Figure 4: Key Factors Contributing to Gap 5
Source: Parasuraman, A., Beny, L. L., Zeithaml, V.A, Delivering Quality Service: Balancing Customer Perceptions and Expectations. Collier Macmillan Publishers, London, 1990
GAP 1: Customer Expectations-Management Perception Gap
The first and possibly most critical step in delivering quality service is knowing what customers expect. Knowing what customers expect is the prerequisite o f providing services that customers perceive as excellent. However executives may
not always be aware o f which characteristics connote high quality to customers. They may not know certain service features that are critical in meeting customers’ desires. Even if they are aware o f these features, they may not capture which levels o f performance customers desire along them (PZB, 1991).
Being a little bit wrong about customers desires and wants can mean losing a custom er’s business; expending money, time, and other resources on things that do not count to customers; not surviving in a competitive market (PZB, 1991).
In order not to give bad decisions and not to make suboptimal resource allocations that result in perceptions o f poor service quality executives with the authority and responsibility for setting priorities should fully understand customers’ service expectations. Therefore, the necessary first step in improving quality o f service, i.e., narrowing Gap 5, is to close Gap 1. This is possible through management acquiring accurate information about customers’ expectations (PZB, 1991).
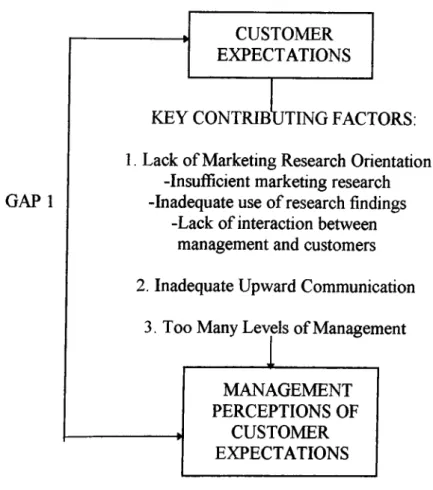
The authors identified three conceptual factors contributing to Gap 1. These factors are illustrated in Figure 5 and they are labeled as antecedents o f Gap 1.
GAP 1
CUSTOMER EXPECTATIONS
KEY CONTRIBUTING FACTORS; 1. Lack o f Marketing Research Orientation
-Insufficient marketing research -Inadequate use o f research findings
-Lack o f interaction between management and customers 2. Inadequate Upward Communication
3. Too Many L e \jls o f Management
MANAGEMENT PERCEPTIONS OF
CUSTOMER EXPECTATIONS
Figure 5: Key Factors Contributing to Gap 1
Source: Parasuraman, A., Berry, L. L., Zeithaml, V.A., Delivering Quality Service: Balancing Customer Perceptions and Expectations. Collier Macmillan Publishers, London, 1990
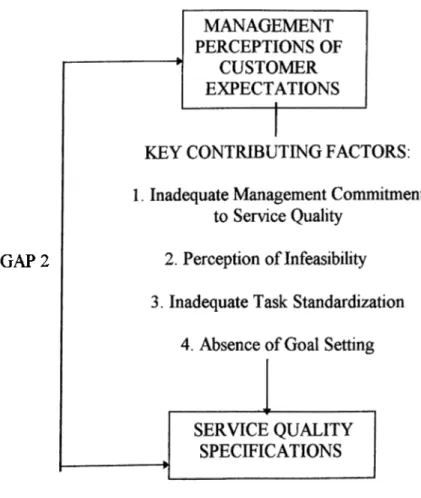
GAP 2: Management’s Perception-Service Quality Specification Gap
The second step in delivering high service quality is for managers to use the information collected about customers expectations to set service quality standards for the organization. In some cases management may not be willing or able to put the systems in place to match or exceed customers’ expectations (i.e., they have difficulties in translating their understanding o f customers’ expectations into service- quality specifications). So, the discrepancy between manager’s perceptions o f
custom er’s expectations and the actual specifications they establish for service quality is the second gap (PZB, 1991).
If Gap 2 can be closed or narrowed, this will have a favorable impact on customers’ service quality perceptions. Gap 2 and its antecedents are illustrated in Figure 6. In closing Gap 2 these items should be considered.
GAP 2
Figure 6: Key Factors Contributing to Gap 2
Source: Parasuraman, A , Beriy, L. L., Zeithaml, V.A, Delivering Quality Service: R alandiuT Customer Perceptions and Expectations. Collier Macmillan Publishers, London, 1990
GAP 3: Service Quality Speciflcations-Service Delivery Gap
Service performance gap (i.e., the difference between service specifications and the actual service delivery) is common in service businesses even though the management does understand customers’ expectations and does set appropriate specifications and guidelines for performing services well and treating customers correctly. That is the existence o f these guidelines is not a certainty for high quality performance (PZB, 1991).
To be effective, service standards must not only reflect customers’ expectations but also be backed up by adequate and appropriate resources which are people, systems and technology. Gap 3 is most vulnerable in organizations offering services that are highly interactive, labor intensive, and performed in multiple locations (PZB, 1991).
Service quality suffers when employees are unwilling or unable to perform a service at the level required. So if the level o f service delivery performance falls short o f standards, it falls short o f what customers expect as well. This direct association between Gap 3 and Gap 5 suggests that narrowing Gap 3 will also reduce Gap 5 (PZB, 1991).
Maintaining service quality, then, depends not only on recognizing customers’ desires and establishing appropriate standards but also on maintaining a work force o f people both willing and able to perform at specified levels (PZB, 1991).
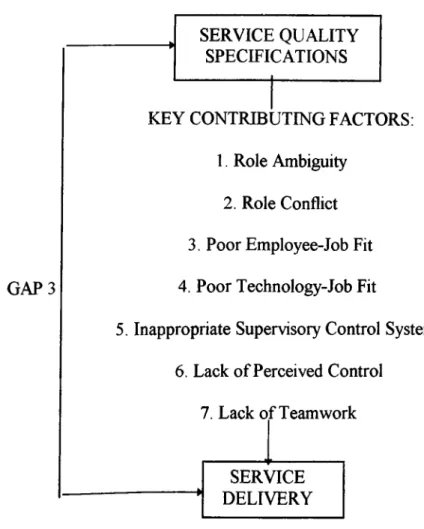
Conceptual factors that should be focused in narrowing Gap 3 are illustrated in Figure 7.
G A P3
SERVICE QUALITY SPECIFICATIONS
KEY CONTRIBUTING FACTORS: 1. Role Ambiguity
2. Role Conflict 3, Poor Employee-Job Fit 4. Poor Technology-Job Fit
5. Inappropriate Supervisory Control Systems 6. Lack o f Perceived Control
7. Lack o f Teamwork
SERVICE
1
DELIVERYFigure 7: Key Factors Contributing to Gap 3
Source: Parasuraman, A., Beny, L. L., Zeithaml, V.A, Delivering Quality Service: Ralanninp riigtnm<>r Parceptions and Expectations, Collier Macmillan Publishers, London, 1990
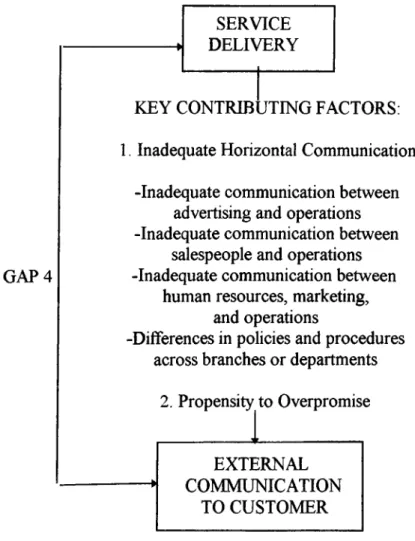
GAP 4: Service Delivery-External Communications Gap
The discrepancy between what a firm promises about a service and what it actually delivers is the fourth major cause o f low service-quality perceptions. Promises made by a service company through its media advertising, sales force, and other communications affect the customers’ assessment o f service quality. Service