Performance Evaluation of Bank Branches in Turkey Using the
TOPSIS Method
Eşref Savaş BAŞCI,
Faculty of Economics and Administrative Sciences, Banking and Finance Department,
Hitit University, Çorum, Turkey.
E-mail: [email protected]
___________________________________________________________________________
Abstract
A new trend in the banking sector has focused on branch effectiveness in improving efficiency and performance. There are potential methods to reduce all costs and to raise the performance of the banks. One way is to reduce branch costs. In the banking sector, all banks desire to know their branch effectiveness in comparison to others. In this study, we analyzed privately owned bank branches’ effectiveness for 2015 in Turkey. We calculated nine banks’ variables to estimate ideal solutions of relative proximity using the TOPSIS method. According to the results, T. Garanti Bankası ranked first, Tekstil Bankası ranked second and Turkish Bank ranked third in branch effectiveness for 2015 in Turkey. According to the Spearman’s Rho test statistics, there are important results, including ROE’s link to Assets and Deposits with a positive and high coefficient that is significantly correlated at the 0.01 level. Personnel Cost is additionally linked with Assets, Deposits and ROE, significantly at the 0.01 and 0.05 levels respectively.
___________________________________________________________________________ Key Words: Branch Effectiveness, TOPSIS Method, Turkish Banking Sector
2016 Vol: 5 Issue: 2
1. Introduction
What can we understand about the effectiveness of banking? Can we determine the effectiveness using the result of a bank’s competitiveness? A new trend in banking is focused on the competitiveness of certain activities. Banks can do well by reducing branch costs. Hence, banks want to quickly reach all potential customers. Competitiveness in the finance world is necessary to force all branches to have effective management and reduce all costs. It also leads to a bank branch reconsidering all their costs. The European commercial banking industry has especially focused on cost efficiency, which is related to a different cost structure for both large and small size banks.
Some ratios from financial tables, such as balance sheets and income statements, are very important tools for evaluating banks and their branches. Most banks want to compare branches to one another in order to rank them by their successes or failures. There are some relationships between branches, such as effectiveness and profitability, some studies argue that profitability leads to remarkable insight for the bank branch (Ioannis, 2010).
Banks may easily classify their ownership structure as either state-owned or privately owned in Turkey. The privately owned banks, in particular, focus on competitiveness. These banks can use certain ratios to evaluate their positions in the banking sector. Banks may also reduce some of the ratios in order to increase their profitability (Sakinc and Acikalin, 2015).
2. Literature Review
In literature there are numerous articles related to bank performance and the TOPSIS methods. Hirtle has investigated the relationships between bank branches and the various network sizes. Results of the study from Hirtle show that the largest branches have the competitive advantage, rather than the mid-sized branches. The key findings on the mid-sized branches are related to the level of deposits per branch and determined that they have no institutional profitability (Hirtle, 2015).
Kandemir and Arıcı investigated performance measurement of privately owned banks from 2001 to 2010 in Turkey. The main goal of the study was to determine which kinds of performance from the financial tables allow them to be more effective than other banks. They also analyzed the effects of the 2001 banking crisis in Turkey on bank performance. In their results, the foreign, state-owned banks were more effective as an ownership structure than other private banks (Kandemir and Arıcı, 2013).
Boufounou has investigated the effect of Greek banks branch locations and their goals on asset management and performance. In the paper, branch performance was analyzed by using a regression model to estimate the variables that can affect the volume of deposits for the Greek Bank branches. The author emphasized that the decision-making process is an important factor for the volume of deposits (Boufounou, 1995). Additionally, bank branch performance has been
investigated since 1985 using over 80 studies through data envelopment analysis (Paradi and Zhu, 2013).
Hensel (2003) investigated the role of cost efficiency in large and small banks. In the paper, management efficiency on branch banks was also analyzed. In the results of the paper, they found that large banks show cost efficiencies on the margin compared to small bank branches. In their preferred paper, cost function of network variables with cross border is efficiency. With this result, they also found that larger banks can generate a smaller income per branch by using network relations between cross-border banks.
In a study on Canadian banks, Paradi and Schaffnit (2004) investigated performance of commercial banks using Data Envelopment Analysis. They used two models to analyze all branches of the banks. Firstly, they determined resource usage for the more effective branches of the bank, and secondly, they analyzed their financial results. They also analyzed the effectiveness of data envelopment analysis to their banks’ inputs and results. In the paper, they made several arguments for their results. The construction of a performance measurement system, having customer satisfaction-based goals, and implementing cost minimization studies on the performance of the branches were all determining factors in the study.
Using data envelopment in different articles is related to investigated service and profit chain among bank branches. Profitability of bank branches, effectiveness of quality service to the external users, and causal relationships among all dimensions are analyzed with the data envelopment analysis by Manandhar and Tang in 2002. They also analyzed internal service quality efficiency, operating efficiency and profitability efficiency as dimensions for bank branches.
3. Methodology and Model
In this study we have used the Technique for Order Preference by Similarity to Ideal Solution (TOPSIS). TOPSIS is one of multiple factors in decision making methods (Hemmati et al., 2013). This method can be used in various studies, not only in management and the production process but also in finance. The method has six steps in the solving process (Hwang and Young, 1981).
STEP 1: Determination Decision Matrix
This decision matrix has rows that include decision points ordered by the success criteria and has columns that refer to the evaluation factors that may be used in the decision-making process. This method can be explained as:
2016 Vol: 5 Issue: 2 mn m m n n ij a a a a a a a a a A ... . . . . . . ... ... 2 1 2 22 21 1 12 11
In Aij matrix m refers to count of decision point, n refers to count of the evaluating factor.
STEP 2: Standard Decision Matrix
A Standard decision matrix can be calculated by using Aij matrix’s components. It can be shown as follows:
m k kj ij ij a a r 1 2In this formula, rij matrix can be obtained as follows:
mn m m n n ij r r r r r r r r r r ... . . . . . . ... ... 2 1 2 22 21 1 12 11
STEP 3: Weighted Standard Decision Matrix
In this step, the initial criteria weights (
w
i) related to the evaluation factors must be calculated. Then each element that is placed in each column must be multiplied with the Wi, therefore we can make a new matrix that is called the V Matrix:
n i iw
11
mn n m m n n n n ij r w r w r w r w r w r w r w r w r w V ... . . . . . . ... ... 2 2 1 1 2 22 2 21 1 1 12 2 11 1STEP 4: Making Solutions for Ideal (A+) and Ideal (A-)
The TOPSIS method assumes that each evaluating factor has a tendency of up or down. The set of ideal solving can be calculated using the maximum and minimum component to find the best solution as follows:
' min ( ), (maxv j J v j J A ij i ij i
The above formula is determined for A+ ideal solution cloud. The A- ideal solution was calculated as follows: ' max ( ), (minv j J v j J A ij i ij i
In both formulas, J shows the benefit maximization, and J’ shows the lost minimization.
STEP 5: Calculating Dimension of Distinction
This step needs to calculate the standard deviation of the decision point among the positive and negative dimensions. There are two parts of the solution for each positive and negative side. It can be calculated as follows:
n j j ij i v v S 1 2 * ) (
n j j ij i v v S 1 2 ) (Naturally, Siand Sihave count of decision points.
STEP 6: Calculating Ideal Solutions of Relative Proximity
In this last step, relative proximity can be calculated using the ideal negative and the ideal distinction as follows: * * i i i i
S
S
S
C
Ci* value must be between 0Ci* 1, and 1*
i
C , and Ci* 0
All alternatives with respect to C* values are in descending order. We must select from
alternatives with the highest C*value.
In this study, we analyzed the nine private banks that have the highest assets in the banking sector in Turkey. We examined the financial and non-financial ratios for all banks for 2015. All variables can be classified as financial or non-financial terms in this study. Variables were calculated for banks by using balance sheets, income statements and other related data. They are also obtained from the banks’ financial tables and The Banks Association of Turkey database.
2016 Vol: 5 Issue: 2
Table 1: Variables and Descriptions
Variables Description Classifying of
Variables
Assets per Branch Total Assets of Bank / Count of Branch of the Bank Financial Ratio
Deposits per
Branch Total Deposits of Bank / Count of Branch of the Bank Financial Ratio
Staff per Branch Total Count of Staff of Bank / Count of Branch of the
Bank Non-Financial Ratio
ROA – Return on
Assets Total Net Profit / Total Assets Financial Ratio ROE – Return on
Equity Total Net Profit / Total Equity Financial Ratio Personnel Cost
per Branch Total Personnel Cost / Count of Branch of the Bank Financial Ratio
Non-performing Loans per Branch
Total Amount of Non-performing Loans / Count of Branch
of the Bank Non-financial Ratio
Table 2: The Selected Banks from Turkey’s Banking System
Name of Bank Adabank Inc. Akbank Inc. Anadolubank Inc. Fibabanka Inc. Şekerbank Inc. Tekstil Bankası Inc. Turkish Bank Inc.
Türk Ekonomi Bankası Inc. Türkiye Garanti Bankası Inc.
Table 2 shows private banks for 2015 in terms of Assets Size. The banks were selected from the Turkey Banking Sector as a sample because of their large share of the Total Banking Sector in Turkey.
4. Results and Discussion
In this study, we have analyzed financial and operational data for 2015. Table 3 shows all of the banks’ ratios for 2015.
Table 3: All Variables for Each Banks Ass et s p er B ran ch Dep o sits p er B ran ch Staf f p er B ran ch R OA – R etu rn on Ass et s R OE – R etu rn o n E q u ity Per so n n el C o st p er B ran ch No n -p er fo rm in g L o an s p er B ran ch Adabank Inc. 51.1 6.4 31.0 2.4 2.8 57.5 0.1 Akbank Inc. 207.3 114.4 16.5 1.5 12.6 88.2 1.0 Anadolubank Inc. 87.8 60.3 16.3 1.5 11.6 100.4 1.2 Fibabanka Inc. 120.0 78.3 18.2 0.9 12.7 92.6 2.2 Şekerbank Inc. 67.9 43.4 14.3 1.1 9.4 77.4 1.7
Tekstil Bankası Inc. 83.1 57.0 19.4 0.3 2.0 88.1 0.3
Turkish Bank Inc. 77.8 50.3 14.7 0.3 2.5 78.3 0.9
Türk Ekonomi Bankası Inc. 114.3 71.6 18.4 1.0 10.5 83.9 0.5 Türkiye Garanti Bankası Inc. 218.5 120.1 19.0 1.5 12.3 102.8 0.4
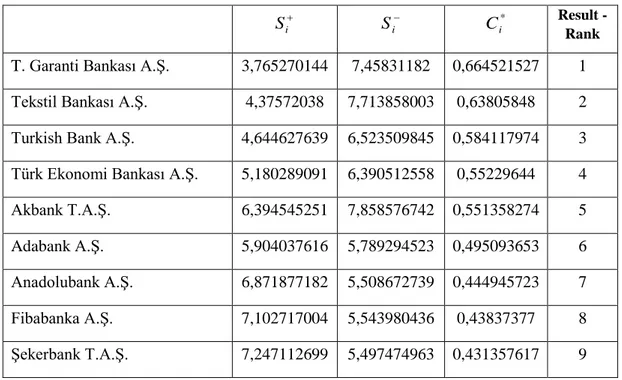
Table 4: Result of Ideal Solutions of Relative Proximity
Si Si
*
i
C Result -
Rank
T. Garanti Bankası A.Ş. 3,765270144 7,45831182 0,664521527 1 Tekstil Bankası A.Ş. 4,37572038 7,713858003 0,63805848 2 Turkish Bank A.Ş. 4,644627639 6,523509845 0,584117974 3 Türk Ekonomi Bankası A.Ş. 5,180289091 6,390512558 0,55229644 4 Akbank T.A.Ş. 6,394545251 7,858576742 0,551358274 5
Adabank A.Ş. 5,904037616 5,789294523 0,495093653 6
Anadolubank A.Ş. 6,871877182 5,508672739 0,444945723 7 Fibabanka A.Ş. 7,102717004 5,543980436 0,43837377 8 Şekerbank T.A.Ş. 7,247112699 5,497474963 0,431357617 9
Table 4 shows that all banks have ideal solutions of relative proximity results. Ci* values are
between 0 and 1. When we order the Ci* from largest to smallest, we are also ordering the banks from most effective to least effective.
2016 Vol: 5 Issue: 2
Although we have the result of all banks’ ideal solutions with the TOPSIS Method, we need to check that all results rank in order of significance. For this purpose, we analyzed the overall ranking variables Spearman’s Rho test, a non-parametric version of the Pearson Correlation Test. With this test, strength and direction of two ranking variables, which have non-monotonic relations to one another, can be analyzed.
We have calculated all of the banks’ variables in order of rank as a series. Table 5 represents all of the criteria for the variables of the bank branches. We used two ways for ordering both, an ascending order and a descending order.
Table 5: Result Order Criteria
Result Ordered By
Per Branch Ascending Descending
Assets * Deposits * Staff * ROA * ROE * Personnel Cost * Non-Performing Loans *
In Table 5, the ascending order means that the variables are important if ordered from minimum value to higher value. For example, a small amount of Staff is important for the bank branch in terms of efficiency, such as with Personnel Costs and Non-Performing Loans per branch. On the contrary, descending order is important to the other variables like Assets, Deposits, ROA and ROE as well. Because these variables have high value, we need to set the rank first to maintain order until the last variable’s value. On the other hand, high to low order signifies a descending order for the paper.
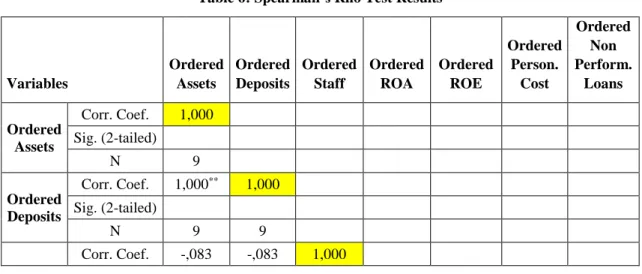
Table 6: Spearman’s Rho Test Results
Variables Ordered Assets Ordered Deposits Ordered Staff Ordered ROA Ordered ROE Ordered Person. Cost Ordered Non Perform. Loans Ordered Assets Corr. Coef. 1,000 Sig. (2-tailed) N 9 Ordered Deposits Corr. Coef. 1,000** 1,000 Sig. (2-tailed) N 9 9 Corr. Coef. -,083 -,083 1,000
Ordered Staff Sig. (2-tailed) ,831 ,831 N 9 9 9 Ordered ROA Corr. Coef. -,017 -,017 -,100 1,000 Sig. (2-tailed) ,966 ,966 ,798 N 9 9 9 9 Ordered ROE Corr. Coef. ,767* ,767* ,133 ,333 1,000 Sig. (2-tailed) ,016 ,016 ,732 ,381 N 9 9 9 9 9 Ordered Personn el Cost Corr. Coef. -,850** -,850** ,033 -,033 -,650 1,000 Sig. (2-tailed) ,004 ,004 ,932 ,932 ,058 N 9 9 9 9 9 9 Ordered Non Perform . Loans Corr. Coef. -,200 -,200 -,783* ,083 -,567 ,250 1,000 Sig. (2-tailed) ,606 ,606 ,013 ,831 ,112 ,516 N 9 9 9 9 9 9 9
**. Correlation is significant at the 0.01 level (2-tailed). *. Correlation is significant at the 0.05 level (2-tailed).
5. Conclusions and Recommendations
In this study we analyzed privately owned bank branches’ effectiveness by using financial and non-financial ratios for 2015 in Turkey. All of the privately owned banks that are used in this study have high assets sizes for the year of 2015 as compared to all other private banks in Turkey. In the analysis, we used a consolidated value for the TOPSIS analyses. All ratios are taken into account for the branch capability and productivity for each variable is related to the literature. According to the TOPSIS method, we calculated nine bank variables to estimate the ideal solutions of relative proximity. In the result, we have the ranking order from highest
*
i
C
value to the lowest as an order base. According to the results, T. Garanti Bankası ranked first, Tesktil Bankası ranked second, and the Turkish Bank ranked third for branch effectiveness. The staff per branch ratio is also a very important variable in the study. The T. Garanti Bankası has one of the highest ratios from among all banks in the study, although it was expected to be the lowest ratio. All banks may use the result to improve their branch effectiveness.
According to the Spearman’s Rho test statistics, there are some important results such as ROE’s link to Assets and Deposits with a positive and high coefficient that is correlated significantly at the 0.01 level. Personnel Cost is linked with Assets, Deposits and ROE significantly at the 0.01 and 0.05 levels respectively. Consequently, if a bank’s branch wants to increase their ROE, they must support the Assets and Deposits per branch level in terms of branch efficiency that we found in the study. Indeed, they have to decrease Personnel Cost per Branch at the same time. What banks can operate to diminish personnel cost in terms of branch efficiency? For further work on this topic, it is suggested that more variables be found and used
2016 Vol: 5 Issue: 2
to determine a bank’s effectiveness. In addition to this topic, data envelopment analysis can be used to determine effectiveness of bank branches.
Acknowledgment
This paper has been supported by the Hitit University Department of Scientific Research Project with the Project Number 19008 in 2016.
References
Boufounou, P. V. 1995, Evaluating bank branch location and performance: A case study. European
Journal of Operational Research, 87(2), 389-402
Hemmati, M., Dalghandi, S & Nazari, H. 2013, Measuring relative performance of banking industry using a DEA and TOPSIS, Management Science Letters , 3(2), 499-504.
Hensel, N. D. 2003, Strategic Management of Cost Efficiencies in Networks: Cross-country Evidence on European Branch Banking. European Financial Management, 9(3), 333-360.
Hirtle B. 2015, “The Impact of Network Size on Bank Branch Performance”, Federal Reserve Bank of
New York Staff Reports, no. 211, p.335.
(https://www.newyorkfed.org/medialibrary/media/research/staff_reports/sr211.pdf)
Hwang C. L. and K. Yoon 1981, Multiple Attributes Decision Making Methods and Applications, Berlin: Springer.
Ioannis E. T. 2010, Modeling bank branch profitability and effectiveness by means of DEA, International
Journal of Productivity and Performance Management, Vol. 59 Iss: 5, pp.432 - 451
Joseph C. P, Schaffnit C, 2004, Commercial branch performance evaluation and results communication in a Canadian bank––a DEA application, European Journal of Operational Research, Volume 156(3), Pages 719-735,
Kandemir T., Arıca N. Demirel 2013, A Comparative Study On CAMELS Performance Evaluation Model In Deposit Banks (2001-2010), Suleyman Demirel University The Journal of Faculty of
Economics and Administrative Sciences, Vol.18(1), 61-87
Manandhar, R. & J.C.S. Tang, 2002, The evaluation of bank branch performance using data envelopment analysis: A framework, The Journal of High Technology Management Research, Volume 13(1), Spring Pages 1-17
Paradi, J. C., & Zhu, H. 2013, A survey on bank branch efficiency and performance research with data envelopment analysis. Omega, 41(1), 61-79.
Paradi, J. C. & C. Schaffnit, 2004, Commercial branch performance evaluation and results communication in a Canadian bank––a DEA application, European Journal of Operational Research, Volume 156(3) Pages 719-735,
Sakinc I. and S. Acikalin 2015, Ranking of Turkish Banks According to Capital Adequacy and Profitability Ratios with the VIKOR Method, The International Journal of Business & Management, vol. 3, no. 4, pp. 329–335