c
T ¨UB˙ITAK
Raman Scattering in Layered CdInGaS
4
Aydın KULIBEKOV
Department of Physics, Mu˘gla University, 48000, Mu˘gla-TURKEY e-mail: [email protected]
Received 20.10.2003
Abstract
Raman scattering spectra of CdInGaS4 crystals grown by the chemical transport method were mea-sured at room and liquid-nitrogen temperatures. Band pairs at 29-38, 43-48 and 60-65 cm−1are reported for the first time. The origin of these bands is attributed to the Davydov doublets, arising due to a small interlayer interaction. Seventeen bands observed in the Raman spectra are assigned to normal modes on the basis of the C13v space group. This modification contains two layers per unit cell and do not have inversion symmetry. It is shown that the crystals grown from the vapor phase and by the Bridgman method belong to different modifications.
PACS: 78.20. -e; 78.30. —j; 78.30. Hv
Key Words: Raman scattering, layered crystals, CdInGaS4.
1.
Introduction
CdInGaS4was first synthesized by Shand [1]. The interest to study this material originates from its unique
physical properties which make it promising in optoelectronics. Among these are: high sensitivity in the UV and VIS range of spectra [2, 3]; intense red and blue photoluminescence at room and low-temperatures [1, 4]; stability in high temperature atmospheres and isotropic thermal expansion inspire evident layered structures [5, 6]; high birefringence in the visible and near IR range of spectra [7] and a laminated structure resulting in a possibility to grow and study different polytypes. The crystals grown by the vapor chemical transport reactions have C5
3v space group (SG), whereas melt-grown crystals may develop to C13v or D13d[8].
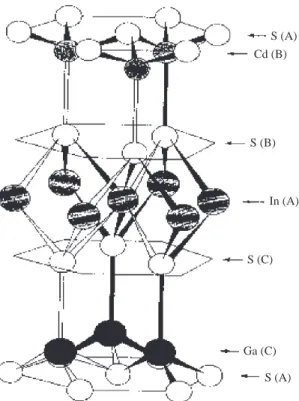
The atomic arrangement in one pack is shown in Figure 1 [3]. Vibrational properties of CdInGaS4were
published in a number of articles. Normal modes of vibrations observed in E⊥c and E|| c geometry’s (where E is the electric field vector of the incident electromagnetic wave, c is in the direction of the optical axis) by measuring the near-normal room-temperature reflectivity in the spectral range from 45 to 500 cm−1 were associated to the basis C1
3v SG [8]. Taking into consideration the results of [8] and the results of polarized
Raman scattering measurements, the authors of [9] came to conclusion that the Bridgman grown crystals may have D1
3d SG. Raman scattering spectrum; and IR reflectivity (measured only for E⊥c geometry) for
CdInGaS4 crystals grown by the chemical vapor transport reaction were reported in [10]. Observed phonon
modes were compared with those for cubic CdIn2S4 and were associated to the spinel-type structure with
the O7
h SG [10]. Of the results presented in [10], two points can be made: first, it is rightful to interpret the vibrational properties of layered crystals on the basis of the spinel structure; second, according to the irreducible representations of the Oh point group, there are 5 Raman (A1g, Eg and 3F2g and 4F1u IR)
active modes. Nine Raman modes observed in [10] are in contradiction with the prediction of the theory of symmetry for the Oh point group.
S (A) Cd (B) S (B) In (A) S (C) Ga (C) S (A)
Figure 1. The unit cell of CdInGaS4.
Table summarizes the vibrational frequencies of CdInGaS4crystal and their assignment given by different
authors. Some controversy arises when comparing the results given in Table for the frequency positions, number of lines and their assignment. At this stage it would seem that a new, high resolution Raman investigation of CdInGaS4is needed, with the determination of the peak frequencies using the deconvolution
method of the observed spectra.
In the present paper are presented the results of Raman scattering measurements of CdInGaS4crystals
grown by the chemical transport reactions method at room temperature and 77 K. Far IR transmission spectra of thin plates were also measured at room temperature and 77 K. The symmetry of modes are assigned using the data existing in literature.
2.
Experimental
Single crystals were grown by the chemical vapor method, using iodine as a transport element in an evacuated (10−5 Torr) quartz tubes. The color of crystals was transparent yellow. All obtained crystals were in the form of soft plane-parallel plates. The plates were easily cleaved into thin samples with mirror-like surfaces oriented right angle to the optical c-axis. Non-polarized Raman scattering spectra were excited with the 6471 ˚A line of a Kr+ laser in order to see as many lines as possible. The optical set-up consisted
of a SPEX 1401 double monochromator (1800 grooves/mm) equipped with a EDG 1433-c CCD cryogenic detector system. The spectra were recorded in back scattering geometry. The accuracy of measurements was±1 cm−1. The wave number peak positions of the bands were determined by fitting Lorentzian lines shapes to the experimental data. Raman spectra were measured at room and liquid-nitrogen temperatures. Frequencies of the IR active modes were also determined by transmission measurements of thin cleaved (∼50 µm) crystals in E⊥c geometry. For this purposes the vacuum grating spectrometer FIS-3 was used in
the spectral range of 50–400 cm−1. The resolution in the investigated range was not worse than 3 cm−1. Low-temperature cryostat was used for transmission measurements.
Table. Raman and IR active optical phonon frequencies ω0 (cm−1) and their symmetries for CdInGaS4 crystal at room temperature, according to different references. For each reference the space group (SG) is indicated in the respective column. The transverse (TO) and longitudinal (LO) mode assignments are indicated. The frequencies of the IR active phonons from the absorption measurements of thin plates are shown in brackets. m.a. denotes mode assignment. “sh”, “w”, “vw”, “md”, “st”, “vst” and “sts” denote the intensity of lines: “shoulder”, “weak”, “very weak”, “middle”, “strong”, “very strong” and “strongest,” respectively.
Polarized IR reflection Polarized Raman IR reflection, E⊥c Non-polarized Present work, non-and absorption scattering, geometry Raman scattering -polarized Raman
SG-C13v [8] SG-D13d [9] SG-O7h [10] SG-O7h [10] scattering
m.a. ω0 m.a. ω0 m.a. ω0 m.a. ω0 m.a. ω0
- - E1 g 17 - - - - E1 21 w - - E2g 27 - - - - E2 29 md - - E3 g 37 - - - 39 E2,1 38 md - - - E3 43 w - - - E3,1 48 w - - A1 1g 62 - - - - A1 60 w - - - A1,1 65 w - - - - F11uT O 80 - A2 82 w E1 (100) A2 1g 104 F11uLO 103 F32g 104 E4 102 sts (103) E2 (120) - - - - - - E5 120 sh (125) - - A21g 133 - - - -- - - - F21uT O 167 - - -- - E4 g 179 - - - -E3 T O 202 (202) - - - -A1 T O 208 - - - -E3 LO 217 - - - -- - E5g 221 - - - -E4 T O 235 (230) - - F21uLO 238 F22g 229 E6 230 sh E4 LO 244 - - - -A1 LO 252 A 4 1g 250 - - F22g 249 A3 250 vst E5T O 300 (298) A51g 304 F31uT O 292 F12g 298 E7 300 vst A2 T O 320 - - - -E5 LO 328 A 6 1g 330 F31uLO 325 - 330 E 8 329 vw A2 LO 334 - - F41uT O 338 - - - -E6 T O 348 (350) A71g 350 - - - -E6LO 366 - - F41uLO 365 A1g 369 E9 360 w A3LO 386 - - - A4 382 vw E6 g 401 - - - - A1g 394 A5 399 w
3.
Results and Discussion
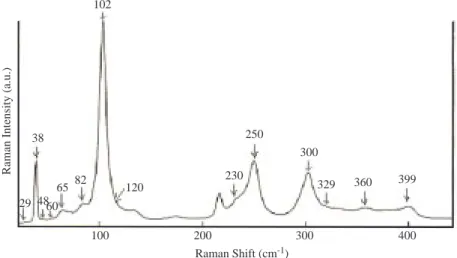
Figures 2, 3 and 4 show the room temperature Raman spectrum of CdInGaS4crystal taken in
to 77 K. At this temperature, the lines became narrower and their frequency peak positions shifted slightly to higher frequencies (∼ 1 to 1.5 cm−1). No new bands were observed at low temperature.
102 38 29 65 4860 82 120 230 250 300 360 329 399 100 200 300 400 Raman Shift (cm-1)
Raman Intensity (a.u.)
Figure 2. Raman spectrum of CdInGaS4.
38 29 65 48 60 82 120 100 200 Raman Shift (cm-1)
Raman Intensity (a.u.)
102
Figure 3. Raman spectrum of CdInGaS4.
230 250 300 360 329 399 300 400 Raman Shift (cm-1)
Raman Intensity (a.u.)
Such a behavior denotes that at least, in the temperature range 77–300 K, CdInGaS4 crystal does not
undergo the phase transition, as it was reported for ternary layered TlGaSe2-type crystals in [11].
Absorption measurements at 300 and 77 K showed that the lines at 103 and 125 cm−1 do not exhibit strong temperature dependence. With decreasing the temperature the peak positions of the transmission spectra for both lines shifted to higher frequency (∼ 1.5 cm−1), the lines became narrower and the trans-mission decreased to about 3% of the room temperature values. That is why we attributed these lines as arising due to one phonon resonance.
Eight Raman bands were observed in the low-frequency range (less than 100 cm−1). The lines at 17, 27, 37, 62 and 80 cm−1were reported also in [9] and [10], respectively. A pair of lines at 29-38, 43-48 cm−1 and 60-65 cm−1 are reported for the first time.
Raman scattering in CdInGaS4 under pressure showed that the lowest frequency mode at 17 cm−1 has
a highest value of the frequency shift parameter γj with pressure [ γj = (1/νj)(dνj/dP ), where νj is the frequency of jth phonon at ambient pressure, P is the pressure] and hence may be attributed to a rigid-layer (RL) mode [15]. Taking this result into consideration, we also attribute the lowest frequency phonon at 21 cm−1 (see Table) as a mode in which the entire layer vibrates rigidly out of phase with respect to its neighbor layer. The frequency of this mode gives information about the strength of the layer-layer interaction in CdInGaS4. Occurrence of the low-frequency RL mode voices in favor of the fact that the unit
cell of studied crystals consists of at least two layers. This fact excludes the one-layer modification reported in [12].
We may use the frequency of the lowest Raman mode at 21 cm−1 to estimate a frequency of splitting between a Davydov-pair in the similar way as it was done for GaSe [14]. According to [14], one can estimate the value δνj of splitting of the mode with frequency νj by means of the relation δνj = νRL2 /2νj, where νRL is the frequency of the RL mode. Estimated values are: for the mode at 29 cm−1, δν = 7.6 cm−1; for 43 cm−1, 5.1 cm−1; for 60 cm−1, 3.7 cm−1, for 82 cm−1, 2.7 cm−1, for 102 cm−1, 2.2 cm−1. With increasing phonon frequency this difference decreases and equals 0.7 cm−1 for phonons at 300 cm−1. From Table it is seen that the differences between the experimental values of observed pairs at 29-38 cm−1, 43-48 cm−1, 60-65 cm−1, and calculated according to the above given formulae, are in reasonable agreement. For this reason we attribute the above mentioned pairs to a Davydov pairs, which take place in the vibrational spectra of layered (molecular, chain) crystals which contain at least two layers per unit cell. Due to low intensities of these lines at low temperature, it was rather uncertain to determine the experimental values of the splitting at 77 K. But the tendency was towards a negligible increase the splitting at 77 K. As it is seen from Table calculated frequency separation of the Davydov pairs for the phonons at 82, 102 and 120 cm−1 is higher than the limit of the spectral resolution we used (1 cm−1). Despite this, we did not observe the pairs for these bands. It may be due to very low intensities of the other pair for these bands in the same way, as it was in case of GaSe [16]. Concerning the absence of the pair for modes at 230, 250, 300 cm−1 and higher frequencies, the calculations showed that the frequency separation of the Davydov pair for these phonons should be about 1 cm−1 (230 cm−1) and less (for 300 cm−1 mode δνj = 0.7 cm−1). These values lie just within the limit of the spectral resolution we used.
Let us consider the symmetry assignment of the modes. First, we assume that the crystal has one of C13v or C53v SG, as suggested in [1] and [12], respectively. According to these articles, a unit cell of crystal
contains one layer and the crystal structure does not posses inversion symmetry. If the crystal has one of the above-mentioned SG, then the phonon spectra should not reveal a RL mode. The assignment of lowest frequency mode at 21 cm−1 to a RL mode is in contradiction to one-layer modifications such as C1
3v and
C53v. D13d modification has a center of symmetry [9]. It is known, that in centrosymmetric crystals, due to
the exclusion principle, the doublets resulting from a small interaction between the layers are such that only one component is Raman active. We believe that the observation of both components of the doublets in Raman spectra is due to a lack of inversion symmetry in the crystal. In favor of this is also the fact that we have observed a weak second harmonic signal generated in crystals excited with a pulsed YAG:Nd3+ laser
operated at 1.06 µm. According to [9], the presence of inversion symmetry in the crystals grown by the Bridgman method was supported by the absence of the second harmonic signal in the crystals excited by a 1.06 µm of a pulsed YAG:Nd3+ laser. It seems that the crystals grown by the Bridgman and chemical vapor methods belong to different modifications. The situation looks the same in the case of layered GaSe; vapor-grown crystals have R3m SG, whereas melt grown predominantly contains D1
3h (ε-type).
The symmetry assignment given below takes into account also the results of polarized IR reflection (transmission) and Raman scattering measurements given in [8] and in [6, 9], respectively. We assume that the layer unit cell contains one formula (7 atoms) and in the C3v symmetry of the individual layer the
division of the 21 long-wavelength normal modes of vibrations is Γ ≡7A1+7E. Excluding A1+E acoustic
vibrations, we have 6A1+6E phonons, which are simultaneously active in IR and Raman spectra. Then we
assume that symmetry of crystal is C1
3v (which contains two layers) and it is the same as the symmetry of
the C3v layer. In this case the crystalline structure of the two layers may give rise to a small splitting of
each intralayer frequency into two bands—similar to a case for ε-GaSe, where the symmetry of layer is D3h
and the symmetry of the crystal is D1
3h. For the two-layer modification the result is simply Γ≡14A1+14E.
Excluding the acoustic vibrations, one has 13A1and 13 E-type simultaneously active IR and Raman active
phonons. A list of all observed modes is given in Table. As the reader may see, we observed 17 Raman and 2 IR active phonons predicted by the theory of symmetry. The back scattering geometry from the cleaved plain, which we used in our experiments, exhibits greater preference for the detection of E-type phonons over A-type phonons. Hence our observation of more E-type vibrations than A-type vibrations.
4.
Conclusion
Seventeen bands observed in the Raman scattering spectra of vapor grown crystals were assigned to normal modes on the basis of the C13v space group. This modification of the CdInGaS4 crystal does not
contain inversion symmetry and contains two layers per elementary unit cell. CdInGaS4crystals grown from
the vapor phase, and from the melt, belong to different crystallographic modifications. A pair of bands observed in the low-frequency range (below 100 cm−1) of CdInGaS4are attributed to the Davydov doublets,
arising due to a small interlayer interaction.
References
[1] W.A. Shand , J. Cryst. Growth, 5, (1969), 203.
[2] N.A. Moldovyan, S. I. Radautsan, V. Ya. Railyan, V. F. Zhitar and E. D. Arama, Solar Energy Mater., 15, (1987) 37.
[3] S. Ando, S. Endo, H. Nakanishi and T. Irie, IPAP Books, 1, (2001), 278.
[4] T. Irie, H. Miyashita and S. Endo, Nuovo Cimento, 2D, (1983), 2002.
[5] T. Toyoda, Y. Seki and M. Yabe Proc. Fourth. Japan Symp. on Thermophysical Properties, (1983), 47.
[6] T. Toyoda, H. Nakanishi, S. Endo and T. Irie Physics Letters, 107A, (1985) ,283.
[7] K.R. Allakhverdiev, R.I. Guliev, L.A. Kulevskii, A.D. Savelev, E. Yu. Salaev and V.V. Smirnov, Phys. Stat. Sol., A60, (1980), 309.
[8] K.R. Allakhverdiev, A.N. Abbasov, T.R. Mekhtiev and R. Kh. Nani, Phys. Stat. Sol., B94, (1979), 372.
[9] A.N. Abbasov, K.R. Allakhverdiev, T.R. Mekhtiev and R. Kh. Nani, Sov. Phys. Solid State, 23, (1981), 370.
[10] N.N. Syrbu, S.I. Radautsan, R.V. Cretu, V.E. Tezlevan, N.A. Moldoveanu, Cryst. Res. Technol., 31, (1996), 307.
[11] K.R. Allakhverdiev, S.S. Babaev, M M. Tagiev and M.M. Shirinov , Phys. Stat. Sol., B152, (1989), 317.
[12] T.R. Mekhtiev, Ph.D. Thesis, Institute of Physics, Academy Sciences of the Azerbaijan SSR, Baku, Azerbaijan, (1987).
[13] R. Zallen and M. Slade, Phys. Rev.., B24, (1974), 1627.
[14] T.J. Wieting, J.L. Verble, Phys. Rev., B5, (1972) ,1473.
[15] A.N. Abbasov, K.R. Allakhverdiev and S.S. Babaev, Sov. Phys. Solid State, 24, (1982), 1407.