ARTICLES
Flame Atomic Absorption Determination of Copper in Environmental
Water with Cloud Point Extraction
Using Isonitrosoacetophenone 2-Aminobenzoylhydrazone
Dilek Yıldız
a,* and Mustafa Demir
b,**
aMugla Sıtkı Koçman University, Research and Application Centre for Research Laboratories, Mugla, 48000 Turkey bAdnan Menderes University, Faculty of Arts and Science, Chemistry Department, Aydın, 09010 Turkey
*e-mail: [email protected]
**e-mail: [email protected]
Received October 22, 2016; revised November 16, 2017; accepted November 20, 2018
Abstract– A cloud point extraction method has been developed for preconcentration of Cu2+ ions. Tergitol 15-s-7 and Tergitol 15-s-9 are nonionic surfactants used to form micellar media. Taguchi method was used to optimize cloud point extraction conditions. Effects of foreign ions on the analyte recovery were also exam- ined. Certified reference material (CRM 1640a) was used to demonstrate accuracy of results. All results showed a good agreement with the certified values. The proposed method was successfully applied for sepa- ration and preconcentration of Cu2+ ions from river water samples. The detection limits obtained were 10 and 14 ng/mL in case of using Tergitol 15-s-7 and Tergitol 15-s-9, respectively.
Keywords: Tergitol 15-s-7, Tergitol 15-s-9, Taguchi method, cloud point extraction
DOI: 10.1134/S1061934819050022
Copper is one of the most essential elements to life in mammals but high doses of copper accumulation in the brain, skin, liver, pancreas and myocardium cause toxicological effects [1]. Thus, it is of great importance to determine trace amounts of copper in the environ- ment. One of the widely used methods to determine copper in environmental samples is f lame atomic absorption spectrometry (FAAS). However, two main problems of copper determination by FAAS are low levels of copper and complexity of the sample matrices [2, 3] In order to solve these problems, several precon- centration methods have been used for determination of trace copper amounts, including solid phase extraction [4], coprecipitation [3], electroanalytical technique [5] and on-line liquid–liquid extraction [6].
Cloud point extraction (CPE) based on separation and preconcentration is an effective analytical tool that can be used to improve detection limits and other analytical characteristics. There are many advantages in the use of CPE as a preconcentration method like low cost, safety and speed. Moreover, it is a simple procedure with high capacity to concentrate a broad range of analytes of widely varying nature with high recoveries and high concentration factors [7]. On the basis of CPE procedure lies the following phenome- non: aqueous solutions of some surfactants become turbid and separate into two isotropic phases under various conditions, such as the change in temperature
or pressure or addition of a suitable substance to the solution. The reason for the surfactant solution turbid- ity is its attaining the cloud point. This is a point where the original surfactant solution separates into a surfac- tant-rich phase of small volume that contains the ana- lyte or metal (organic or inorganic species) trapped by micellar structures and a bulk diluted aqueous phase [8].
Phase separation occurs due to the difference in density of the micelle-rich phase (surfactant-rich phase) and micelle poor phase [9]. Since the surfac- tant-rich phase relies on the densities of these two phases, it might not be on top [10].
Tergitol 15-s-X surfactants, such as Tergitol 15-s-7 and Tergitol 15-s-9, are mixtures of secondary alcohol ethoxylates developed as an alternative to traditionally used surfactants, such as nonylphenol ethoxylates, due to their biodegradable nature. Tergitol 15s-X surfac- tants provide excellent detergency, remarkable wetting properties, perfect ability of rinsing, low foam stabili- ties, versatile solubility characteristics, low pour points, low neat and aqueous viscosities, narrow aqueous gel ranges and rapid dissolution rates. Tergitol 15-s-X surfactants are chemically stable when diluted acids, bases and salts are present, and are quite similar to anionic, cationic and other nonionic surfac- tants. They are also soluble in water, chlorinated sol- vents and most organic solvents [10, 11].
Taguchi method is known to be an optimal approach in design of experiments that primarily selects a number of parameters like pH, concentration and volume of the sample and inputs them into one suitable plan table that has been designed by Taguchi with multiple levels for each parameter [12].
There are some differences between Taguchi meth- ods and other experimental design techniques: firstly, experience and knowledge of researchers in the selec- tion of correct parameters and their levels are of great importance for Taguchi methods. Secondly, in order to investigate effects caused by the interaction of parameters in an optimum number of experiments, orthogonal arrays are used in these methods. Thirdly, there is a requirement for researchers to set a target for their response variables in Taguchi designs and these responses can be: “smaller is better”, “larger is better” or “nominal is the best”. Lastly, in order to be able to understand variations from the desired values, the use of a loss function has been suggested by Taguchi meth- ods. Therefore, conversion of response data to the sig- nal to noise (S/N) ratio depends on whether the target is smaller, larger or nominal. Then, on the basis of the maximum values of S/N ratios, optimum values for each parameter are selected [13].
In the current study, prior to FAAS determination of Cu2+ ions, a cloud point extraction method was
developed for their preconcentration. Nonionic sur- factants, Tergitol 15-s-7 and Tergitol 15-s-9, were employed to provide micellar media. In order to deter- mine Cu2+ ions in environmental samples, it was nec-
essary to optimize cloud point extraction conditions and for this purpose Taguchi method was applied. Tergitol 15-s-7 and Tergitol 15-s-9 were used for the cloud point extraction of trace amounts of copper ions for the first time.
EXPERIMENTAL
Instrumentation. In order to determine Cu, GBC
f lame atomic absorption spectrometer (Avanta PM, Australia) with a hollow cathode lamp and air–acety- lene f lame was employed. To correct non-specific
absorbance, deuterium background correction was used. The instrumental parameters were as follows: wavelength—324.8 nm, lamp current—5 mA, band pass—0.2 nm. All the measurements related to pH were performed on a model WTW pH meter (Inolab, Germany) equipped with a combined glass–calomel electrode. Cloud point preconcentration experiments were carried out by using a thermostated bath (Nüve, BM 402) maintained at the desired temperature.
Reagents. All reagents used were of analytical
grade. Ultra-pure water (18.2 M∧) used was purified with a Milli-Q system (Human Power I Plus, Korea). To clean all the plasticware and glassware, they were soaked throughout one night in a 10% (v/v) nitric acid solution followed by rinsing with ultrapure water. The stock solutions of 1000 µg/mL copper were commer- cially obtained from Merck (Darmstadt, Germany). Working standard solutions were prepared daily by means of an appropriate dilution of the stock standard solution. In order to adjust the pH of the solution, hydrochloric acid and sodium hydroxide (2 M) were added drop by drop. Analytical grade hydrochloric acid, sodium hydroxide and sodium sulphate were obtained from Merck. Non-ionic surfactants, Tergitol 15-s-7 and Tergitol 15-s-9, were purchased from Sigma-Aldrich (Milwaukee, USA). In order to pre- pare the solution of a chelating agent, isonitrosoace- tophenone 2-aminobenzoylhydrazone (H2L) [14], appropriate amount of H2L was daily dissolved in
dimethyl sulfoxide (Merck). The viscosity of the sur- factant-rich phase was decreased by using methanol (Merck). To evaluate accuracy of the proposed method for Cu determination, certified reference material (sewage sludge-BCR 146-R) was used.
Procedure. In the previous studies, ethanolic solu-
tion was used for the preparation of a chelating agent, isonitrosoacetophenone 2-aminobenzoylhydrazone, and it was characterized by elemental analyses, infra- red spectroscopy, 1H nuclear magnetic resonance
spectroscopy, UV-Vis and magnetic susceptibility measurements [14]. NH2 H N N O N OH NH2 N N OH N OH
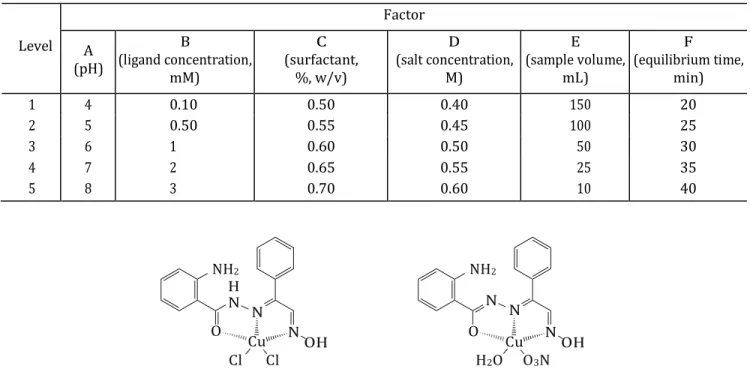
Table 1. Number of levels for each factor for Tergitol 15-s-7
NH2 H N N O Cu N OH NH2 N N O Cu N OH Cl Cl H2O O3N
Scheme 2. Suggested structures for the monomeric copper complexes.
For CPE preconcentration with Tergitol 15-s-7, pH values of the solutions (50 mL) containing Cu (10 µg), H2L (2 mM), 0.70% (w/v) Tergitol 15-s-7 and
salt (0.5 M) were adjusted to 7. To reach the cloud point temparature, the system was allowed to stand for about 40 min into a thermostated bath at 50°C.
For CPE preconcentration with Tergitol 15-s-9, pH values of the solutions (10 mL) containing Cu (10 µg), H2L (3 mM), 0.85% (w/v) Tergitol 15-s-9 and
salt (0.6 M) were adjusted to 7. To reach the cloud point temparature, the system was allowed to stand for about 40 min into a thermostated bath at 60°C.
For the settlement of the yielded micelles, the sur- factant-rich phase became viscous and was kept on top of the tube.
A pipette was used to remove the supernatant aque- ous phase and 1 mL of methanol solution containing
strength, equilibrium time and sample volume, affect- ing CPE of Cu2+ ions using Tergitol 15-s-7 and Tergi-
tol 15-s-9 were selected. The effect of each factor on the efficiency of Cu2+ ions extraction was investigated
at five different levels and optimized. Experiments were conducted by using these parameters. Taguchi technique was used for the design of the experiments and optimization of their results. In line with the “larger is better” approach, the copper concentration of the solution measured at the end of each experiment was taken as a response variable. The used level setting values of the main factors (A–F) and OA25 (56) matrix
employed to assign the considered factors are shown in Tables 1 and 2, respectively. These analyses were con- ducted using a Minitab 15 software. The data (yi) and
corresponding S/N ratios were calculated on the basis of Taguchi “larger is better” approach using Eq. (1): 1.0 M HNO3 was used to dissolve the surfactant-rich
phase, reduce the viscosity and facilitate introduction S/N Oranı = –10 log
(
1/Y 2)
/n . (1)in FAAS nebulizer.
Sample preparation. A water reference material
SRM 1640a was used to evaluate accuracy of the sys- tem. The samples of river water were gathered from the city of Muğla (Turkey) and stored in precleaned poly- ethylene bottles in a fridge at about 4°C in darkness. Prior to extraction through 0.45 μm pore-size cellu- lose acetate filters, samples were filtered.
RESULTS AND DISCUSSION
In this work, six different parameters, i.e. surfac- tant concentration, ligand concentration, pH, ionic
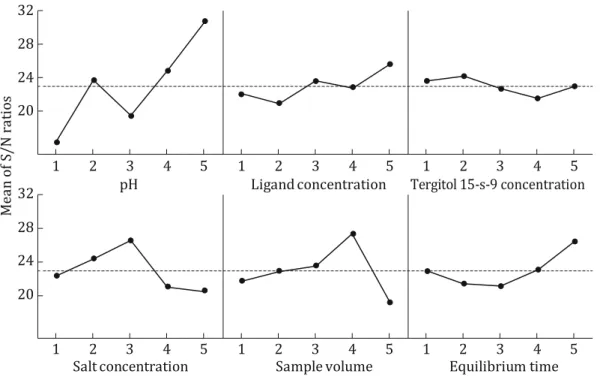
In order to calculate the effects of parameters, S/N ratio was averaged for each level. Figures 1, 2 illustrate average S/N ratios for each parameter at five levels for Tergitol 15-s-7 and Tergitol 15-s-9, respectively. According to the results, for both Tergitol 15-s-7 and Tergitol 15-s-9 pH is the most effective parameter, while surfactant concentration is the least effective.
Effects of various factors on cloud point extraction.
Influence of pH. There is a close association between
the cloud point extraction yield and pH at which com- plex formation takes place [15–21]. pH plays a very important role in the metal chelate formation and sub- sequent extraction [22]. Different pH values ranging
Level Factor A (pH) B (ligand concentration, mM) C (surfactant, %, w/v) D (salt concentration, M) E (sample volume, mL) F (equilibrium time, min) 1 4 0.10 0.50 0.40 150 20 2 5 0.50 0.55 0.45 100 25 3 6 1 0.60 0.50 50 30 4 7 2 0.65 0.55 25 35 5 8 3 0.70 0.60 10 40
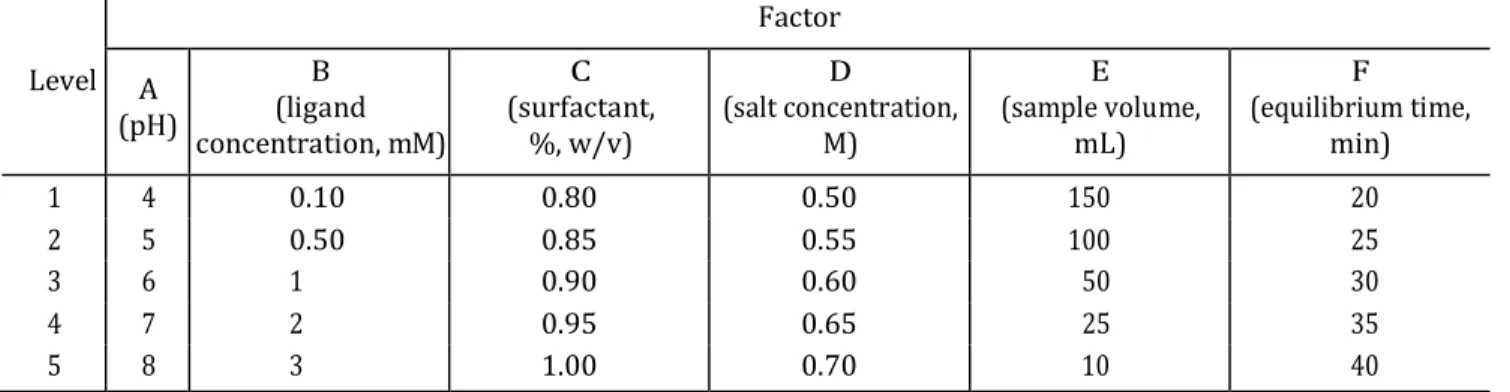
Table 2. Number of levels for each factor for Tergitol 15-s-9 Level Factor A (pH) B (ligand concentration, mM) C (surfactant, %, w/v) D (salt concentration, M) E (sample volume, mL) F (equilibrium time, min) 1 4 0.10 0.80 0.50 150 20 2 5 0.50 0.85 0.55 100 25 3 6 1 0.90 0.60 50 30 4 7 2 0.95 0.65 25 35 5 8 3 1.00 0.70 10 40
from 4 to 8 were adjusted in the aqueous solutions to extract copper using cloud point extraction method.
As can be seen from Figs. 1, 2, high extraction effi- ciencies for Tergitol 15-s-7 and Tergitol 15-s-9 were obtained at pH 7 and 8, respectively. Lower extraction efficiency in acidic media (<7) might be observed due to the fact that acylhydrazoneoxime ligand became protonated and H+ competed with copper ions for the
sites.
Influence of the ligand. In the present study, isoni-
trosoacetophenone 2-aminobenzoylhydrazone was selected as a ligand for CPE of copper ions for the first time. Initially, the experiments were carried out with- out H2L under optimal conditions. The recoveries of
the analytes were not quantitative. The experiments with various concentrations of H2L ranging from 0.1 to
3 mM were conducted in order to investigate the effect
of H2L on copper ions recovery. The copper com-
plexes formed with this multidentate complexing agent were 1 : 1 [14]. The extraction ability of acylhy- drazoneoxime ligand was examined by liquid–liquid extraction of selected transition metal cations (Cu2+,
Ni2+, Co2+, Cr3+, Hg2+, Zn2+, Cd2+ and Mn2+). The
ligand shows strong binding ability toward copper(II) ion [14]. Figures 1, 2 show variation in extraction effi- ciencies under different concentrations of H2L. At the
H2L concentration of 2 mM, the recovery value for
copper was found to be quantitative in case of using Tergitol 15-s-7, therefore, 2 mM H2L was selected for
the further experiments (Fig. 1). At the H2L concen-
tration of 3 mM, the recovery value was obtained to be quantitative for Tergitol 15-s-9, thus, it was selected as optimum for the further experiments (Fig. 2).
32 28 24 20
1 2 3 4 5 1 2 3 4 5 1 2 3 4 5
32 pH Ligand concentration Tergitol 15-s-7 concentration
28 24 20
1 2 3 4 5 1 2 3 4 5 1 2 3 4 5
Salt concentration Sample volume Equilibrium time
Fig. 1. Mean of S/N rations for Tergitol 15-s-7.
M ean o f S /N rat io s
32 28 24 20
1 2 3 4 5 1 2 3 4 5 1 2 3 4 5
32 pH Ligand concentration Tergitol 15-s-9 concentration
28 24 20
1 2 3 4 5 1 2 3 4 5 1 2 3 4 5
Salt concentration Sample volume Equilibrium time
Fig. 2. Mean of S/N rations for Tergitol 15-s-9.
Influence of the surfactant. The non-ionic surfac-
tant Tergitol 15-s-X (X = 7.9) was chosen due to its environmental safety, easy biodegradability and cost- effectiveness. In addition, it has not been used for pre- concentration of Cu2+ ions so far. Preconcentration
efficiencies were evaluated in the ranges of 0.50 to 0.70% and 0.80 to 1.00% (w/v) for Tergitol 15-s-7 and Tergitol 15s-9, respectively. Quantitative extraction was observed at the concentrations of 0.70 and 0.85% (w/v) for Tergitol 15-s-7 and Tergitol 15-s-9, respec- tively. Due to the inadequacy of the assemblies to entrap the hydrophobic complex quantitatively, the extraction efficiency of the complex might be low at lower concentrations of the surfactant [23].
Influence of salt addition. It seems likely that the
presence of salt in the solution affects the efficiency of extraction and volume of the surfactant-rich phase. The effect of various salts on the cloud point of non- ionic surfactants has been studied earlier [10, 23]. The most common additives are electrolytes and second- ary surfactants, such as anionic or cationic surfactants. The electrolytes which can increase the cloud point cause a “salt-in” effect. On the other hand, those which depress the cloud point cause a “salt-out” effect. The effect of several kinds of electrolytes, including NaCl, NaI, Na2SO4, MgCl2 and CaCl2, on
the cloud points of the Tergitol 15-s-7 micellar solu- tions has been studied in [10, 24]. The results reveal that among the salts lowering the cloud point of Tergi- tol 15-s-7 Na2SO4 is the most effective in decreasing
the cloud point.
The extent to which salt concentration affects the extraction efficiency was investigated in the presence of known concentrations of Na2SO4 (for Tergitol 15-s-
7 from 0.40 to 0.60 M and for Tergitol 15-s-9 from 0.50 to 0.70 M). Figures 1 and 2 show how the extraction efficiency changes under the influence of various con- centrations of Na2SO4. As a result of the increase in
the salt concentration, at first the signal increased and then significantly decreased. This effect might be attributed to the increase in surface charge with the increase in salt concentration, which leads to changes in the surfactant molecular architecture and micelle formation process as well [25].
Due to the smaller critical micelle concentration (CMC) of Tergitol 15-s-7 compared to Tergitol 15-s-9, less amount of salt was used in experiments with Tergi- tol 15-s-7.
Influence of sample volume. Cu2+ ions are present in
real samples, such as water, biological f luids, etc., at very low concentrations. Hence, for determination of trace copper concentrations, it is of great importance to know the sufficient volume of the sample solution. To determine the optimum volume of the sample solu- tion, 10, 25, 50, 100 and 150 mL of sample solutions containing fixed amount of the analyte (10 μg of Cu2+
ions) were examined. Moreover, the effect of changes in the volume of the sample on extraction efficiency was also investigated. Due to the fixed amount of the analyte, an increase in the volume of the sample led to the decreased concentration of the analyte.
M ean o f S /N rat io s
Table 3. Effect of foreign ions in case of using Tergitol 15-s-7 0.4 mg/L of copper. The limit of detection (LOD) was determined under the optimal experimental condi- tions. The LOD was obtained from the following equation:
cLOD = K bsb/m, (2)
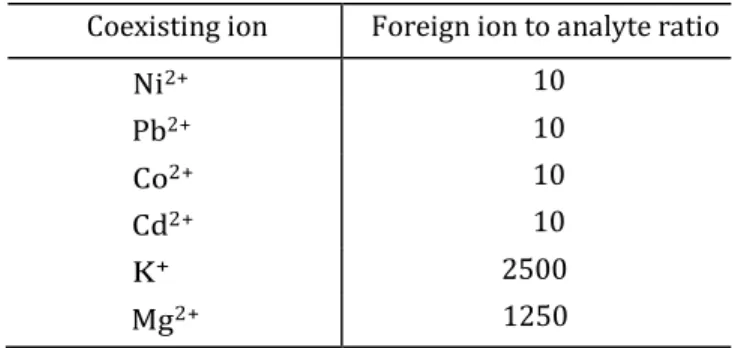
Table 4. Effect of foreign ions in case of using Tergitol 15-s-9
Coexisting ion Foreign ion to analyte ratio
Ni2+ 10 Pb2+ 10 Co2+ 10 Cd2+ 10 K+ 2500 Mg2+ 1250
As seen in Figs. 1 and 2, high extraction efficiency was obtained at 50 and 10 mL for Tergitol 15-s-7 and Tergitol 15-s-9, respectively.
Influence of equilibration time. Trace amount of
copper ions with high efficiency must be preconcen- trated in a short time. In this study, the time range of 20‒40 min was used to investigate the effect of equili- bration time. As a result, 40 min was found to be the optimal time required for the maximum extraction efficiency for both Tergitol 15-s-7 and Tergitol 15-s-9.
Interferences. The extent to which foreign ions are
influential on determination of copper ions by the proposed method was examined. The results are pre- sented in Tables 3, 4. Ion was regarded as an interfer- ent, when it led to a variation in the absorbance of the sample larger than ± 5%. The results show that by means of the proposed method, tolerance to high amounts of various alkaline, alkaline earth and transi- tion metal ions could be enhanced.
Analytical application. Good linearity was yielded
for calibration curves obtained with preconcentration within the concentration range between 0.01 and
where m is the slope of the calibration graph, Kb is the
numerical value of 3 and sb is the standard deviation of
ten replicates of the blank measurement. The LODs obtained were 10 (V = 50 mL) and 14 (V = 10 mL) ng/mL in case of using Tergitol 15-s-7 and Tergitol 15-s-9, respectively. The relative standard deviations were 2.8% (n = 7, c = 0.2 mg/L) and 2.9% (n = 7, c = 1.0 mg/L) for Tergitol 15s-7 and Tergitol 15-s-9, respectively.
Accuracy of the proposed CPE preconcentration procedure for determination of trace copper amounts was evaluated through the analysis of certified refer- ence material, the results are reported in Table 5. Ana- lytical values obtained for copper by the present meth- odology are in a good agreement with the certified value.
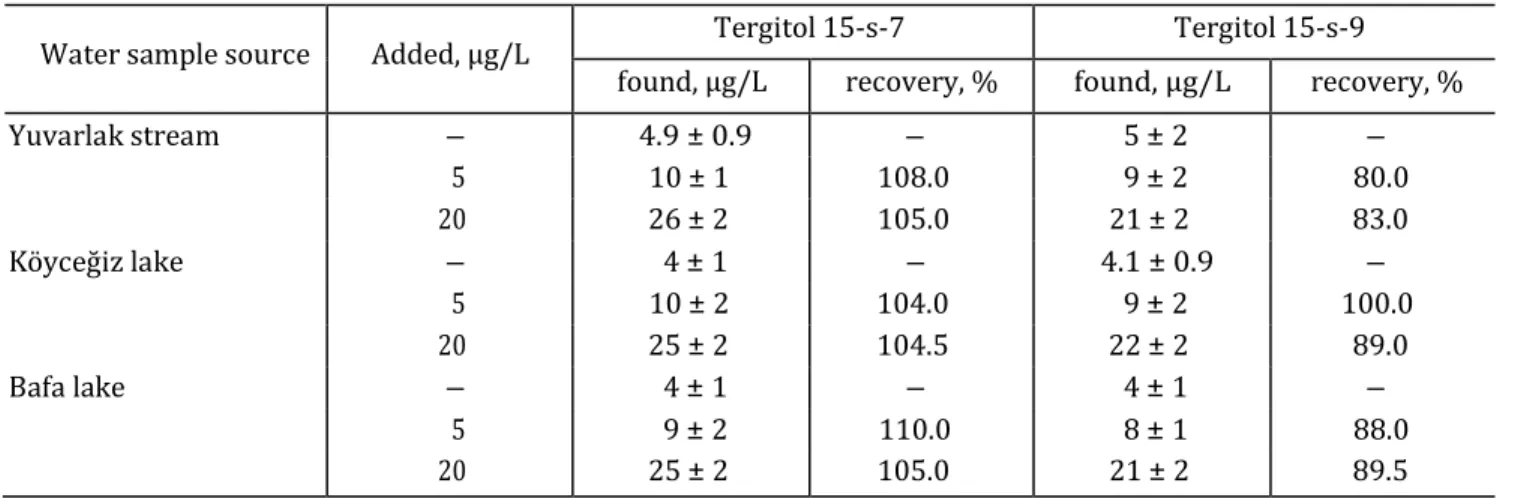
Determination of copper in different real samples.
The reliability of this methodology was tested by applying it to samples of stream and lake waters. The results presented in Table 6 show that the proposed methodology can be successfully applied to determine copper in various real samples.
CONCLUSIONS
The findings of the current study have proved that Taguchi orthogonal array of OA25 type can be success-
fully applied to analyze the results and determine opti- mum conditions to extract Cu2+ ions. Isonitrosoace-
tophenone 2-aminobenzoylhydrazone, as a ligand, Tergitol 15-s-7 and Tergitol 15-s-9, as non-ionic sur- factants, were used for the cloud point extraction of traces copper ions for the first time. With the use of this method, ppb levels of copper can be determined in real samples by FAAS, the instrument that can be found in many laboratories. The characteristics of the developed approach were compared with total reflec- tion X-ray f luorescence spectroscopy ‒ a powerful analytical tool for determination of trace elements in various matrices. In contrast to the standard method there is no danger of volatile elements loss because the sample preparation procedure does not involve any evaporation step. A disadvantage of the electrochemi-
Table 5. Results of the determination of copper in certified reference material (SRM 1640a) (n = 3)
Certified concentration, μg/kg
Tergitol 15-s-7 Tergitol 15-s-9
found, μg/kg recovery, % found, μg/kg recovery, %
85.1 ± 0.5 86.9 ± 0.8 102.2 87.5 ± 0.7 102.9
Coexisting ion Foreign ion to analyte ratio
Ni2+ 12.5 Pb2+ 12.5 Co2+ 12.5 Cd2+ 12.5 K+ 5000 Mg2+ 1250
Table 6. The amount of copper (μg/L) in real samples (n = 3)
cal enrichment method is that it is time consuming (usually between 20 min and 2 h) and not applicable to all elements [5].
REFERENCES
1. Vijayaraghavan, K., Palanivelu, K., and Velan, M.,
Bioresour. Technol., 2006, vol. 97, p. 1411.
2. Shemirani, F., Jamali, M.R., Kozani, R.R., and Salavati-Niasari, M., Sep. Sci. Technol., 2006, vol. 41, p. 3065.
3. Saraçoglu, S., Soylak, M., and Elçi, L., Talanta, 2003, vol. 59, p. 287.
4. Pourreza, N. and Zavvar Mousavi, H., Anal. Chim.
Acta, 2004, vol. 503, p. 279.
5. Ritschel, A., Wobrauschek, P., Chinea, E., Grass, F., and Fabjan, Ch., Spectrochim. Acta, Part B, 1999, vol. 54, p. 1449.
6. Anthemidis, A.N., Zachariadis, G.A., Farastelis, C.G., and Stratis, J.A., Talanta, 2004, vol. 62, p. 437. 7. Bosch Ojeda, C. and Sánchez Rojas, F., Anal. Bioanal.
Chem., 2009, vol. 394, no. 3, p. 759.
8. de Almeida Bezerra, M., Arruda, M.A.Z., and Costa Ferreira, S.L., Appl. Spectrosc. Rev., 2005, vol. 40, p. 269.
9. Nakagawa, T. and Shinoda, K., Colloidal Surfactants:
Some Physicochemical Properties, vol. 12 of Physical Chemistry, Hutchinson, E. and Van Rysselberghe, P.,
Eds., New York: Academic, 1963.
10. Swe, M.M., M.S. (Eng.) Thesis, Singapore: Natl. Univ. Singapore, 2003.
11. Union Carbide Corporation, Product Information of Tergitol Surfactants, 1993.
12. Comakli, Ö., Comakli, K., Ozdemir, N., and Yilmaz, M., J. Therm. Sci. Technol. (Tokyo, Jpn.), 2010, vol. 30, p. 113.
13. Keleş, O., Hydrometallurgy, 2009, vol. 95, p. 333. 14. Gup, R. and Giziroğlu, E., Spectrochim. Acta, Part A,
2006, vol. 65, p. 719.
15. Surme, Y., Narin, I., Soylak, M., Yuruk, H., and Dogan, M., Microchim. Acta, 2007, vol. 157, p. 193. 16. Li, J., Liang, P., Shi, T.Q., and Lu, H.B., At. Spectrosc.,
2003, vol. 24, p. 169.
17. Ghaedi, M., Spectrochim. Acta, Part A, 2007, vol. 66, p. 295.
18. Shemirani, F., Abkenar, S.D., and Jamali, M.R.,
Indian J. Chem., Sect. A: Inorg., Bio-inorg., Phys., Theor. Anal. Chem., 2005, vol. 44, p. 1211.
19. Chen, J.R. and Teo, K.C., Anal. Chim. Acta, 2001, vol. 450, p. 215.
20. Shemirani, F., Baghdadi, M., Ramezani, M., and Jamali, M.R., Anal. Chim. Acta, 2005, vol. 534, p. 163. 21. Yamini, Y., Faraji, M., Shariati, S., Hassani, R., and Ghanbarian, M., Anal. Chim. Acta, 2008, vol. 612, p. 144.
22. Ghaedi, M., Shokrollahi, A., Niknam, K., and Soylak, M., Sep. Sci. Technol., 2009, vol. 44, p. 773. 23. Goel, S., J. Colloid Interface Sci., 1998, vol. 212, p. 604. 24. Bai, D.S., Li, J.L., Chen, S.B., and Chen, B.H., Envi-
ron. Sci. Technol., 2001, vol. 35, p. 3936.
25. Ghambarian, M., Yamini, Y., Saleh, A., Shariati, S., and Yazdanfar, N., Talanta, 2009, vol. 78, p. 970.
Water sample source Added, μg/L Tergitol 15-s-7 Tergitol 15-s-9
found, μg/L recovery, % found, μg/L recovery, %
Yuvarlak stream – 4.9 ± 0.9 – 5 ± 2 – 5 10 ± 1 108.0 9 ± 2 80.0 20 26 ± 2 105.0 21 ± 2 83.0 Köyceğiz lake – 4 ± 1 – 4.1 ± 0.9 – 5 10 ± 2 104.0 9 ± 2 100.0 20 25 ± 2 104.5 22 ± 2 89.0 Bafa lake – 4 ± 1 – 4 ± 1 – 5 9 ± 2 110.0 8 ± 1 88.0 20 25 ± 2 105.0 21 ± 2 89.5