*Corresponding author
E-mail address: [email protected]
1
Effect of Sintering Temperature on High Strain Rate Deformation of
Tungsten Heavy Alloys
Hakan Hafızoğlu a,b, Nuri Durlu a,*
a TOBB University of Economics and Technology, Department of Mechanical Engineering,
06560 Ankara, Turkey
b TUBITAK Defense Industries Research and Development Institute, P.K. 16 06261 Mamak Ankara,
Turkey
Abstract
In this study, the effect of sintering temperature on high strain rate deformation behavior of 93W-5.6Ni-1.4Fe, 93W-4.67Ni-2.33Fe and 93W-3.5Ni-3.5Fe alloys was investigated. The samples were sintered at 1460ºC, 1480ºC and 1500ºC for 20 minutes under hydrogen and for 10 minutes under Argon atmosphere Mechanical properties of samples were determined by compression tests. Taylor impact tests were done by using a single stage gas gun with three different impact velocities of 200, 225 and 250 m/s. Taylor impact simulations were obtained via LS-DYNA with Finite Element Method (FEM) (with three element sizes) and Smooth Particle Hydrodynamics (SPH) method to compare the simulation and test results in terms of crack formation and propagation behavior and final diameter and length of the sample. The results showed that increase in the sintering temperature led to higher ductilities which in turn enhanced the plasticity and change the fracture behavior of samples during impact tests. Simulation results showed that decreasing of element sizes in FEM models led to more accurate description of fracture behavior of samples in impact tests. The study also showed that, the dimensions obtained from the simulations with SPH method were closer to the test sample than FEM method.
Keywords: Tungsten heavy alloys, high strain rate deformation, Taylor impact test, fracture modes
2 1. Introduction
Tungsten heavy alloy is a two phase composite material which comprises spherical tungsten particles embedded in ductile matrix phase [1-3]. Tungsten heavy alloys are widely used in ballistic applications due to their excellent mechanical properties [4-6]. The type and amount of alloying elements as well as processing affect the mechanical and high strain rate properties of tungsten heavy alloys [7,8]. Therefore, determining the high strain rate deformation behavior of tungsten heavy alloys is of great importance for ballistic applications.
Taylor impact test is a straightforward way to investigate the dynamic yield stress and fracture behavior of the materials by impacting of a flat nosed cylinder projectile to a rigid anvil [9-11]. This impact test was first established by Taylor in 1948 [12]. It is also useful test method to verify and modify the material parameters in constitutive models used in numerical analyses [13].
In the analysis of Taylor impact test, one dimensional analytical model is used to determine the dynamic properties of the cylindrical sample [14,15]. In this model no material movement normal to the impact axis is taken into account. Therefore, the simple measurement of the dimensions of the cylinder before and after the impact is an adequate way for investigating the dynamic properties of the materials and for comparing the test and numerical results. In the open literature, most of the investigations about Taylor impact test were performed for obtaining the constitutive model parameters by comparing the test and numerical analysis results and just a few of the studies were carried out to observe the fracture mechanisms in numerical analysis [9,11,16]. Five deformation and fracture modes in Taylor impact tests have been reported in the literature for different materials [17-19]. These are: (I) mushrooming with large plastic deformation and without any cracks on the exterior surface of the sample, (II) tensile splitting caused by hoop tensile strains (III) shear cracking with/without tensile splitting occurred at the periphery of the impact face, (IV) petalling occurred in ductile materials with
3
high impact velocities and (V) fragmentation occurred in hard projectiles. The deformation and fracture modes observed after Taylor impact tests for various materials were summarized in Table 1.
Table 1.
Deformation and fracture modes oberved after Taylor impact tests.
Material Impact Velocity (m/s)
Deformation and Fracture Mode
Reference
Ti-6Al-4V 145-214 Plastic Deformation [13]
217-236 Cracks
244-306 Fragmentation
Hard 38CrSi (53.1 HRC) 202 Mushrooming [18]
240-263 Shear Cracking 301-600 Fragmentation Soft 38CrSi (19.3 HRC) 154-254 Mushrooming 304-425 Shear Cracking 485-543 Petalling
Unhardened Arne Tool Steel 127-297 Mushrooming [20] HRC 40 Arne Tool Steel 133-247 Mushrooming
270 Tensile Splitting 298-357 Shear Cracking HRC 52 Arne Tool Steel 124 Mushrooming
133-135 Shear Cracking 154-296 Fragmentation Aluminium 1100 158-216 358-385 484-575 Mushrooming Tensile Split./Petaling Sunflower-like petalling [21] Aluminium 6061 200 Mushrooming 238-336 Shear Cracking 401-519 Shear Petalling
Aluminium 2A12 243 Mushrooming
266-317 Shear Cracking 344-371 Fragmentation
The deformation and fracture behavior of a material during high velocity impact is very complex for numerical simulation. At high velocity impact conditions, compressive shock waves are formed through the material [22,23]. The compressive waves reach the rear surface of the sample and reflect back as tension waves. The interaction of these compression and tension waves results deformation in the sample and different fracture modes are observed.
4
Mesh based Finite Element Method is widely used in order to simulate deformation and fracture (e.g. shear bands) in ballistic applications such as high velocity impact [24]. However, this method has some difficulties to simulate when dealing with large deformations, fragmentations, crack initiation and propagation in the sample due to large deformation of the finite elements. Mesh-free methods were improved to solve these kinds of problems. One of the Lagrangian methods is Smoothed Particle Hydrodynamics which was developed in 1977. This method is based on the generating discrete points instead of finite elements in the domain which enables to simulate larger distortions [23]. However, SPH method has some instability about tensile regime and some lack of consistency in simulations [25,26].
There have been several numerical studies of predicting the deformation and the fracture modes of the materials which were observed in the experiments. Chen et al. [16], observed a good correlation between the test and numerical analysis results of a 45 steel and they also obtained different fracture modes by considering the stress triaxiality history after the impact of the specimen. Rohr et al. [27], determined the Johnson-Cook strength model parameters by a combination of tension tests which were performed at different strain rates and elevated temperature, Taylor impact tests and plate impact tests with VISAR technique. They used Autodyn 2D to make a validation of the model parameters without any fracture modeling. Kruszka et al. [28], studied about obtaining Johnson-Cook strength model parameters of Al 6063 duralumin by comparing the Taylor impact test and numerical analysis. The numerical analyses were conducted by using Autodyn and an algorithm was used to compare the test and numerical results. Stevens and Batra [29], simulated the Taylor impact tests to observe adiabatic shear bands in a mixture of Fe-W-Ni particles, pure tungsten and tungsten heavy alloy. According to the simulation results, adiabatic shear bands were observed in the mushroomed regions of tungsten heavy alloys. However, no such shear bands were initiated at mushroomed regions for tungsten and Fe-Ni-W mixture. Teng et al. [9], numerically studied the fracture
5
mechanisms in Taylor impact tests by ABAQUS/Explicit in the velocity range of 240 m/s-600 m/s. Mushrooming, petalling and shear cracking were observed in the samples. The results were compared with the experimental results from the open literature. Petalling were observed in more ductile samples with higher velocity while shear cracking took place in more brittle materials. Bresciani et al. [23], studied simulating the fragmentation of tungsten heavy alloy projectile and alumina target after impacting by both SPH mesh-free method and erosion model which leads deletion of finite elements.
The main objective of this study is to investigate the effect of the sintering temperature on the dynamic deformation of three W-Ni-Fe alloys by Taylor impact tests and compare the test results with numerical analyses.
2. Experimental
Tungsten heavy alloy samples were prepared by mixing elemental tungsten, nickel and iron powders in turbula mixer with 67 rpm for 45 minutes. The composition of powder mixtures with different Ni:Fe ratio is given in Table 2. The powder mixtures were cold pressed isostatically under 300 MPa. The green samples were sintered at three different sintering temperatures (1460ºC, 1480ºC and 1500ºC) for 20 minutes under H2 and 10 minutes under Ar
atmospheres.
Table 2.
The composition of powder mixtures.
Powder W (wt.%) Ni (wt.%) Fe (wt.%) Ni/Fe Ratio 1 93 3.5 3.5 1 2 93 4.67 2.33 2 3 93 5.6 1.4 4
Densities of the samples were measured by Archimedes water immersion technique by xylene with a density of 0.86 g/cm3. In order to determine liquidus and solidus temperatures of the
6
alloys, differential scanning calorimetry (DSC) analyses were made from room temperature to 1500°C with the heating rate of 10°C/min. Quasi-static compression testing was performed with a crosshead speed of 0.005 mm/sec at room temperature. The cylindrical test samples of 8 mm in diameter and 16 mm in height were placed between two hardened steels lubricated by Teflon sheets. The tests were stopped at 90 kN due to the testing machine capability. Average of the yield strength of three compression testing samples were measured and reported. Microstructural characterization of samples was carried by scanning electron microscopy (6400 JSM, JEOL Ltd. Japan). Jefferson Method was utilized in measuring average particle size [30].
Prior to Taylor impact testing sintered cylindrical Taylor impact test samples were machined to the dimensions of 8 mm in diameter and 24 mm in length. Taylor impact tests were performed with three different impact velocities (200 m/s, 225 m/s and 250 m/s) by using single stage gas gun. Nitrogen was used for the acceleration of the samples. Samples were placed in the polycarbonate sabots to reduce the friction in the gas gun barrel. The sample after machining and the polycarbonate sabots are shown in Figure 1. A steel cylinder with the hardness of ~45HRC was used as a rigid target in Taylor impact tests. In the tests an optical device was used for velocity measurement.
7 3. Results and Discussion
3.1.Materials Characterization
The solidus and liquidus temperatures of the samples were determined by differential scanning calorimetry. The liquid formation during sintering began at 1453°C, 1462°C and 1475°C for the alloys with nickel to iron ratios of 1, 2, 4 respectively. Sintering at 1460°C led to partial liquid phase formation in the alloy with Ni/Fe=1. Increasing the sintering temperature to 1480°C led to liquid phase formation for the alloys with Ni/Fe ratios of 1 and 2. For the alloy with Ni/Fe ratio 4, at these two sintering temperatures no sufficient liquid phase formed is formed for liquid phase sintering. Sintering at 1500°C caused grain coarsening for all three alloys compared to lower sintering temperatures. The scanning electron micrographs of the alloys after three different sintering are given in Figure 2. As shown in Fig. 2(c), for the alloy with Ni/Fe=4 , sintering at 1460°C and 1480°C did not lead to the formation of rounded tungsten grains embedded in the matrix due to lack of sufficient liquid phase. However, with increasing sintering temperature to 1500°C, sufficient liquid phase formation occurred in the samples which resulted rounded tungsten grains embedded in the ductile matrix. As shown in Table 3, the increase in sintering temperature from 1460°C to 1500°C also led to increase in grain size of all the samples. The highest tungsten grain size was observed in the alloy 93W-5.6Ni-1.4Fe at 1500°C. This is due to the higher tungsten solubility in this alloy which increases coarsening of tungsten grains in the microstructure [31]. During liquid phase sintering, the increase in nickel content leads to higher solubility of tungsten in the binder matrix which increases the tungsten grain coarsening in the microstructures [31].
8 Table 3.
Grain size of the samples with different Ni/Fe ratio at three different sintering temperatures.
Ni/Fe Ratio 1 2 4
Sintering Temp. 1460ºC 1480ºC 1500ºC 1460ºC 1480ºC 1500ºC 1460ºC 1480ºC 1500ºC Grain
Size 8.8±0.5 16.2±0.3 19.03±0.2 8.4±0.3 18.6±0.3 23.3±0.2 7.6±0.2 9.3±0.2 25.8±1.4
(a) (b) (c)
Figure 2. SEM micrographs of the samples with different Ni/Fe ratio at three different sintering temperatures (400x) (a) 93W-3.5Ni-3.5Fe (b) 93W-4.67Ni-2.33Fe (c)
9
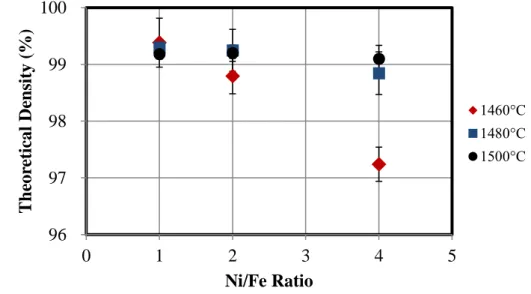
The amount of liquid formation with three sintering temperatures led to various density values of the samples with three nickel to iron ratios. The densities of samples are given in Figure 3. For the alloy with nickel to iron ratio 1, the density values did not change considerably with sintering temperature. Sintering at 1480°C and 1500°C, enhanced the density values for the alloys with nickel to iron ratios of 2 and 4 due to sufficient liquid phase formation during sintering. After sintering at 1500°C, the theoretical density values of the samples reached about 99.5%. The density values for all samples were in the range of 17.28-17.62 g/cm3. Density variations occurred due to change in nickel to iron ratio and sintering temperature. In a study by Humail et al. [32], a density of 17.52 g/cm3 was reported for the alloy 93W-4.9Ni-2.1Fe which was sintered at 1500°C which is very close for the value obtained in this study.
Figure 3. Density of the 93W-Ni-Fe alloys with different Ni:Fe ratio and sintering temperature.
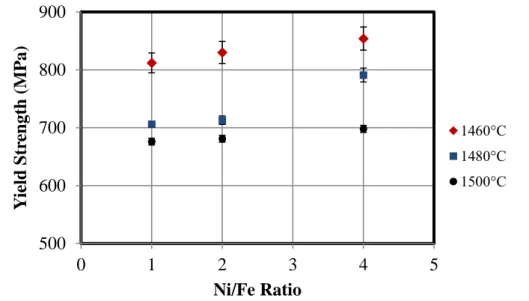
The compression test results are given in Figure 4. The increase of sintering temperature decreased the yield strength values of the samples due to coarsening of tungsten grains. In a study by Ryu et al. [33], mechanical properties of solid state sintered and liquid phase sintered tungsten heavy alloys were determined. In solid state sintered samples, higher yield strength
96 97 98 99 100 0 1 2 3 4 5 T h eor etic al De n sity ( % ) Ni/Fe Ratio 1460°C 1480°C 1500°C
10
values were obtained due to finer microstructure of the samples. It has also been reported that in liquid phase sintered tungsten heavy alloys, deformation started in the binder phase and this also led to lower yield strength values. The yield strength values of the samples after sintering at 1460°C were determined to be around 810-850 MPa. Sintering at 1500°C decreased the yield strength values to the range of 675-700 MPa which was around 17% less for all the samples. In addition to the sintering temperature effect on yield strength, the composition also affected the strength values. The yield strengths increased as the nickel to iron ratio increased. In a study by Caldwell et al. [34], the yield strengths of 93 wt.% tungsten alloys with nickel to iron ratios of 2.3, 4, 8 and 15 were determined via compression and tension tests. The yield strength values reported after compression tests varied between 710-772 MPa due to the increase in Ni/Fe ratio. The increase in nickel to iron ratio enhances the tungsten solubility in the binder matrix that leads to higher mechanical properties [34]. This increase in the mechanical properties such as compressive and tensile strength can be attributed to solid solution hardening due to the higher tungsten solubility in the binder phase [35].
Figure 4. Yield strength of 93W-Ni-Fe alloys with different Ni:Fe ratio and sintering temperature. 500 600 700 800 900 0 1 2 3 4 5 Y ield S tr en gth (M P a) Ni/Fe Ratio 1460°C 1480°C 1500°C
11
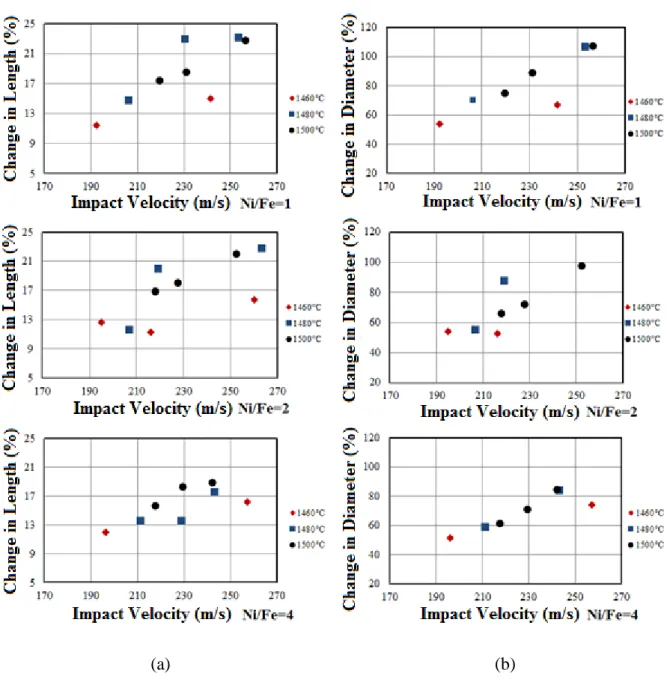
The change in length and in diameter of samples after Taylor impact tests are given in Figure 5. Dimensions of some of the samples could not be measured due to fragmentation during high velocity impact. As shown in Fig. 5, the increase in the sintering temperature and impact velocity enhanced the change in length and diameter of the samples due to higher ductility of samples sintered at 1480°C and 1500°C.
(a) (b)
Figure 5. The change in the dimension of Taylor samples with impact velocity and sintering temperature. (a) change in length (b) change in diameter.
12
The change in sintering temperature altered the fracture behavior of the samples during Taylor impact tests. Nickel to iron ratio did not influence the fracture modes and behaviors dramatically. The main factor for the variation of the fracture mode was the sintering temperature. The fracture modes of 93W-4.67Ni-2.33Fe samples sintering at 1460°C after Taylor impact tests are given for three impact velocities in Figure 6. At low impact velocities tensile splitting at the periphery of the impact face is the major fracture mode, whereas at higher impact velocities fracture into two pieces near the mushroomed region or shattering of the sample to many pieces was observed due to the lower ductility of the samples.
(a) (b) (c)
Figure 6. Change in fracture modes of 93W-4.67Ni-2.33Fe sample with impact velocity. Samples were sintered at 1460C (a) 195 m/s (b) 216 m/s (c) 260 m/s.
The major fracture mode for the samples sintered at 1480°C and 1500°C was a combination of tensile splitting and shear crack. The fracture modes occurred at two test samples are shown in Figure 7. The shear cracks which were formed along 45° direction at the impact surfaces might be due to adiabatic shear band formation after rapid temperature rise during high velocity impact. In a study by Couque et al. [36], adiabatic shear bands along 45° direction were observed in tungsten heavy alloys with 90 wt.% tungsten after symmetric Taylor tests as a function of impact velocity. Wei et al. [37], studied the effect of stress conditions in tungsten heavy alloys (93W), which were controlled by sample geometry, on formation of adiabatic
13
shear bands. They observed the formation of adiabatic shear bands by changing the sample geometry in dynamic compression tests.
(a) (b)
Figure 7. Crack formation at the impact surfaces of (a) 93W-5.6Ni-1.4Fe sample sintered at 1480°C, impact velocity 243 m/s (b) 93W-3.5Ni-3.5Fe sample sintered at 1500°C, impact
velocity 220 m/s.
The increase in impact velocity from 200 m/s to 225 m/s or to 250 m/s caused shattering for some of the samples sintered at 1480°C due to excessive impact loading. Less shattering behavior was observed after increasing the impact velocity for the samples sintered at 1500°C due to better ductility and lower yield strength. The comparison of the shattering behavior of the samples is given in Figure 8. As can be seen in this figure, the number of the pieces after shattering of the samples sintered at 1500°C was less than the samples sintered at 1480°C.
(a) (b)
Figure 8. The shattering behavior of 93W-3.5Ni-3.5Fe samples (a) with 230 m/s impact velocity, sintering at 1480°C (b) with 231 m/s impact velocity, sintered at 1500°C.
14 3.2.Numerical Modelling
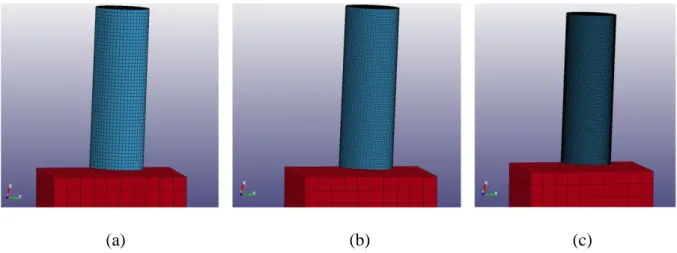
Taylor impact simulations were performed via LS-DYNA 3D solver with FEM and SPH Lagrange methods to compare results of tests and simulations. In the first part of the study, element size effect on the deformation and fracture behavior of 93W-3.5Ni-3.5Fe alloy sintered at 1480ºC with impact velocity of 206 m/s was determined by FEM method. Three element sizes were used in this part of the simulations. The first element size (coarser) of the sample was 0.5x0.5x0.5 mm with nearly 12500 elements. The second element size (coarse) was 0.25x0.25x0.25 mm with approximately 290000 elements. And the third one was the finest elements with the mesh size (fine) of 0.125x0.125x0.125 mm and with approximately 2360000 elements. The rigid 20x20x20 mm cubic target was modelled with 1000 elements with the element size of 2x2x2 mm. In Figure 9, the meshed Taylor samples with three element sizes and the rigid target is shown. Erosion model for the Taylor sample was used in order to delete the finite elements when the element fails due to impact loading in the simulations.
(a) (b) (c)
Figure 9. FEM models for Taylor impact test with element sizes of (a) 0.5x0.5x0.5 mm (b) 0.25x0.25x0.25 mm (c) 0.125x0.125x0.125 mm.
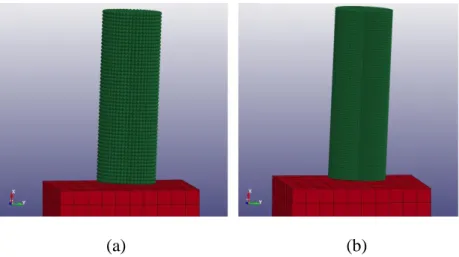
In the second part of the simulation studies, the Taylor impact test sample was modelled with SPH mesh-free Lagrange method to compare the results with FEM results. The numerical modelling of the sample with SPH method is shown in Figure 10. Two FEM models with the
15
element sizes of 0.5x0.5x0.5 mm (coarser) and 0.25x0.25x0.25 mm (coarse) were converted into SPH method to compare the results and the computation time. While creating SPH model from FEM models, particles were placed at every nodes of the FEM models. The coarser FEM model was converted into SPH model with 12887 particles and the other SPH model which was created from coarse meshed FEM model was created with 298372 particles. Erosion model was not used in this part of the study.
(a) (b)
Figure 10. SPH models for Taylor impact test (a) coarse model (b) fine model.
In both FEM and SPH methods, the material model for Taylor sample was modelled with 15-JOHNSON_COOK and the material model for the target was modelled with 20-RIGID. Johnson-Cook material model is widely used for metals in order to model under various strain, strain rate and temperature [38]. This model describes the stress in terms of stress hardening, strain rate and the temperature with the following equation:
σ = [A + Bepn] [1 + Cln
eṗ
e0̇ ] [1 − T∗m]
(1)
A is the yield stress of the sample, B and n are the parameters for strain hardening, C is the parameter for strain rate dependence, T* is homologous temperature and m is parameter for
16
The damage for the Taylor sample was modelled with Johnson-Cook failure law [39]. The damage occurred in one element during the simulation is given by:
D = ∑ep
ef (2)
where ep is the increment of equivalent plastic strain during an integration cycle, ef is the
equivalent strain to fracture. Failure in the element occurs when D equals to 1.0. The equation for the equivalent strain at fracture is given by
ef= [D
1+ D2exp (D3σ ∗
)] [1 + D4lnė∗][1 + D
5T∗] (3)
where, D1, D2, D3, D4, D5 are empirical coefficients for the materials. As given in Equation (3),
equivalent strain at fracture is a function of stress, strain rate and temperature. The material parameters used in the simulations for Johnson-Cook strength and failure models are given in Table 4. The strength model parameters (A, B, n C, m) were obtained by optimization studies [40]. Failure model parameters (D1-D5) taken from Bresciani et al. [23] were optimized by
comparing the test and simulation results.
Table 4.
Johnson-Cook parameters used in the simulations. G (kPa) A (kPa) B (kPa) n C m
17
1.6e8 2e6 1.77e5 0.1368 0.0195 1.6972
D1 D2 D3 D4 D5
0 0.33 -3 0.042 0
In the simulations which were performed with FEM method, the contact between the Taylor sample and target was described with AUTOMATIC_SINGLE_SURFACE. In SPH simulations, the contact between sample and the target was identified with AUTOMATIC_NODES_TO_SURFACE. The Johnson-Cook strength model needs equation of state in the simulations. The GRUNEISEN equation of state was used for both simulations with FEM and SPH methods.
Reducing the element size in FEM model showed more realistic fracture behavior especially for modelling the shear fracture at the impact surface of the sample. In the models with the element sizes of 0.25x0.25x0.25 mm and of 0.5x0.5x0.5 mm, only tensile splitting fracture mode was observed. Reducing the element size eliminate the element erosion effect at the impact surface. Hence, real fracture modes could be observed by separation of elements in the simulation results. The comparison of the element sizes in FEM modelling is illustrated in Figure 11.
18
(c) (d)
Figure 11. The shear fracture progress of simulations with decreasing element sizes (a) 0.5x0.5x0.5 mm element size (b) 0.25x0.25x0.25 mm element size (c) 0.125x0.125x0.125 mm element size (d) 93W-3.5Ni-3.5Fe sample sintered at 1480°C and impact velocity of 206
m/s.
The two SPH models did not indicate obviously the shear fracture that was occurred in the test sample as can be seen in Figure 12. However, it would be possible to observe shear cracks with more particles in the SPH model also with more calculation time. The model with more particles indicated better results in order to simulate the deformation behavior in the transition region from undeformed to mushroomed part of test sample.
19
Figure 12. The deformation behavior of SPH models with different numbers of particles (a) 12887 particles (b) 298372 particles (c) 93W-3.5Ni-3.5Fe sample sintered at 1480°C and
impact velocity of 206 m/s.
The final diameter and length measurements after impact were compared with test sample to determine which model represented the actual results more accurately. The difference in the final diameter and length of test results with the models are listed in Table 5. As seen in Table 5, the decrease in element sizes of FEM models diminished the difference of final diameter and length of models compared with test sample. The closest results between FEM models were obtained from the model with the smallest elements. The SPH models indicated similar results with FEM models. The increase in particle number showed better results in terms of simulating the final diameter and length. The model which was closest to the final dimensions of the test sample was determined from the SPH model with higher number of particles.
Table 5.
The difference of diameter and length values of models compared with test results.
Method FEM SPH
Element and Particle Size Coarser Coarse Fine Coarser Coarse
Difference in Diameter (%) 7.6 6.7 5.7 -4.5 -0.7
Difference in Length (%) -3 -2.9 -2.7 1 -0.8
The simulation results were also evaluated in terms of calculation times of both FEM and SPH methods. The results are given in Table 6. According to the results, the decrease in element size increased the calculation times in FEM methods. Like FEM results, the increase in the number of SPH particles enhanced the calculation time dramatically. As can be seen from Table 6, the SPH method was more expensive than FEM method.
Table 6.
20
Method FEM SPH
Element and Particle Size Coarser Coarse Fine Coarser Coarse
Calculation Time (seconds) 8 379 12524 55 2100
4. Conclusions
In this study, the effect of sintering temperatures on the dynamic behavior of tungsten heavy alloys was determined by Taylor impact tests with several impact velocities. The results obtained from this study are:
The increase in sintering temperature of tungsten heavy alloys enhanced the % change in diameter and length of the samples due to the increase in ductility by liquid phase formation and coarsening of tungsten particles in microstructures. The alteration of sintering temperature from 1460ºC to 1480ºC or to 1500ºC resulted excessive change in the amount of deformation of samples.
The increase in sintering temperature altered the fracture mechanisms of the samples. The main fracture mode for the samples sintered at 1460°C was tensile splitting which occurred at the periphery of the samples. The fracture mode of the samples sintered at 1480°C and 1500°C was a combination of tensile splitting and shear cracking. The variation of nickel to iron ratio had nearly no influence on the fracture behavior of the samples.
Simulation results showed that a good correlation in the representing of shear fracture behavior of the test sample was obtained from FEM modelling which has 0.125x0.125x0.125 mm element size. SPH mesh-free method results were more accurate in modelling the final dimensions of the test sample but more expensive in terms of calculation time than the FEM models.
21
This study was supported by TOBB University of Economics and Technology and TUBITAK SAGE. The authors acknowledge Dr. N. Kaan Çalışkan from TUBİTAK SAGE for his contributions in sintering studies.
References
[1] Kim, D. K., Lee, S., & Baek, W. H. (1998). Microstructural study of adiabatic shear bands formed by high-speed impact in a tungsten heavy alloy penetrator. Materials Science and
Engineering: A, 249(1), 197-205. DOI: 10.1016/S0921-5093(98)00565-6.
[2] Zhang, Z. H., Wang, F. C., Li, S. K., & Wang, L. (2006). Deformation characteristics of the 93W–4.9 Ni–2.1 Fe tungsten heavy alloy deformed by hydrostatic extrusion. Materials Science
and Engineering: A, 435, 632-637. DOI:10.1016/j.msea.2006.07.134.
[3] Durlu, N., Çalişkan, N. K., & Bor, Ş. (2014). Effect of swaging on microstructure and tensile properties of W–Ni–Fe alloys. International Journal of Refractory Metals and Hard
Materials, 42, 126-131. DOI: 10.1016/j.msea.2015.05.046.
[4] Hong, S. H., Ryu, H. J., Kim, E. P., & Baek, W. H. (1998). Impact and dynamic deformation behaviour of mechanically alloyed tungsten-based composites. In Key Engineering
Materials (Vol. 141, pp. 453-462). Trans Tech Publications. DOI:
10.4028/www.scientific.net/KEM.141-143.453.
[5] Rittel, D., & Weisbrod, G. (2001). Dynamic fracture of tungsten base heavy alloys. International journal of fracture, 112(1), 87-98. DOI: 10.1023/A:1013581609836. [6] Arnold, W. (2004, July). Tungsten Heavy Alloys for Multiple Impact Applications. In AIP
Conference Proceedings (Vol. 706, No. 1, pp. 1319-1322). AIP. DOI: 10.1063/1.1780480.
[7] Guo, W., Liu, J., Yang, J., & Li, S. (2011). Effect of initial temperature on dynamic recrystallization of tungsten and matrix within adiabatic shear band of tungsten heavy
22
alloy. Materials Science and Engineering: A, 528(19), 6248-6252.
DOI:10.1016/j.msea.2011.04.080.
[8] Kiran, U. R., Panchal, A., Sankaranarayana, M., Rao, G. N., & Nandy, T. K. (2015). Effect of alloying addition and microstructural parameters on mechanical properties of 93% tungsten
heavy alloys. Materials Science and Engineering: A, 640, 82-90. DOI:
10.1016/j.msea.2015.05.046.
[9] Teng, X., Wierzbicki, T., Hiermaier, S., & Rohr, I. (2005). Numerical prediction of fracture in the Taylor test. International Journal of Solids and Structures, 42(9), 2929-2948. DOI:10.1016/j.ijsolstr.2004.09.039.
[10] Eakins, D. E., & Thadhani, N. N. (2006). Instrumented Taylor anvil-on-rod impact tests for validating applicability of standard strength models to transient deformation states. Journal
of Applied Physics, 100(7), 073503. DOI: 10.1063/1.2354326.
[11] Xiao, X., Zhang, W., Wei, G., Mu, Z., & Guo, Z. (2011). Experimental and numerical investigation on the deformation and failure behavior in the Taylor test. Materials & Design, 32(5), 2663-2674. doi:10.1016/j.matdes.2011.01.016.
[12] Taylor, G. (1948, September). The use of flat-ended projectiles for determining dynamic yield stress. I. Theoretical considerations. In Proceedings of the Royal Society of London A:
Mathematical, Physical and Engineering Sciences (Vol. 194, No. 1038, pp. 289-299). The
Royal Society. DOI: 10.1098/rspa.1948.0081.
[13] Yu, R. E. N., Tan, C. W., Zhang, J., & Wang, F. C. (2011). Dynamic fracture of Ti-6Al-4V alloy in Taylor impact test. Transactions of Nonferrous Metals Society of China, 21(2), 223-235. DOI: 10.1016/S1003-6326(11)60703-6.
[14] Jones, S. E., Maudlin, P. J., & Foster, J. C. (1997). An engineering analysis of plastic wave propagation in the Taylor test. International Journal of Impact Engineering, 19(2), 95-106.DOI: 10.1016/S0734-743X(96)00020-6.
23
[15] Rule, W. K., & Jones, S. E. (1998). A revised form for the Johnson–Cook strength model. International Journal of Impact Engineering, 21(8), 609-624. DOI10.1016/S0734-743X(97)00081-X.
[16] Gang, C. H. E. N., & HUANG, X. (2016). Simulation of deformation and fracture characteristics of a 45 steel taylor impact specimen. Engineering Transactions, 64(2), 225-240. [17] Woodward, R. L., O'donnell, R. G., & Flockhart, C. J. (1992). Failure mechanisms in
impacting penetrators. Journal of Materials Science, 27(23), 6411-6416.
DOI10.1007/BF00576292.
[18] Xiao, X., Zhang, W., Wei, G., & Mu, Z. (2010). Effect of projectile hardness on deformation and fracture behavior in the Taylor impact test. Materials & Design, 31(10), 4913-4920. DOI:10.1016/j.matdes.2010.05.027.
[19] Rakvåg, K. G., Børvik, T., & Hopperstad, O. S. (2014). A numerical study on the deformation and fracture modes of steel projectiles during Taylor bar impact tests. International
Journal of Solids and Structures, 51(3), 808-821.DOI: 10.1016/j.ijsolstr.2013.11.008.
[20] Rakvåg, K. G., Børvik, T., Westermann, I., & Hopperstad, O. S. (2013). An experimental study on the deformation and fracture modes of steel projectiles during impact. Materials &
Design, 51, 242-256.DOI:1 0.1016/j.matdes.2013.04.036.
[21] Wei, G., Zhang, W., Huang, W., Ye, N., Gao, Y., & Ni, Y. (2014). Effect of strength and ductility on deformation and fracture of three kinds of aluminum alloys during Taylor
tests. International Journal of Impact Engineering, 73, 75-90.DOI:1
0.1016/j.ijimpeng.2014.06.011.
[22] Mabssout, M., Herreros, M. I., & Idder, H. (2016). Predicting dynamic fracture in viscoplastic materials using Taylor-SPH. International Journal of Impact Engineering, 87, 95-107.DOI: 10.1016/j.ijimpeng.2015.06.015.
24
[23] Bresciani, L. M., Manes, A., Romano, T. A., Iavarone, P., & Giglio, M. (2016). Numerical modelling to reproduce fragmentation of a tungsten heavy alloy projectile impacting a ceramic tile: Adaptive solid mesh to the SPH technique and the cohesive law. International Journal of
Impact Engineering, 87, 3-13.DOI:1 0.1016/j.ijimpeng.2015.10.003.
[24] Idder H., Mabssout M., Herreros M I., (2015). The Taylor-SPH meshfree method:Basis
and validation, Applied and Computational Mathematics, 4(4) , 286-295. DOI:
10.11648/j.acm.20150404.17.
[25] Swegle, J. W., Hicks, D. L., & Attaway, S. W. (1995). Smoothed particle hydrodynamics
stability analysis. Journal of computational physics, 116(1), 123-134.DOI:
10.1006/jcph.1995.1010.
[26] Belytschko, T., Krongauz, Y., Dolbow, J., & Gerlach, C. (1998). On the completeness of meshfree particle methods. International Journal for Numerical Methods in Engineering, 43(5), 785-819.DOI: 10.1002/(SICI)1097-0207(19981115)43:5<785::AID-NME420>3.0.CO;2-9. [27] Rohr, I., Nahme, H., Thoma, K., & Anderson, C. E. (2008). Material characterisation and constitutive modelling of a tungsten-sintered alloy for a wide range of strain rates. International
Journal of Impact Engineering, 35(8), 811-819. DOI: 10.1016/j.ijimpeng.2007.12.006.
[28] Kruszka, L., Janiszewski, J., & Grązka, M. (2012). Experimental and numerical analysis of Al6063 duralumin using Taylor impact test. In EPJ Web of Conferences (Vol. 26, p. 01062). EDP Sciences. DOI: 10.1051/epjconf/20122601062.
[29] Stevens, J. B., & Batra, R. C. (1998). Adiabatic shear bands in the Taylor impact test for a
WHA rod. International Journal of Plasticity, 14(9), 841-854.
DOI:10.1016/S0749-6419(98)00026-6.
[30] Vander Voort GF. (1984). Grain size measurement, Practical Applications of Quantitative Metallography, ASTM STP 839, In; McCall JL, Steele Jr. JH, editors, Philadelphia, American Society of Testing and Materials, p 85-131. DOI: 10.1520/STP30216S.
25
[31] Bose, A., & German, R. M. (1990). Matrix composition effects on the tensile properties of tungsten-molybdenum heavy alloys. Metallurgical and Materials Transactions A, 21(5), 1325-1327. DOI: 10.1007/BF02698261.
[32] Humail, I. S., Akhtar, F., Askari, S. J., Tufail, M., & Qu, X. (2007). Tensile behavior change depending on the varying tungsten content of W–Ni–Fe alloys. International Journal
of Refractory Metals and hard materials, 25(5), 380-385. DOI:10.1016/j.ijrmhm.2006.12.003.
[33] Ryu, H. J., Hong, S. H., & Baek, W. H. (2000). Microstructure and mechanical properties of mechanically alloyed and solid-state sintered tungsten heavy alloys. Materials Science and
Engineering: A, 291(1), 91-96. DOI: 10.1016/S0921-5093(00)00968-0.
[34] Caldwell, S. G. (1992). Variation of Ni/Fe Ratio in W-Ni-Fe Alloys: a Current Perspective. Proceedings of the First International Conference on Tungsten and Tungsten Alloys, Metal Powder Industries Federation 89-96.
[35] Knipling, K. E., Zeman, G., Marte, J. S., Kelly, S. M., & Kampe, S. L. (2004). Effect of dissolved tungsten on the deformation of 70Ni-30Fe alloys. Metallurgical and Materials
Transactions A, 35(9), 2821-2828.DOI: 10.1007/s11661-004-0229-y.
[36] Couque, H., Nicolas, G., & Altmayer, C. (2007). Relation between shear banding and penetration characteristics of conventional tungsten alloys. International journal of impact
engineering, 34(3), 412-423. DOI:10.1016/j.ijimpeng.2005.12.003.
[37] Wei, Z., Yu, J., Li, J., Li, Y., & Hu, S. (2001). Influence of stress condition on adiabatic shear localization of tungsten heavy alloys. International journal of impact engineering, 26(1), 843-852.DOI: 10.1016/S0734-743X(01)00137-3.
[38] Johnson, G. R., & Cook, W. H. (1983, April). A constitutive model and data for metals subjected to large strains, high strain rates and high temperatures. In Proceedings of the 7th
26
[39] Johnson, G. R., & Cook, W. H. (1985). Fracture characteristics of three metals subjected to various strains, strain rates, temperatures and pressures. Engineering fracture
mechanics, 21(1), 31-48.DOI: 10.1016/0013-7944(85)90052-9.
[40] Kaya M. (2011). Unpublished results, The Scientific and Technological Research Council of Turkey, Defense Industries Research and Development Institute, Ankara, Turkey.