World Journal of
Clinical Oncology
World J Clin Oncol
2020 February 24; 11(2): 43-109
W J C O
World Journal of
Clinical Oncology
Contents
Monthly Volume 11 Number 2 February 24, 2020
REVIEW
43 Can epigenetic and inflammatory biomarkers identify clinically aggressive prostate cancer?
Santos PB, Patel H, Henrique R, Félix A
53 Objective response rate assessment in oncology: Current situation and future expectations
Aykan NF, Özatlı T
SYSTEMATIC REVIEW
74 Abdominal metastases of primary extremity soft tissue sarcoma: A systematic review
Smolle MA, Leithner A, Bernhardt GA
CASE REPORT
83 Pancreatic adenocarcinoma with early esophageal metastasis: A case report and review of literature
Burns EA, Kasparian S, Khan U, Abdelrahim M
91 Pituitary carcinoma: Two case reports and review of literature
Xu L, Khaddour K, Chen J, Rich KM, Perrin RJ, Campian JL
103 Metastatic clear cell renal cell carcinoma in isolated retroperitoneal lymph node without evidence of primary tumor in kidneys: A case report
Contents
World Journal of Clinical Oncology
Volume 11 Number 2 February 24, 2020
ABOUT COVER
Editorial Board Member of World Journal of Clinical Oncology, Tian Yang, MD, Associate Professor, Attending Doctor, Surgeon, Surgical Oncologist, Teacher, Department of Hepatobiliary Surgery, Eastern Hepatobiliary Surgery Hospital, Second Military Medical University, Shanghai 200438, ChinaAIMS AND SCOPE
The primary aim of World Journal of Clinical Oncology (WJCO, World J ClinOncol) is to provide scholars and readers from various fields of oncology with a platform to publish high-quality basic and clinical research articles and communicate their research findings online.
WJCO mainly publishes articles reporting research results and findings obtained in the field of oncology and covering a wide range of topics including art of oncology, biology of neoplasia, breast cancer, cancer prevention and control, cancer-related complications, diagnosis in oncology, gastrointestinal cancer, genetic testing for cancer, gynecologic cancer, head and neck cancer, hematologic malignancy, lung cancer, melanoma, molecular oncology, neurooncology, palliative and supportive care, pediatric oncology, surgical oncology, translational oncology, and urologic oncology.
INDEXING/ABSTRACTING
The WJCO is now abstracted and indexed in PubMed, PubMed Central, Emerging Sources Citation Index (Web of Science), China National Knowledge Infrastructure (CNKI), China Science and Technology Journal Database (CSTJ), and Superstar Journals Database.RESPONSIBLE EDITORS FOR
THIS ISSUE
Responsible Electronic Editor: Lu-Lu Qi
Proofing Production Department Director: Xiang Li
NAME OF JOURNAL
World Journal of Clinical Oncology
ISSN ISSN 2218-4333 (online) LAUNCH DATE November 10, 2010 FREQUENCY Monthly EDITORS-IN-CHIEF Hitendra Patel
EDITORIAL BOARD MEMBERS
https://www.wjgnet.com/2218-4333/editorialboard.htm EDITORIAL OFFICE
Ruo-Yu Ma, Director
PUBLICATION DATE
February 24, 2020
COPYRIGHT
© 2020 Baishideng Publishing Group Inc
INSTRUCTIONS TO AUTHORS https://www.wjgnet.com/bpg/gerinfo/204 GUIDELINES FOR ETHICS DOCUMENTS https://www.wjgnet.com/bpg/GerInfo/287
GUIDELINES FOR NON-NATIVE SPEAKERS OF ENGLISH https://www.wjgnet.com/bpg/gerinfo/240
PUBLICATION MISCONDUCT https://www.wjgnet.com/bpg/gerinfo/208 ARTICLE PROCESSING CHARGE https://www.wjgnet.com/bpg/gerinfo/242 STEPS FOR SUBMITTING MANUSCRIPTS https://www.wjgnet.com/bpg/GerInfo/239 ONLINE SUBMISSION
https://www.f6publishing.com
© 2020 Baishideng Publishing Group Inc. All rights reserved. 7041 Koll Center Parkway, Suite 160, Pleasanton, CA 94566, USA E-mail: [email protected] https://www.wjgnet.com
W J C O
World Journal of
Clinical Oncology
Submit a Manuscript: https://www.f6publishing.com World J Clin Oncol 2020 February 24; 11(2): 53-73
DOI: 10.5306/wjco.v11.i2.53 ISSN 2218-4333 (online)
REVIEW
Objective response rate assessment in oncology: Current situation
and future expectations
Nuri Faruk Aykan, Tahsin Özatlı
ORCID number: Nuri Faruk Aykan (0000-0002-5472-3218); Tahsin Özatlı (0000-0002-8563-3856).
Author contributions: Aykan NF and Özatlı T performed the literature search; and Aykan NF wrote the manuscript.
Conflict-of-interest statement: No potential conflicts of interest and no financial support are associated with this manuscript.
Open-Access: This article is an open-access article that was selected by an in-house editor and fully peer-reviewed by external reviewers. It is distributed in accordance with the Creative Commons Attribution
NonCommercial (CC BY-NC 4.0) license, which permits others to distribute, remix, adapt, build upon this work non-commercially, and license their derivative works on different terms, provided the original work is properly cited and the use is non-commercial. See:
http://creativecommons.org/licen ses/by-nc/4.0/
Manuscript source: Invited manuscript
Received: May 5, 2019
Peer-review started: May 8, 2019
First decision: October 23, 2019
Revised: November 5, 2019
Accepted: November 28, 2019
Article in press: November 28, 2019
Published online: February 24, 2020
P-Reviewer: Kim HS, Melo F, Patel H
S-Editor: Yan JP
Nuri Faruk Aykan, Tahsin Özatlı, Department of Medical Oncology, Istinye University Medical School, Bahcesehir Liv Hospital, Istanbul 34510, Turkey
Corresponding author: Nuri Faruk Aykan, MD, Professor, Department of Medical Oncology, Istinye University Medical School, Bahcesehir Liv Hospital, Atatürk Bulvarı, No. 6, Istanbul 34510, Turkey. [email protected]
Abstract
The tumor objective response rate (ORR) is an important parameter to demonstrate the efficacy of a treatment in oncology. The ORR is valuable for clinical decision making in routine practice and a significant end-point for reporting the results of clinical trials. World Health Organization and Response Evaluation Criteria in Solid Tumors (RECIST) are anatomic response criteria developed mainly for cytotoxic chemotherapy. These criteria are based on the visual assessment of tumor size in morphological images provided by computed tomography (CT) or magnetic resonance imaging. Anatomic response criteria may not be optimal for biologic agents, some disease sites, and some regional therapies. Consequently, modifications of RECIST, Choi criteria and Morphologic response criteria were developed based on the concept of the evaluation of viable tumors. Despite its limitations, RECIST v1.1 is validated in prospective studies, is widely accepted by regulatory agencies and has recently shown good
performance for targeted cancer agents. Finally, some alternatives of RECIST were developed as immune-specific response criteria for checkpoint inhibitors. Immune RECIST criteria are based essentially on defining true progressive disease after a confirmatory imaging. Some graphical methods may be useful to show longitudinal change in the tumor burden over time. Tumor tissue is a tridimensional heterogenous mass, and tumor shrinkage is not always symmetrical; thus, metabolic response assessments using positron emission tomography (PET) or PET/CT may reflect the viability of cancer cells or
functional changes evolving after anticancer treatments. The metabolic response can show the benefit of a treatment earlier than anatomic shrinkage, possibly preventing delays in drug approval. Computer-assisted automated volumetric assessments, quantitative multimodality imaging in radiology, new tracers in nuclear medicine and finally artificial intelligence have great potential in future evaluations.
Key words: Objective response rate; Tumor shrinkage; World Health Organization
criteria; Response Evaluation Criteria in Solid Tumors; Immune Response Evaluation Criteria in Solid Tumors criteria; Early tumor shrinkage; Depth of response; Waterfall
L-Editor: A
E-Editor: Liu MY
plot; Spider plot; Swimmer plot
©The Author(s) 2020. Published by Baishideng Publishing Group Inc. All rights reserved.
Core tips: The tumor objective response rate is an important parameter in oncology.
World Health Organization and Response Evaluation Criteria in Solid Tumors (RECIST) are anatomic response criteria developed mainly for cytotoxic chemotherapy. These criteria may not be optimal for biologic agents, some disease sites, and some regional therapies. Some alternatives of RECIST were developed, but RECIST v1.1 is validated in prospective studies, is widely accepted by regulatory agencies and has recently shown good performance for targeted cancer agents. The newest alternatives of RECIST are immune-specific response criteria for checkpoint inhibitors. Metabolic response assessments using positron emission tomography (PET) or PET/computed tomography may reflect the viability of cancer cells or functional changes that occur after anticancer treatments.
Citation: Aykan NF, Özatlı T. Objective response rate assessment in oncology: Current situation and future expectations. World J Clin Oncol 2020; 11(2): 53-73
URL: https://www.wjgnet.com/2218-4333/full/v11/i2/53.htm DOI: https://dx.doi.org/10.5306/wjco.v11.i2.53
INTRODUCTION
The tumor objective response rate (ORR) is the assessment of the tumor burden (TB) after a given treatment in patients with solid tumors and has a long history. The ORR is undoubtedly an important parameter to demonstrate the efficacy of a treatment and it serves as a primary or secondary end-point in clinical trials. The first attempts to describe response criteria to anticancer drugs were performed by Karnofsky[1] in 1961,
Moertel and Hanley[2] in 1976, Levin et al[3] in 1977 and Macdonald et al[4] in 1990 based
on their clinical experiences. Karnofsky and his group classified the therapeutic effects of a drug into three major categories: No clinically useful effect on the course of disease (category 0), clinical benefit with favorable objective changes in all measurable criteria of disease (category I), interruption of or slowing the progression of disease without definite evidence of subjective or objective improvement (category II). Objective improvements include clinical (such as regression of palpable lesions), pathologic, radiologic and biochemical regressions according to the specific type of cancer and individual patient. This classification highlights the importance of response duration; for example, less than one month of duration occurs in category 0. Moertel and Hanley’s assessments were based on tumor size by palpation. The response criteria developed by Levin et al[3] and Macdonald et al[4] were only for
malignant brain tumors. Later, World Health Organization (WHO) criteria and Response Evaluation Criteria in Solid Tumors (RECIST) were developed for all solid tumors by working groups, mainly for cytotoxic chemotherapies and based on anatomic imaging[5-8]. These conventional response criteria, especially RECIST, were
used for more than two decades in the era of chemotherapy as a surrogate end-point to overall survival (OS) in clinical trials. The efficacy of a chemotherapy was usually correlated with tumor shrinkage over time[9,10]. After the introduction of molecularly
targeted treatment with biologic agents into oncology clinics and routine use of an fluorodeoxyglucose-positron emission tomography (FDG-PET) scan and advanced magnetic resonance imaging (MRI) techniques as functional imaging brought new perspectives in response evaluation. Moreover, very recently, immunotherapy by checkpoint inhibitors has led to the development of more specific response criteria because the patterns of response and progression to immunotherapy are different than those of cytotoxic chemotherapy and targeted biologic agents[10].
This review summarizes chronologically standard ORR evaluation criteria [WHO, RECIST v1.0, RECIST v1.1, modified RECIST (mRECIST)], response evaluation in targeted treatments with biologic agents (Choi and morphologic criteria) and then response assessments in immunotherapy (irRC, irRECIST, iRECIST, and imRECIST). We emphasize the importance of early tumor shrinkage (ETS) and depth of response (DpR) by some virtual examples. Later, we give some examples of graphical methods (Waterfall plot, Spider or Spaghetti plot and Swimmer plot) to demonstrate the details
of tumor shrinkage, pseudoprogression and a durable response.
Finally, we will discuss the current situation and the limitations of size-based response assessments and alternative metrics of response with the importance of response duration and future expectations.
LITERATURE SEARCH
A systematic literature search was performed using PubMed for “objective response rate”, “WHO criteria”, “RECIST criteria”, “modified RECIST”, “Choi criteria”, “tumor shrinkage”, “early tumor shrinkage”, “depth of response”, “morphologic response”, “immune-related RECIST”, “waterfall plot”, “spider or spaghetti plot”, “swimmer plot”, “PERCIST”, “iPERCIST” and “volumetric response”. Conference abstracts were also included. Furthermore, the references of all selected articles were reviewed to identify any additional information.
WHO AND RECIST CRITERIA
WHO criteria were published by The WHO[5] in 1979 and by Miller et al[6] in 1981 to
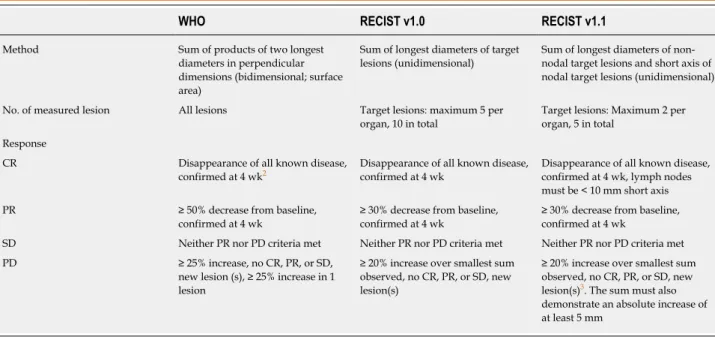
define the objective response, and they were used until 2000. According to the WHO criteria, the tumor size reflects its surface and is determined by bidimensional measurements and multiplication of the longest diameter by the greatest perpendicular diameter for single lesions. The total tumor load of a patient is the sum of the products of the perpendicular diameters for multiple lesions. The objective response to treatment is divided into four categories: Complete response (CR), partial response (PR), stable disease (SD) and progressive disease (PD) (Table 1).
For more than two decades, the WHO response criteria were used as the standard method for tumor evaluation. Due to the development of some problems such as the interobserver variability of the number of lesions, selection of measurable targets, minimum lesion size and definition of PD, WHO criteria became no longer comparable among research organizations[7]. Measuring all lesions was also a
time-consuming procedure and carried the risk of measurement errors. Next, to standardize and simplify the methodology, the RECIST version 1.0 was proposed as a new guideline to evaluate the response in 2000[8]. The arrival of new technologies such
as computed tomography (CT) and MRI has also led to some new definitions of measurable lesions. RECIST v1.0 criteria brought the term of “target” and “nontarget” lesions. Target lesions are selected based on their size (from those with the longest diameter to shortest ones), are representative lesions of all involved organs, and they should be reproducible by repeated measurements. According to RECIST v1.0, all measurable disease up to a maximum of 5 lesions per organ and 10 lesions in total were representative of all involved organs and should be identified and recorded as target lesions at baseline. All other lesions were nontarget lesions. The RECIST v1.0 guideline was revised in 2009; the maximum number of target lesions per organ was reduced from 5 to 2, and 10 to 5 in total, in RECIST version 1.1[11]. Assessment of the
pathological lymph nodes was incorporated as well; nodes with a short axis ≥ 15 mm were considered measurable, pathological and assessable as target lesions. Lymph nodes with a short axis < 10 mm were considered normal. Lymph nodes with a short axis between 10 and 15 mm were included as nonmeasurable nontarget lesions.
Table 1 shows a brief comparison of WHO, RECIST v1.0 and RECIST v1.1
criteria[5,6,8,11,12]. The best overall response is a result of a combination of tumor
responses in target and nontarget lesions. If there is any new lesion, the overall best response is always PD. In the absence of any new lesion, CR is the complete disappearance of all target and nontarget lesions. No change in nontarget lesions reduces a CR in target lesions to an overall PR, but no change in nontarget lesions does not reduce a PR in target lesions.
MODIFICATIONS OF RECIST CRITERIA
In 2006, the first mRECIST criteria were presented first by Zacharia et al[13] from the
United States and then by a Korean group[14-16] in three small-sized studies and in one
pooled analysis[17]. As a main modification, they proposed one single largest target
lesion per organ instead of 2 in their patients with colorectal cancer (CRC), non-small cell lung cancer and gastric cancer. They reported a high level of concordance with the original RECIST v1.1., but the number of their patients was small (153 patients) for validation.
Table 1 The World Health Organization, Response Evaluation Criteria in Solid Tumors version 1.0 and Response Evaluation Criteria in Solid Tumors version 1.1 criteria1
WHO RECIST v1.0 RECIST v1.1
Method Sum of products of two longest diameters in perpendicular dimensions (bidimensional; surface area)
Sum of longest diameters of target lesions (unidimensional)
Sum of longest diameters of non-nodal target lesions and short axis of nodal target lesions (unidimensional) No. of measured lesion All lesions Target lesions: maximum 5 per
organ, 10 in total
Target lesions: Maximum 2 per organ, 5 in total
Response
CR Disappearance of all known disease, confirmed at 4 wk2
Disappearance of all known disease, confirmed at 4 wk
Disappearance of all known disease, confirmed at 4 wk, lymph nodes must be < 10 mm short axis PR ≥ 50% decrease from baseline,
confirmed at 4 wk
≥ 30% decrease from baseline, confirmed at 4 wk
≥ 30% decrease from baseline, confirmed at 4 wk
SD Neither PR nor PD criteria met Neither PR nor PD criteria met Neither PR nor PD criteria met PD ≥ 25% increase, no CR, PR, or SD,
new lesion (s), ≥ 25% increase in 1 lesion
≥ 20% increase over smallest sum observed, no CR, PR, or SD, new lesion(s)
≥ 20% increase over smallest sum observed, no CR, PR, or SD, new lesion(s)3. The sum must also
demonstrate an absolute increase of at least 5 mm
1Modified from Choi et al[12], and extended with adding Response Evaluation Criteria in Solid Tumors version 1.1; 2Minimum interval between baseline assessment and first response evaluation;
3On detection of new lesions, fluorodeoxyglucose-positron emission tomography scan is included. CR: Complete response; PR: Partial response; SD: Stable disease; PD: Progressive disease; WHO: World Health Organization; RECIST: Response Evaluation Criteria in Solid Tumors.
Another mRECIST was described by Lencioni et al[18] for hepatocellular carcinoma
(HCC). In intermediate-stage patients with HCC, according to the Barcelona Clinic Liver Cancer staging classification, the recommended first-line therapy was transarterial chemoembolization (TACE) and, in the advanced-stage patients, the recommended first-line therapy was sorafenib, which is an antiangiogenic tyrosine kinase inhibitor[19,20]. Recent studies have shown a poor correlation between the clinical
benefit provided by sorafenib or interventional locoregional therapies such as TACE, transarterial radioembolization or radiofrequency ablation and conventional response criteria[18-22]. mRECIST for HCC was developed based on a new concept of a viable
tumor proposed by the European Association for the Study of the Liver (EASL) panel[23]. A viable tumor was defined as showing intratumoral arterial enhancement
by contrast agent during dynamic CT or MRI[23]. Therefore, measuring tumor
enhancement is a surrogate marker of a viable tumor. Thus, tumor necrosis induced by treatment (TACE or sorafenib) is also considered as a response assessment. According to mRECIST for HCC, CR is the disappearance of any intratumoral arterial enhancement in all target lesions. PR is at least a 30% decrease in the sum of the diameters of viable (contrast enhancement in the arterial phase) target lesions, taking as reference the baseline sum of the diameters of the target lesions. PD is an increase of at least 20% in the sum of the diameters of viable target lesions, and SD is any cases that does not qualify for either PR or PD. Overall response is a result of the combined assessment of target lesions, nontarget lesions and new lesions[18]. The EASL proposed
another set of response criteria for HCC[21]. EASL criteria include 2-dimensional
methods like WHO, but they consider the enhanced tumor area like mRECIST. Tumor shrinkage is not always symmetrical; tumors have heterogenous changes due to necrosis, fibrosis or intratumoral hemorrhage, especially after locoregional therapies or biologic agents[24]. The new proposed criterion, quantitative EASL
(qEASL), is the 3-dimensional volumetric assessment of enhancing tumor tissue[25].
Table 2 shows a comparison of mRECIST for HCC, EASL and qEASL[18,22-25]. qEASL
predicted survival better than RECIST, mRECIST and EASL criteria in patients with HCC[24].
Another alternative of conventional RECIST was developed and validated for malignant pleural mesothelioma (MPM)[26,27]. Due to anatomic reasons such as the
curved structure of the chest wall, defining the limits of the longest unidimensional diameter of tumor mass before and after the treatment may be difficult. The mRECIST criteria for MPM consider tumor thickness perpendicular to fixed structures such as the chest wall or vertebral colon in two positions on the same transverse cut of CT scan. The sum of the two measurements in three axial sections (six measurements) defined a pleural unidimensional measure. Nodal, subcutaneous and other
Table 2 Comparison of modified Response Evaluation Criteria in Solid Tumors, European Association for the Study of the Liver and quantitative European Association for the Study of the Liver criteria for hepatocellular carcinoma[18,19,22-25]
mRECIST (1D criteria) EASL (2D criteria) qEASL (3D criteria)
CR Disappearance of any intratumoral enhancement in all target lesions
Disappearance of any intratumoral enhancement in all target lesions
Disappearance of any intratumoral enhancement in all target lesions PR At least 30% decrease in the sum of
max. diameters of the enhanced tumor area
At least 50% decrease in the product of max. diameter and its
perpendicular of the enhanced tumor area
At least 65% decrease in the enhanced tumor volume
SD Neither PR, nor PD Neither PR, nor PD Neither PR, nor PD PD At least 20% increase in the sum of
diameters of the enhanced tumor area
At least 25% increase in the product of max. diameter and its
perpendicular of the enhanced tumor area
At least 73% increase in the enhanced tumor volume
EASL: European Association for the Study of the Liver; qEASL: Quantitative European Association for the Study of the Liver; HCC: Hepatocellular carcinoma; 1D: Unidimensional; 2D: Bidimensional; 3D: Tridimensional (volumetric); CR: Complete response; PR: Partial response; SD: Stable disease; PD: Progressive disease.
bidimensionally measurable lesions are measured unidimensionally per the RECIST criteria and are added to the total TB. PR is at least a 30% reduction in the total tumor measurement, PD is defined as an increase of at least 20% in the total tumor measurement over the nadir, or the appearance of new lesions.
RESPONSE EVALUATION IN TARGETED TREATMENTS
WITH BIOLOGIC AGENTS
The first targeted antitumor agent that requires re-evaluation of the existing response criteria used to assess treatment response is imatinib mesylate which is a c-KIT receptor tyrosine kinase inhibitor in gastrointestinal stromal tumors (GISTs)[28-30].
Following imatinib treatment, in some cases, the tumor size increases due to intratumoral hemorrhage, necrosis or myxoid degeneration. In many GISTs, the early decrease in the tumor size is minimal. On the other hand, more dramatic changes in responding GISTs is the decrease in the tumor density, which can be measured as the Hounsfield unit on CT. Therefore, Choi criteria were proposed and prospectively validated in patients with imatinib-treated metastatic GIST[28,29]. The response by Choi
criteria is a 10% decrease in the tumor size or a 15% decrease in the density on contrast-enhanced CT and was found to be reproducible, more sensitive, and more precise than RECIST, and was correlated significantly with the time to tumor progression and disease-specific survival.
Two major biologic agents whose response rates were largely discussed in new large-scale randomized trials are the anti-vascular endothelial growth factor-targeted monoclonal antibody (MoAb) bevacizumab and an anti-epidermal growth factor receptor (EGFR) MoAb cetuximab. First, in the NO16966 study which is a randomized phase III trial comparing oxaliplatin-based chemotherapy with or without bevacizumab as first-line therapy in metastatic CRC, the response rates were found to be similar in both arms, although the median progression-free survival (PFS) was significantly superior with the addition of bevacizumab to oxaliplatin-based chemotherapy[31]. In a retrospective analysis of the pathological response in patients
with CRC liver metastases (LM) following treatment with bevacizumab-containing chemotherapy, the pathological response rate was significantly superior in bevacizumab-treated patients than in those receiving chemotherapy alone (49% vs 27%, P = 0.03), although the RECIST response rates were similar (51%) with and without bevacizumab[32]. Another three previous retrospective studies showed
improvement of the pathological response in patients treated with bevacizumab plus chemotherapy[33-35]. The addition of bevacizumab to oxaliplatin-based chemotherapy
significantly reduced the degree of tumor viability[33]. Fluoropyrimidine plus
oxaliplatin and bevacizumab combination therapy is one of the independent predictors of a pathologic response[34]. Bevacizumab improves the tumor regression
grade to chemotherapy significantly[35]. Stremitzer and colleagues[36] prospectively
investigated whether the type of MoAb (bevacizumab or cetuximab) with neoadjuvant chemotherapy was associated with the histological response and the pattern of tumor destruction in patients with CRC LM. They found that the addition of bevacizumab to combination chemotherapy showed more necrosis but less fibrosis
than cetuximab.
On the other hand, a complete pathologic response (CPR) is a strong predictor of prolonged survival or cure in CRC LM[34,37-39], but total tumor necrosis or CPR does not
always indicate a complete clinical response identified by CT[32,37].
As a result, RECIST criteria may not be optimal to evaluate the response to bevacizumab; size-based radiological methods may not differentiate between the tumor and fibrotic tissue due to effective biological therapy[32,33,36]. Recently, new
criteria (morphologic response) based on morphologic changes, such as a sharply or poorly defined tumor-liver interface and homogeneous or heterogeneous attenuation observed on contrast-enhanced CT, were defined in patients with CRC LM, undergoing chemotherapy with or without bevacizumab[40,41]. The CT morphology
comprises three groups of lesions: Homogeneous lesions with sharp edges (group 1), heterogeneous structures with poorly defined edges (group 3) and intermediate mixed lesions (group 2). Nishioka et al[42] showed that the CT morphology predicts
tumor viability and long-term surgical outcomes after chemotherapy in patients with CRC LM. Intratumoral heterogeneity in the primary tumor and its vasculature (angiogenic or non-angiogenic), as well as related lymphatic and hepatic metastasis, may also result in different responses to anticancer therapy[43,44].
Recently, in the FIRE-3 trial comparing cetuximab with bevacizumab, in combination with fluorouracil, folinic acid and irinotecan (FOLFIRI), as a first-line treatment in patients with KRAS exon 2 wild-type metastatic CRC, the primary endpoint was the objective response rate according to RECIST v1.0, and this was found to not be significantly different between the two arms; the median PFS was also similar, but the OS was significantly superior in the FOLFIRI plus cetuximab arm[45].
Several explanations are possible for these surprising results, such as a lack of an independent radiological review of response data and effect or underuse of second-line treatments, and one of them is the inadequacy of RECIST for different targeted therapies[45-47]. Later, an independent, central radiological evaluation showed that the
rate of ETS and DpR were significantly greater in patients treated with FOLFIRI plus cetuximab[48]. ETS was defined as a reduction in the tumor diameter of more than 20%
at the first tumor assessment (week 6) after the baseline. DpR was defined as the maximal tumor shrinkage observed in a patient. The median time to the maximal tumor response was 3.5 mo in the cetuximab arm and 3.6 months in the bevacizumab arm[49]. DpR is a nadir of tumor shrinkage compared with baseline[50]. According to
RECIST, at least a 30% decrease in the sum of the longest diameters indicates PR, and minor tumor progression (1%-19%) and minor tumor shrinkage (0%-29%) cover SD category. ETS, as a categorical measure, includes tumor size reduction in the range of 10%-30% according to a trial as a cut-off percentage, and this was shown to be significantly associated with PFS and OS in several retrospective analyses from previous trials[50-53]. Among these trials, in the BOND study the ETS cut-off was set at
10% and the time of the first response assessment was set as 6 wk[50,53]. Figure 1 shows
a simple model of different ETS definitions on a waterfall plot. A systematic review and pooled-analysis of 21 trials showed that patients with ETS were associated with better OS and PFS than early nonresponders in metastatic CRC (mCRC)[54]. On the
other hand, early and fast maximum tumor shrinkage (at week 6 or 8) may allow a possible safer resection of CRC LM, before the occurrence of liver damage induced by prolonged chemotherapy[55,56]. The impact of ETS and resection on the outcomes in
patients with wild-type (wt) RAS mCRC was investigated in the PRIME trial as a secondary end-point[56]. The PRIME trial compared FOLFOX4 chemotherapy vs
FOLFOX4 plus a fully human anti-EGFR MoAb panitumumab as first-line treatment in mCRC and demonstrated that panitumumab+FOLFOX4 significantly improved PFS and OS in patients with wtRAS mCRC[57-59]. Douillard et al[56] indicated that more
patients receiving panitumumab+FOLFOX4 had tumor shrinkage and they concluded that ETS appeared to be associated with improved PFS and OS irrespective of the treatment received. ETS and DpR are RECIST-independent parameters; they are not recorded by RECIST-based assessments[45,49].
The early morphologic response was also evaluated in patients with RASwt mCRC in a retrospective analysis[60]. An early optimal morphologic response (EOMR) was
defined as a change from group 3 or 2 according to morphologic response criteria at baseline CT to group 1 at the first assessment by CT. In this trial, Masuishi et al[60]
found that patients with EOMR had longer PFS than those without EOMR in patients treated with bevacizumab.
The term of “the depth of response (DpR)” shows that all PRs are not the same. We present here hypothetical 2-D examples to compare and contrast WHO and RECIST criteria (Figure 2). Here, in example 1, we draw a regular spheroid mass (A) with symmetric (proportional) shrinkage following treatment. Example 2 shows an irregular mass (X) with asymmetric shrinkage after treatment. The baseline (at time 0; t0) perpendicular diameters for both tumors are the same; 6 cm × 5 cm.
Figure 1
Figure 1 Different cutoff levels of E of early tumor shrinkage at first tumor response assessment (6 or 8 wk). A: ≥ 10% (5 cases); B: ≥ 20% (4 cases); C: ≥
-30% (3 cases). CR: Complete response; PR: Partial response; SD: Stable disease.
As shown in Table 3, in example 1, no difference was found in the response evaluation at time point 1 (t1) and time point 2 (t2) between WHO and RECIST.
However, in example 2, at t1, the tumor response was PR according to RECIST while
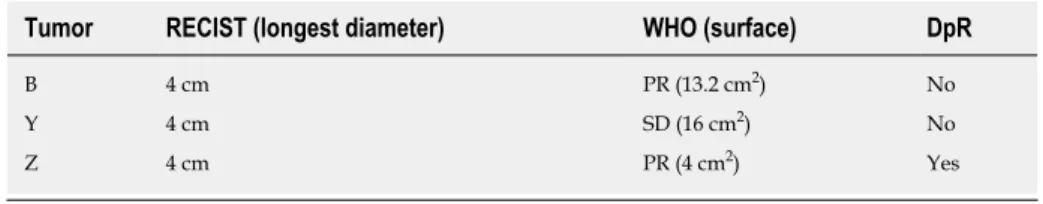
the WHO response was SD (Table 3). On the other hand, among PRs, although the longest diameter was the same (4 cm) of tumors B, Y and Z, the smallest tumor according to surface was Z; therefore, WHO criteria could distinguish a DpR, but not RECIST (Table 4). We previously presented this virtual comparison of size-based tumor shrinkage methods and the effect of tumor heterogeneity in 2016[61].
RESPONSE EVALUATION IN IMMUNOTHERAPY
Immune checkpoint inhibitors such as ipilimumab (an anti-CTLA4 MoAb), nivolumab or pembrolizumab (anti-PD 1 antibodies) or atezolizumab (an anti-PD L1 antibody), are active immuno-oncology drugs that have received marketing authorizations since 2011 and have become increasingly available in oncology clinics[10,62,63]. In early studies with these drugs, researchers observed different, atypical
and unique response patterns than those with traditional cytotoxic and other molecularly targeted agents[10,63]. This indicated an initial radiological progression by
RECIST and subsequent delayed tumor shrinkage; this phenomenon was termed as peudoprogression[62]. During pseudoprogression, biopsy demonstrated inflammatory
cell infiltrates, edema or necrosis[62]. The use of RECIST in this situation resulted in
premature discontinuation of therapy, although there was a clinical benefit or a later response[10]. Delayed but durable responses were associated with prolonged survival
in a subset of patients. These insufficiencies demonstrated the need for more precise criteria in immunotherapy. Figure 3 illustrates pseudoprogression.
Immune-specific response criteria were described chronologically as the irRC (immune-specific related response criteria), irRECIST (immune-related RECIST), iRECIST (immunotherapy RECIST) and imRECIST[63-66]. One of the main differences in
these criteria compared with RECIST is the necessity for the confirmation of true PD at least 4 wk after from the first assessment. The baseline measurable minimal target lesion size is 5 mm × 5 mm in irRC and at least 10 mm in irRECIST and iRECIST for non-nodal metastases. irRC represents a bidimensional criteria like the WHO criteria, while the others are unidimensional. The appearance of new lesions during treatment is incorporated into the sum of the measurements; this is another difference from RECIST. Because many immunotherapy trials used conventional RECIST since 2010, making a universal comparison of data from different trials is difficult; thus, a consensus guideline published iRECIST in 2017 to minimize the variability of interpretation[10]. iRECIST is a mRECIST v1.1; the definitions of measurable and
nonmeasurable disease, target and nontarget lesions are the same. Table 5 compares immune-specific response criteria.
Figure 2
Figure 2 Two hypothetical examples of tumor shrinkage. Example 1: Spheroid mass, symmetric (proportional)
shrinkage; Example 2: Irregular mass, asymmetric shrinkage. t0: Time point baseline; t1: Time point-1; t2: Time
point-2; A, B, C: Spheroid mass; X, Y, Z: Irregular mass.
GRAPHICAL METHODS TO DEMONSTRATE TUMOR
SHRINKAGE AND RESPONSE DURATION
The ORR depends on the categorization of the used response criteria. These categorizations have a certain degree of arbitrary cut-off values such as a 20% increase for PD or a 30% decrease for PR at a certain time point (4 or 8 wk)[8,11,67,68]. It does not
demonstrate continuous change in the TB over time. Intermittent measurement of the response by certain intervals to obtain the response duration may result sometimes in the loss of information such as early progression before the time of visit or death. The continuous longitudinal analysis of the TB data requires some graphical methods[67].
The popular graphical methods are the waterfall plot, spider (or spaghetti) plot and swimmer plot[67,69-71] (Figure 4). The waterfall plot is a bar chart that shows the largest
percentage change relative to baseline in TB for each patient[67,69]. The horizontal axis
(x) is used generally as a baseline measure and the vertical bars may go either above or below the baseline. Each bar represents one patient. The vertical axis (y) is generally used to quantify the response to treatment for example, percentage of growth or reduction. The negative vertical bars demonstrate reduction between 0% and -100%, and positive bars show nonresponders or progression. The bars are usually ordered from the worst (PD) response on the left side to the best (CR) value on the right side of the plot. We can easily see responders, nonresponders and stable patients in an area between the +20% and -30% lines; at a glance, an idea about the effectiveness can be obtained between two different treatments if different color-coded bars are used. The waterfall plot does not demonstrate the timing and durability of the response. Another commonly used graphical method is the spider plot where the percentage change from baseline is plotted against time for each patient. Each line represents one patient. We can observe pseudoprogression and response duration in the spider plot. Both methods have some limitations; they do not provide any statistical results when there is more than one treatment arm, and their use is limited when there are many patients[67,68]. Waterfall plots should be generated
by trained radiologists due to the high interobserver variability[72]. A third graphical
method is called the swimmer plot that shows an individual subject’s pattern of response[70]. In the swimmer plot, we observe multiple pieces of a patient’s response
story, the duration of response and treatment. In Figure 4, we tried to demonstrate these graphical methods using 12 hypothetical cases.
These longitudinal graphical alternative methods of evaluating the response and some new simulation models with survival can be used, especially in early-phase
Table 3 Response evaluation in example 1 and example 2 of Figure 2 RECIST WHO Example 1 t1 (B vs A) PR PR t2 (C vs A) PR PR Example 2 t1 (Y vs X) PR SD t2 (Z vs X) PR PR
SD: Stable disease; PR: Partial response; t1: Time point-1; t2: Time point-2; WHO: World Health Organization;
RECIST: Response Evaluation Criteria in Solid Tumors.
clinical trials to better characterize the treatment effect and inform decision-making[67,73].
METABOLIC RESPONSE
WHO criteria, RECIST and RECIST v1.1 are anatomical response criteria. They are based on the visual assessment of the tumor size in morphological images provided by CT or MRI. As mentioned above, the reduction in the viable tumor does not always result in a volume reduction, because the tumor tissue can be replaced by necrotic or fibrotic tissue and morphological changes cannot differentiate among these different tissue types, and volume changes are quite late events such as 2-3 mo[74]. In addition to
anatomical and morphological imaging, metabolic imaging has become increasingly important in recent years.
Accelerated glucose metabolism is one of the functional changes observed in cancer cells, and this hallmark of cancer was first recognized by Otto Warburg[75,76].
Radioisotope-based molecular imaging techniques such as PET and single-photon emission CT capture functional pathologic changes[77]. A strong relationship was
shown between 18F-FDG uptake and cancer cell number in a substantial number of
studies[78]. PET can detect cancers that are smaller than demonstrated on CT. The limit
of resolution for detecting cancers by 18F-FDG PET generally ranges between 0.4 and
1.0 cm, corresponding to approximately 108-109 cells[78]. 18F-FDG-PET CT can detect
early metabolic changes in tumor cell metabolism before any change in tumor size occurs[79].
In RECIST v1.1, FDG-PET is included in the detection of new lesions in 2009[11]. In
the same year, PET response criteria in solid tumors (PERCIST) were published by Wahl et al[78], and a simplified guide to PERCIST 1.0 was published in 2016[80]. Before
PERCIST, EORTC PET response criteria were published in 1999[81]. EORTC PET
response criteria and PERCIST follow the model of RECIST and define 4 response categories: Complete metabolic response (CMR), partial metabolic response (PMR), stable metabolic disease and progressive metabolic disease[82]. As a quantitative
parameter, EORTC PET criteria use the mean standardized uptake value (SUVmean), normalized to the body surface area. PERCIST uses the SUVpeak, normalized to the lean body mass (abbreviated as SUL). The threshold of SUV change to define a response is 25% in EORTC PET criteria. PERCIST uses a change in the FDG uptake by 30% as a threshold for response and progression. These thresholds were calculated based on excluding the fluctuations of measurements of SUVs and have therapeutic effects[82]. Table 6 summarizes EORTC PET criteria and PERCIST 1.0. Recent clinical
studies compairing these two metabolic criteria with each other as well as with RECIST and a pooled analysis have indicated that metabolic criteria lead to very similar classifications but there are significant differences between them and RECIST[82,83]. PERCIST is better correlated with patient outcome and may be a better
predictor for the effectiveness of new anticancer treatments than RECIST. These findings require confirmation by data from randomized trials.
Metabolic response assessments using PET have the potential also after immunotherapy. Goldfarb et al[84] proposed immune PET Response Criteria
(iPERCIST), which were adapted from PERCIST and iRECIST[63,80] (Table 6). iPERCIST
is a dual-time-point evaluation of “unconfirmed progressive metabolic disease (UPMD)”; baseline PET imaging (SCAN-1) is performed within 1 mo before the start of immunotherapy, follow-up PET (SCAN-2) is peformed at 8 wk after the first dose, and, in the situation of UPMD, a second follow-up FDG-PET (SCAN-3) is performed 4
Table 4 Depth of response in Figure 2
Tumor RECIST (longest diameter) WHO (surface) DpR
B 4 cm PR (13.2 cm2) No
Y 4 cm SD (16 cm2) No
Z 4 cm PR (4 cm2) Yes
DpR: Depth of response; SD: Stable disease; PR: Partial response; WHO: World Health Organization; RECIST: Response Evaluation Criteria in Solid Tumors.
weeks later to confirm PD.
It appears that 18F-FDG uptake by the tumor is a consequence of an intact metabolic
activity and reflects the viability of neoplastic cells[85]. Presently, 18F-FDG-PET CT
occurs in the standard management of lymphomas as a reliable biomarker. After two cycles of the ABVD regimen in Hodgkin lymphoma (HL), interim 18F-FDG-PET CT is
used to assess the treatment response in patients with early-stage disease. In 2009, the Deauville criteria were defined to interpret this interim and end-of-treatment PET scans[85,86]. Deauville criteria use a 5-point scale (5-PS) based on the visual uptake of 18F-FDG in the involved sites (Table 7). This 5-PS has been validated for use at interim
PET (iPET) and end-of-treatment PET in lymphomas[87]. A score of 1 (no uptake) or 2
(uptake ≤ mediastinum) is considered a CMR at iPET and end-of-treatment PET[86-88].
A score of 3 is considered an inadequate response at the time of iPET, and undertreatment of HL should be avoided. A score of 4 or 5 with reduced uptake compared with baseline without new lesions is considered a PMR at iPET. At the end of treatment, a score of 4 or 5 indicates treatment failure even if uptake is reduced. In non-Hodgkin lymphomas (NHLs), Lugano response criteria are based on the metabolic response by PET/CT using 5-PS, and the radiologic response by contrast-enhanced CT[88]. iPET scan can be used after 2 or 4 cycles of chemotherapy in NHL,
but has limited prognostic value due to false-positive results[88].
CONCLUSION AND FUTURE EXPECTATIONS
OS is the gold standard that shows a treatment benefit in oncology. However, sometimes, it takes a long time and waiting for a comparison of the OS difference between treatment arms may delay drug approval by regulatory authorities. The TB data that cover ORR and PFS may be used as surrogate endpoints to OS. As we mentioned in the Introduction section, the assessment of the tumor ORR is important to report the results of clinical trials and for clinical decision making in routine practice[82]. The WHO (bidimensional) and RECIST (unidimensional) criteria are
anatomic response criteria that reflect tumor shrinkage, mainly after cytotoxic chemotherapies. The theoretical reason of the unidimensional measurement of tumor size is essentially based on the direct relationship between the number of tumor cells in a spherical tumor and maximum diameter of the tumor mass[89]. Cell killing by
chemotherapy is directly related to the dose; a PR is a function of the maximum diameter in the situation of proportionate (symmetrical) reduction of the initial tumor mass. If we consider the tumor tissue heterogeneity, tumor vascularization, necrosis, fibrosis, and intratumoral hemorrhage, tumor shrinkage may not always be symmetrical, especially in the era of biologics[28,29,32,39,40]. Tumor mass decrease is
sometimes due to fragmentation rather than shrinkage of the primary tumor, as seen in rectal cancer after chemoradiotherapy[90]. Asymmetric shrinkage is also observed in
prostate cancer after external beam radiation therapy[91]. Therefore, anatomic response
criteria may not be optimal for biologic agents, some disease sites, some regional therapies. Consequently, modifications of RECIST, Choi criteria and morphologic response criteria were developed based on the concept of the evaluation of a viable tumor (contrast enhancement area and changes in tumor density)[28,41,42]. On the other
hand, anatomic assessments alone may take two or three months to detect morphological changes or a shrinkage, whereas metabolic response assessment by PET can show changes as early as 8 d after the start of treatment[74,92,93].
RECIST was introduced based on retrospective clinical data, including more than 4000 patients assessed for the tumor response and then validated in prospective studies[92]. RECIST v1.1 was developed from the assessment of a large database that
consists of > 6500 patients and > 18000 target lesions[11]. In a recent survey performed
from key partners of the RECIST collaboration, it was shown that 52.3% responders were satisfied with RECIST v1.1[93]. A newest published pooled database analysis from
Figure 3
Figure 3 Pseudoprogression. t0: Time point baseline; t1: Time point-1; t2: Time point-2; NK: Natural killer.
the RECIST Working Group also indicated the good performance of RECIST v1.1 to evaluate the tumor response to targeted cancer agents (TCAs) independent of the subclass of TCA (signal transduction inhibitors or angiogenesis inhibitors) or tumor type[94]. Although validation studies exist and are generally accepted by regulatory
agencies, the RECIST v1.1 criteria cannot capture the atypical responses observed with immunotherapy[11,95]. Atypical patterns of response (pseudoprogression) to
anti-PD-1 therapy are observed at approximately 6%-10%[96]. Immune RECIST criteria are
based essentially on the definition of true PD after confirmatory imaging.
Another clinically important reflection of tumor heterogeneity is contradictory progression of one or a few sites of disease despite an overall TB response to systemic therapy; this concept is called oligoprogression[97,98]. This concept is different than
oligometastasis which indicates small number of metastases (generally less than five). In the oligometastatic state of cancer, patients are still candidates for regional potential curative therapy (surgical resection, ablation or RT)[97]. In oligoprogression,
there can be diffuse metastatic disease, there is no upper limit of the number of metastases, and a few metastases progress whereas the most of the other tumors are not progressing[98].
With increasing use of immunotherapy, some rapid progression was described, and this immunotherapy-induced acceleration of tumor growth (twofold or greater increase in a time less than 2 mo) was called hyperprogression[10]. Actually, this
exceptional situation is a very hot topic of research in immuno-oncology.
In the genomic era, due to smaller homogeneous populations, powering a randomized clinical trial for an end point of OS may no longer be feasible; therefore the ORR and duration of response in single-arm trials may lead to an accelerated approval of new drugs[99]. In a recent analysis of 542 arms for 294 regimens in solid
tumors, Oxnard et al[100] found that demonstrating an ORR exceeding 30% with a
single agent was highly specific to identify regimens achieving regulatory approval. For some disease sites, such as the bone and brain, organ-specific response criteria were developed: MD Anderson (MDA) criteria for bone metastases, RANO for brain tumors[101,102]. Bone lesions are not measurable according to RECIST v1.1, only bone
lesions with an identifiable soft tissue component may be used as target lesions[11,93].
MDA criteria incorporated CT and MRI to assess the response of bone metastatic lesions besides using plain radiography and skeletal scintigraphy[101]. Sclerosis of
previous lytic lesions on CT or regression of measurable lesions on CT or MRI was considered as a PR[101]. In neuro-oncology, the Macdonald criteria, which was widely
used until recently, determines the response as a change of a product of the maximal cross-sectional enhancing diameters together with changes in the neurologic status of patients and corticosteroid use[4]. These criteria did not consider the nonenhancing
tumor, pseudoprogression and pseudoresponse. To address pseudoprogression, which is a transient increase in contrast enhancement observed in 10%-30% of patients with glioblastoma immediately after chemo-radiotherapy, the RANO criteria recommended, for recurrent disease, clear progression outside the radiation field or clear histologic documentation of progression after the first 12 wk after RT[102]. A
pseudoresponse which is a marked decrease in contrast enhancement as early as 1-2 d after antiangiogenic therapies due to a decrease of vascular permeability, does not reflect a true response[103]. The RANO criteria recommended a confirmatory scan at
least 4 weeks later to ensure a sustainable response. The RANO criteria defined progression not only as a 25% increase in the contrast-enhancing area but also
Table 5 Immune response criteria[63-66]
irRC (2D), 2009 irRECIST (1D), 2013 iRECIST (1D), 2017 imRECIST (1D), 2018
Minimum number of target lesions
10 lesions in total; 5 lesions per organ
5 lesions in total; 2 lesions per organ
5 lesions in total; 2 lesions per organ
5 lesions in total; 2 lesions per organ
New lesions Included in the sum of the measurements
Included in the sum of the measurements
iUPD; becomes iCPD if PD eventually confirmed
Included in the sum of the measurements
CR Disappearance of all lesions Disappearance of all lesions Disappearance of all lesions Disappearance of all lesions PR ≥ 50% decrease from baseline ≥ 30% decrease from baseline ≥ 30% decrease from baseline ≥ 30% decrease from baseline SD Neither CR nor PD Neither CR nor PD Neither CR nor PD Neither CR nor PD PD ≥ 25% increase in the nadir ≥ 20% increase in the nadir
(minimum 5 mm)
≥ 20% increase in the nadir (minimum 5 mm)
≥ 20% increase in the nadir (minimum 5 mm) Confirmation of PD Yes Yes1 Yes2 Yes3
1At least 4 wk after, and up to 12 wk;
2At least 4 wk after, and up to 8 wk;
34 wk after. 1D: Unidimensional; 2D: Bidimensional; CR: Complete response; PR: Partial response; SD: Stable disease; PD: Progressive disease; iUPD: Immune unconfirmed progressive disease; iCPD: Immune confirmed progressive disease; irRECIST: İmmune-related Response Evaluation Criteria in Solid Tumors; iRECIST: İmmunotherapy Response Evaluation Criteria in Solid Tumors; irRC: İmmune-specific related response criteria; imRECIST: Immune-Modified Response Evaluation Criteria In Solid Tumors.
included any significant enlargement of a nonenhancing T2/FLAIR signal on MRI.
Table 8 summarizes current objective response assessment criteria.
Tumor tissue is a three-dimensional (3D) mass in the body, and, theoretically volumetric assessment of the objective response may detect precise changes in the TB. In spherical tumors, a decrease in the volume [V = (4/3) πr3] of 65% or greater
corresponds to a 50% reduction in the product results [(2r)2] (WHO criteria) or 30%
reduction in the diameter (2r) (RECIST) and indicates PR[5,6,89]. PD, which indicates a
20% increase in the diameter according to RECIST, corresponds to a more than 73% increase in volume, but a 25% increase in area according to WHO is corresponds to a 40% increase in volume[89]. Several studies have used 3D or volumetric measurements
in different types of tumor and performed different comparisons since 1996[104-119].
Tumor volume measurements using CT initially started for radiotherapy treatment planning in the 1980s and was found to be highly accurate in early trials[120-122]. The
comparison of 1D, 2D and 3D assessment of the response in various solid tumors such as lung nodules, metastatic pulmonary nodules, CRC LM, and metastatic lymph nodes was performed in different trials containing a small number of patients. Some of these trials showed good concordance among 1D, 2D and 3D measurements[104,105,111].
Moreover, Hopper et al[104] showed a 23.2% of change in the treatment response
category using the 3D volume versus the 2D area methods, and this change was significant. Prasad et al[110] compared these three measurements in patients with LM
from breast cancer and found that volumetric measurement produced different results in a considerable proportion of patients. Semiautomated volumetric analysis of lymph node metastases in patients with malignant melanoma was found to be feasible in one study and more reliable than manual measurements in another study evaluating the tumor volume from MRI images in patients with malignant glioma[116,117]. The ORR by volumetric assessment based on brain MRI was used as an
approval end point for everolimus in subependymal giant-cell astrocytoma[99,118].
Warren et al[109] found less concordance in the minor response and PD categories
between 3D and 1D in childhood brain tumors; however, this concordance was high in detecting PR. In a trial compairing manual 1D measurements versus automated volumetry (AV) in patients with pulmonary metastases, the authors concluded that AV allows better reproducibility and should be preferred[114]. Inversely, some other
studies did not support the use of 3D measurements in the place of 1D or 2D assessments because 1D evaluation is comparable to 3D methods and simpler for clinical routine use[106-108,113,115,119]. Galanis et al[115] indicated that response assessment by
1D, 2D and computer-assisted volume methods was similar. A recent trial published in 2017 that compares volumetric versus 1D assessment in mCRC showed that 3D assessment is fairly reproducible and similar to 1D measurement[119]. Briefly, the
superiority of volumetric response evaluation was not validated until now in large and prospective trials. On the other hand, tumors do not always have a regular contour; they may be spiculated and may contact various structures, such as the pleura, vessels and chest wall, making the assessment of volume difficult[112].
Imaging quality is the principal issue in radiologic assessments. New imaging techniques, such as diffusion-weighted imaging, dynamic contrast-enhanced MRI and
Figure 4
Figure 4 Waterfall, spider (spaghetti) and swimmer plot for 12 hypothetical cases. A: Waterfall; B: Spider (spaghetti); C: Swimmer. Case 8 (blue arrow with
cycle) represents pseudoprogression at the 4th week. RR: Response rate; CR: Complete response; PR: Partial response; SD: Stable disease; PD: Progressive
Table 6 Comparison of fluorodeoxyglucose-positron emission tomography response criteria[78,80,81,84]
EORTC PET, 1999 PERCIST, 2009 iPERCIST, 2019
CMR Complete Resolution of FDG uptake1 Complete Resolution of FDG uptake Complete Resolution of FDG uptake
PMR 15-25% decrease of SUV after one cycle or > 25% decrease after more than one treatment cycle
≥ 30% decrease in the target tumor SULpeak
≥ 30% decrease in the target tumor SULpeak
SMD Increase of SUV by < 25% or decrease of SUV by < 15%
Neither CR, PR nor PD Neither CR, PR nor PD PMD Increase of SUV by > 25% or Increase
of the longest diameter by 20% or new FDG avid lesion(s)
≥ 30% increase in SULpeak or advent of new FDG avid lesions
≥ 30% increase in SULpeak or advent of new FDG avid lesions (UPMD); Need to be confirmed by a second PET at 4-8 wk later (CPMD)
1Indistinguishable from surrounding background. CMR: Complete metabolic response; PMR: Partial metabolic response; SMD: Stable metabolic disease; PMD: Progressive metabolic disease; UPMD: Unconfirmed progressive metabolic disease; CPMD: Confirmed progressive metabolic disease; PET: Positron emission tomography; SUV: Standardized uptake value; FDG: Fluorodeoxyglucose; SUL: Standardized uptake value, normalized to the lean body mass; EORTC: European Organization for Research in the Treatment of Cancer; PERCIST: Positron emission tomography response criteria in solid tumors; iPERCIST: İmmune positron emission tomography Response Criteria.
perfusion CT, may add functional information to the morphological evaluation, especially in hepatic and pancreatic tumors[123]. Quantitative multimodality imaging in
oncology, such as multiparametric MRI, the PET hybrids (PET-CT, PET-MRI), and new tracers in PET other than FDG (such as radiotracers to image oxygen status, receptor status, and proliferation), may provide a more-comprehensive and more accurate characterization of the tumor phenotype[124]. Importantly, the radiation
exposure to patients during diagnosis, staging and response monitoring must be considered. The amount of radiation exposure from an imaging test is shown in Table 9[125]. Hybrid imaging procedures inevitably lead to an increase in patient radiation
exposure[126]. MRI has no risk of ionizing radiation.
Finally, radiologic image pattern analyses (radiomics) by computer-aided detection systems and, very recently artificial intelligence algorithms, particularly deep learning, have demonstrated remarkable progress in image-recognition tasks and are expected to identify wide applications in the evaluation of the treatment response and monitoring[127,128].
Table 7 The 5-point scale scores and Deauville criteria in Hodgkin Lymphoma[85-88]
Score PET/CT scan result At iPET At end-of-treatment
1 No uptake CMR CMR
2 Uptake ≤ mediastinum CMR CMR
3 Liver ≥ Uptake > mediastinum Inadequate response Good prognosis 4 Uptake moderately higher than liver PMR Treatment failure 5 Uptake markedly higher than liver and/or new lesions PMR Treatment failure X New areas of uptake unlikely to be related to lymphoma
iPET: Interim positron emission tomography; CMR: Complete metabolic response; PMR: Partial metabolic response.
Table 8 Summary of current objective response assessment criteria
Response
assessment criteria Year Imaging modalities Assessment type Advantages Disadvantages
WHO 1979 and 1981 CT Anatomic, size-based First objective measurements of images of all lesions
Time-consuming procedure;
Interobserver variability RECIST v1.0 2000 CT, MRI Anatomic, size-based Easier than WHO;
Measurement of "Target" and "Non-target" lesions; Less measurement errors
Only anatomic assessment
RECIST v1.1 2009 CT, MRI, PET Anatomic, size-based Easier than RECIST v1.0 Lymph nodes incorporated
Only anatomic assessment mRECIST 2006 CT, MRI Anatomic, size-based Simpler than RECIST
v1.1
Only anatomic assessment, not prospectively validated mRECIST for HCC 2010 CT, MRI Anatomic and
functional; Based on contrast enhancement
Measurement of a viable tumor. Appropriate for loco-regional therapies
Only for HCC
EASL and qEASL 2000 and 2012 CT, MRI Anatomic and functional; Based on contrast enhancement
qEASL is better than RECIST to predict OS; Measurement of a viable tumor
Only for HCC
Choi criteria 2007 CT Anatomic and functional; Based on tumor density
Validated for GIST, more precise than RECIST; Measurement of a viable tumor
Only for GIST
Morphologic Response 2009 CT Anatomic and functional; Based on morphologic changes
Appropriate for bevacizumab treatment
For CRC liver met., not prospectively validated irRC 2009 CT, MRI Anatomic, size-based For the treatment with
immune-checkpoint inhibitors, capture of atypical response (pseudoprogression) The variability of interpretation irRECIST 2013 CT, MRI iRECIST 2017 CT, MRI imRECIST 2018 CT, MRI EORTC PET PERCIST
1.0 iPERCIST
1999, 2009, 2019 PET Metabolic Detection of early metabolic changes
Limited resolution for tumors less than 0.4 cm. In NSCLC patients, retrospective MDA criteria 2004 and 2010 CT, MRI, XR, SS Anatomic A comprehensive
evaluation of bone metastasis
Only for bone metastasis
RANO 2010 MRI Anatomic and functional; Based on contrast enhancement
Capture of
pseudoprogression and pseudoresponse
Only for brain tumors
CT: Computerized tomography; MRI: Magnetic resonance imaging; PET: Positron emission tomography; XR: Plain radiography; SS: Skeletal scintigraphy; WHO: World Health Organization; RECIST: Response Evaluation Criteria in Solid Tumors; EORTC: European Organization for Research in the Treatment of Cancer; iPERCIST: İmmune positron emission tomography Response Criteria; NSCLC: Non-small-cell lung cancer; GIST: Gastrointestinal stromal tumors; CRC: Colorectal cancer; mRECIST: Modified Response Evaluation Criteria In Solid Tumors; irRECIST: İmmune-related Response Evaluation Criteria in Solid Tumors; iRECIST: İmmunotherapy Response Evaluation Criteria in Solid Tumors; irRC: İmmune-specific related response criteria; imRECIST: Immune-Modified Response Evaluation Criteria In Solid Tumors; EASL: European Association for the Study of the Liver; qEASL: Quantitative
European Association for the Study of the Liver; MDA: MD Anderson; OS: Overall survival; HCC: Hepatocellular carcinoma.
Table 9 Radiation dose in adults for some radiology procedures[125]
Procedure Approximate effective radiation dose Comparable to natural background radiation for
Chest X-ray 0.1 mSv 10 d
CT-Head 2 mSv 8 mo
CT-Thorax 7 mSv 2 yr
CT–Abdomen and Pelvis 10 mSv 3 yr
PET/CT 25 mSv 8 yr
CT: Computed tomography; PET: Positron emission tomography; mSV: Millisievert.
REFERENCES
1 Karnofsky DA. Meaningful clinical classification of therapeutic responses to anticancer drugs. Clin Pharmacol Ther 1961; 2: 709-712 [PMID: 14454020 DOI: 10.1002/cpt196126709]
2 Moertel CG, Hanley JA. The effect of measuring error on the results of therapeutic trials in advanced
cancer. Cancer 1976; 38: 388-394 [PMID: 947531 DOI:
10.1002/1097-0142(197607)38:1<388::AID-CNCR2820380156>3.0.CO;2-A]
3 Levin VA, Crafts DC, Norman DM, Hoffer PB, Spire JP, Wilson CB. Criteria for evaluating patients
undergoing chemotherapy for malignant brain tumors. J Neurosurg 1977; 47: 329-335 [PMID: 894339
DOI: 10.3171/jns.1977.47.3.0329]
4 Macdonald DR, Cascino TL, Schold SC, Cairncross JG. Response criteria for phase II studies of
supratentorial malignant glioma. J Clin Oncol 1990; 8: 1277-1280 [PMID: 2358840 DOI:
10.1200/JCO.1990.8.7.1277]
5 World Health Organization. WHO Handbook for Reporting Results of Cancer Treatment. World Health
Organization Offset Publication No. 48; Geneva (Switzerland), 1979
6 Miller AB, Hoogstraten B, Staquet M, Winkler A. Reporting results of cancer treatment. Cancer 1981; 47:
207-214 [PMID: 7459811 DOI:
10.1002/1097-0142(19810101)47:1<207::aid-cncr2820470134>3.0.co;2-6]
7 Thiesse P, Ollivier L, Di Stefano-Louineau D, Négrier S, Savary J, Pignard K, Lasset C, Escudier B.
Response rate accuracy in oncology trials: reasons for interobserver variability. Groupe Français d'Immunothérapie of the Fédération Nationale des Centres de Lutte Contre le Cancer. J Clin Oncol 1997;
15: 3507-3514 [PMID: 9396404 DOI: 10.1200/JCO.1997.15.12.3507]
8 Therasse P, Arbuck SG, Eisenhauer EA, Wanders J, Kaplan RS, Rubinstein L, Verweij J, Van Glabbeke
M, van Oosterom AT, Christian MC, Gwyther SG. New guidelines to evaluate the response to treatment in solid tumors. European Organization for Research and Treatment of Cancer, National Cancer Institute of the United States, National Cancer Institute of Canada. J Natl Cancer Inst 2000; 92: 205-216 [PMID:
10655437 DOI: 10.1093/jnci/92.3.205]
9 Burzykowski T, Buyse M, Piccart-Gebhart MJ, Sledge G, Carmichael J, Lück HJ, Mackey JR, Nabholtz
JM, Paridaens R, Biganzoli L, Jassem J, Bontenbal M, Bonneterre J, Chan S, Basaran GA, Therasse P. Evaluation of tumor response, disease control, progression-free survival, and time to progression as potential surrogate end points in metastatic breast cancer. J Clin Oncol 2008; 26: 1987-1992 [PMID:
18421050 DOI: 10.1200/JCO.2007.10.8407]
10 Borcoman E, Nandikolla A, Long G, Goel S, Le Tourneau C. Patterns of Response and Progression to
Immunotherapy. Am Soc Clin Oncol Educ Book 2018; 38: 169-178 [PMID: 30231380 DOI:
10.1200/EDBK_200643]
11 Eisenhauer EA, Therasse P, Bogaerts J, Schwartz LH, Sargent D, Ford R, Dancey J, Arbuck S, Gwyther
S, Mooney M, Rubinstein L, Shankar L, Dodd L, Kaplan R, Lacombe D, Verweij J. New response evaluation criteria in solid tumours: revised RECIST guideline (version 1.1). Eur J Cancer 2009; 45: 228-247 [PMID: 19097774 DOI: 10.1016/j.ejca.2008.10.026]
12 Choi JH, Ahn MJ, Rhim HC, Kim JW, Lee GH, Lee YY, Kim IS. Comparison of WHO and RECIST
criteria for response in metastatic colorectal carcinoma. Cancer Res Treat 2005; 37: 290-293 [PMID:
19956529 DOI: 10.4143/crt.2005.37.5.290]
13 Zacharia TT, Saini S, Halpern EF, Sumner JE. CT of colon cancer metastases to the liver using modified
RECIST criteria: determining the ideal number of target lesions to measure. AJR Am J Roentgenol 2006;
186: 1067-1070 [PMID: 16554580 DOI: 10.2214/AJR.05.0038]
14 Kim HS, Kim JH, Yang I. Tumor response assessment by measuring the single largest lesion per organ in
patients with advanced non-small cell lung cancer. Lung Cancer 2014; 85: 385-389 [PMID: 25074845
DOI: 10.1016/j.lungcan.2014.07.008]
15 Kim HS, Kim JW, Kim JH, Choi DR, Han AR, Kim MJ, Kim BC, Zang DY. Single-lesion measurement
per organ for assessing tumor response in advanced gastric cancer. Oncology 2015; 88: 69-75 [PMID:
25277674 DOI: 10.1159/000367810]
16 Kim HS, Kim JH. Ideal number of target lesions per organ to measure in metastatic colorectal cancer. Oncol Lett 2014; 8: 1896-1900 [PMID: 25202433 DOI: 10.3892/ol.2014.2409]
17 Jang HJ, Cho JW, Park B, Choi HC, Kim HS, Kim JH. The assessment of tumor response by measuring
the single largest lesion per organ in metastatic tumors: a pooled analysis of previously reported data. J
Cancer 2015; 6: 169-176 [PMID: 25561982 DOI: 10.7150/jca.10912]
18 Lencioni R, Llovet JM. Modified RECIST (mRECIST) assessment for hepatocellular carcinoma. Semin Liver Dis 2010; 30: 52-60 [PMID: 20175033 DOI: 10.1055/s-0030-1247132]
![Table 2 Comparison of modified Response Evaluation Criteria in Solid Tumors, European Association for the Study of the Liver and quantitative European Association for the Study of the Liver criteria for hepatocellular carcinoma [18,19,22-25]](https://thumb-eu.123doks.com/thumbv2/9libnet/4464342.77579/8.892.83.805.132.350/comparison-response-evaluation-criteria-association-quantitative-association-hepatocellular.webp)

![Table 5 Immune response criteria [63-66]](https://thumb-eu.123doks.com/thumbv2/9libnet/4464342.77579/15.892.85.811.115.337/table-immune-response-criteria.webp)
![Table 6 Comparison of fluorodeoxyglucose-positron emission tomography response criteria [78,80,81,84]](https://thumb-eu.123doks.com/thumbv2/9libnet/4464342.77579/17.892.84.828.114.323/table-comparison-fluorodeoxyglucose-positron-emission-tomography-response-criteria.webp)
![Table 7 The 5-point scale scores and Deauville criteria in Hodgkin Lymphoma [85-88]](https://thumb-eu.123doks.com/thumbv2/9libnet/4464342.77579/18.892.83.813.115.279/table-point-scale-scores-deauville-criteria-hodgkin-lymphoma.webp)
![Table 9 Radiation dose in adults for some radiology procedures [125]](https://thumb-eu.123doks.com/thumbv2/9libnet/4464342.77579/19.892.87.811.174.317/table-radiation-dose-adults-for-some-radiology-procedures.webp)
