PRESIDENT
Dr. Mustafa AYDIN Istanbul Aydın University, TR HONORARY EDITOR
Prof. Dr. Hasan SAYGIN Istanbul Aydın University, TR EDITOR
Prof. Dr. Hasan Alpay HePeRkAN Istanbul Aydın University, Faculty of engineering
Mechanical engineering Department
Florya Yerleskesi, Inonu Caddesi, No.38, kucukcekmece, Istanbul, Turkey Fax: +90 212 425 57 59 - Tel: +90 212 425 61 51 / 22001
e-mail: [email protected] ASSISTANT EDITOR
Prof. Dr. Oktay ÖzCAN
Istanbul Aydın University, Faculty of engineering e-mail: [email protected]
Ass. Prof. eylem Gülce ÇOkeR
Istanbul Aydın University, Faculty of engineering e-mail: [email protected]
EDITORIAL BOARD
AYDIN Nizamettin Yildiz Technical University, TR
CATTANI Carlo University of Salerno, ITALY
CARLINI Maurizio University “La Tuscia”, ITALY
CHAPARRO Luis F. University of Pittsburg, USA
DIMIROVSkI Gregory M. SS C. and Methodius University, MAC
HARBA Rachid Orleans University, FR
HePBAŞLI Arif Yaşar University, TR
JeNANNe Rachid Orleans University, FR
kOCAkOYUN Şenay Istanbul Aydin University, TR
kONDOz Ahmet University of Surrey, Uk
RUIz Luis Manuel Sanches Universitat Politècnica de València, Spain
SIDDIQI Abul Hasan Sharda University, Indian
STAVROULAkIS Peter Telecommunication System Ins., GR
ADVISORY BOARD
AkAN Aydın Istanbul University, TR
AkATA erol Istanbul Aydin University, TR
ALTAY Gökmen Bahcesehir University, TR
ANARIM, emin Bosphorus University, TR
ASLAN zafer Istanbul Aydin University, TR
ATA Oğuz Istanbul Aydin University, TR
AYDIN Devrim Dogu Akdeniz University, TR
BAL Abdullah Yildiz Technical University, TR
BİLGİLİ erdem Piri Reis University, TR
CekIÇ Yalcin Bahcesehir University, TR
International Journal of Electronics, Mechanical and Mechatronics Engineering (IJEMME)
el kAHLOUT Yasser TUBITAk-MAM, TR
eRSOY Aysel Istanbul University, TR
VISUAL DESIGN & ACADEMIC STUDIES COORDINATION OFFICE Nabi SARIBAŞ - Gamze AYDIN - elif HAMAMCI - Çiğdem TAŞ
PRINTED BY
Armoninuans Matbaa Yukarıdudullu, Bostancı Yolu Cad. keyap Çarşı B-1 Blk. No:24 Ümraniye/İstanbul Tel: 0216 540 36 11 Fax: 0216 540 42 72 e-mail: [email protected]
ISSN: 2146-0604
GÜNeRHAN Huseyin ege University, TR
GÜNAY Banihan University of Ulster, Uk
GÜNGÖR Ali Bahcesehir University, TR
HePeRkAN Hasan Istanbul Aydın University, TR
kALA Ahmet Istanbul University, TR
kAR A. kerim Marmara University, TR
kARAMzADeH Saeid Istanbul Aydin University, TR
kARAÇUHA ertuğrul Istanbul Technical University, TR
kARAHOCA Adem Bahcesehir University, TR
kARAkOÇ Hikmet Anadolu University,TR
kARTAL Mesut Istanbul Technical University, TR
keNT Fuad Istanbul Technical University, TR
kILIÇ Niyazi Istanbul University,TR
kINCAY Olcay Yildiz Technical University, TR
kUNTMAN Ayten Istanbul University, TR
kOCAASLAN İlhan Istanbul University, TR
ÖNeR Demir Maltepe University, TR
Öz Hami kafkas University, TR
ÖzBAY Yüksel konya Selçuk University, TR
PAkeR Selçuk Istanbul Technical University, TR
PASTACI Halit Halic University, TR
SAYAN Ömer F. Telecommunications Authority, TR
ŞeNeR Uğur Istanbul Aydın University, TR
SİVRİ Nuket Istanbul University, TR
SÖNMez Ferdi Istanbul Arel University, TR
SOYLU Şeref Sakarya University, TR
UÇAN Osman Nuri Istanbul kemerburgaz University, TR
UĞUR Mukden Istanbul University, TR
YILMAz Aziz Air Force Academy, TR
YILMAz Reyat Dokuz eylul University, TR
From the Editor
Prof. Dr. Hasan Alpay HEPERKAN
Multiclass Cancer Diagnosis using Firefly Algorithm and K- Nearest Neighbor
Elnaz PASHAEI...1537
Least Significant Bit Gaped: A New Method for Image Steganography
Waleed TUZA, N. Gökhan KASAPOĞLU...1543
Identification of Vehicle Design and Transition of Traffic Signs with Image Processing Method
Metin BILGIN, Zekeriya ZEYBEK ...1555
CONTENTS
From the Editor
International Journal of Electronics, Mechanical and Mechatronics Engineering (IJEMME), is an
international multi-disciplinary journal dedicated to disseminate original, high-quality analytical and
experimental research articles on Robotics, Mechanics, Electronics, Telecommunications, Control Systems,
System Engineering, Biomedical and Renewable Energy Technologies. Contributions are expected to have
relevance to an industry, an industrial process, or a device. Subject areas could be as narrow as a specific
phenomenon or a device or as broad as a system.
The manuscripts to be published are selected after a peer review process carried out by our board of experts
and scientists. Our aim is to establish a publication which will be abstracted and indexed in the Engineering
Index (EI) and Science Citation Index (SCI) in the near future. The journal has a short processing period
to encourage young scientists.
Prof. Dr. Hasan HEPERKAN
Editor
Multiclass Cancer Diagnosis using Firefly Algorithm and K- Nearest
Neighbor
Elnaz PASHAEI
1Abstract - Among a large number of genes in microarray data sets that characterize the samples, many of them may be irrelevant to the learning tasks. Thus there is a need for reliable methods for gene representation, reduction, and selection, to speed up the processing rate, improve the classification accuracy, and to avoid incomprehensibility due to the high number of genes investigated. Classifying multiclass data sets is usually more difficult than classifying microarray datasets with only two classes. In this paper, we propose a new gene selection and classification strategy based on Firefly Algorithm (FFA) and K- Nearest Neighbor (KNN), suitable for multiclass microarray data sets. This approach is associated with Kruskal-test pre-filtering technique. The FFA is utilized to evolve gene subsets whose fitness is evaluated by a KNN classifier with leave-one-out-cross-validation (LOOCV) schema. The experimental results on three multiclass high-dimensional data sets show that the proposed method simplifies gene signatures effectively and obtains approximately higher classification accuracy compared to the best previously published results. Keywords: Gene selection, firefly algorithm, kruskal-test, k- nearest neighbor.
1.Introduction
The DNA microarray technology simultaneously allows for monitoring and measuring the expression level of a great number of genes in tissue samples. In microarray data sets the number of samples is much smaller than the number of genes. The classification of such data results with the known problem of “curse of dimensionality” and data overfitting. Therefore, for a successful disease diagnosis, it is necessary to select a small number of discriminative genes that are relevant for classification. Gene selection in microarray data analysis, not only increases the classification accuracy, but also decreases the processing time in the clinical setting. Hence, it is quite important to determine a minimum subset of genes for developing a successful disease diagnostic system. There are different methods developed for gene selection in recent years. These methods can be categorized into two main groups as the filter (ranking) and wrapper (gene subset selection) approach. The filter approach assesses each gene individually and ranks the genes from the most relevant to the less relevant using a certain 'filter' criteria. The filter approaches that can be used without restriction in the multiclass case are F-test, Kruskal-test, Random Forest (RF), and boosting. Multiclass generalization to the Wilcoxon rank sum test and the nonparametric pendant to the F-test is known as Kruskal-test. Wrapper approaches evaluate the goodness of each found gene subset by the estimation of the accuracy percentage of the specific classifier.
INTERNATIONAL JOURNAL OF ELECTRONICS, MECHANICAL AND MECHATRONICS ENGINEERING Vol.8 Num.2 - 2018 (1537-1542)
Multiclass Cancer Diagnosis using Firefly Algorithm and K- Nearest
Neighbor
Elnaz PASHAEI
1Abstract - Among a large number of genes in microarray data sets that characterize the samples, many of them may be irrelevant to the learning tasks. Thus there is a need for reliable methods for gene representation, reduction, and selection, to speed up the processing rate, improve the classification accuracy, and to avoid incomprehensibility due to the high number of genes investigated. Classifying multiclass data sets is usually more difficult than classifying microarray datasets with only two classes. In this paper, we propose a new gene selection and classification strategy based on Firefly Algorithm (FFA) and K- Nearest Neighbor (KNN), suitable for multiclass microarray data sets. This approach is associated with Kruskal-test pre-filtering technique. The FFA is utilized to evolve gene subsets whose fitness is evaluated by a KNN classifier with leave-one-out-cross-validation (LOOCV) schema. The experimental results on three multiclass high-dimensional data sets show that the proposed method simplifies gene signatures effectively and obtains approximately higher classification accuracy compared to the best previously published results. Keywords: Gene selection, firefly algorithm, kruskal-test, k- nearest neighbor.
1.Introduction
The DNA microarray technology simultaneously allows for monitoring and measuring the expression level of a great number of genes in tissue samples. In microarray data sets the number of samples is much smaller than the number of genes. The classification of such data results with the known problem of “curse of dimensionality” and data overfitting. Therefore, for a successful disease diagnosis, it is necessary to select a small number of discriminative genes that are relevant for classification. Gene selection in microarray data analysis, not only increases the classification accuracy, but also decreases the processing time in the clinical setting. Hence, it is quite important to determine a minimum subset of genes for developing a successful disease diagnostic system. There are different methods developed for gene selection in recent years. These methods can be categorized into two main groups as the filter (ranking) and wrapper (gene subset selection) approach. The filter approach assesses each gene individually and ranks the genes from the most relevant to the less relevant using a certain 'filter' criteria. The filter approaches that can be used without restriction in the multiclass case are F-test, Kruskal-test, Random Forest (RF), and boosting. Multiclass generalization to the Wilcoxon rank sum test and the nonparametric pendant to the F-test is known as Kruskal-test. Wrapper approaches evaluate the goodness of each found gene subset by the estimation of the accuracy percentage of the specific classifier.
Multiclass cancer Diagnosis using FireFly algorithM anD K- nearest neighbor
The classifier is trained only with the found genes. Wrapper approaches, when compared to the filter approaches, obtain better classification performance, however they are more of a computational cost. Evolutionary algorithms such as Genetic Algorithm (GA), Particle Swarm Optimization (PSO) [1-3], Ant Colony Optimization (ACO) [4], Binary Black Hole Algorithm (BBHA) [5], and Firefly Algorithm (FFA) [6] are some wrapper based approaches that have been provided and widely applied in bioinformatics. Since these approaches simultaneously evaluate many points on the search space, they can obtain excellent performance in gene expression data analysis. FFA has been used effectively to solve various NP-hard problems such as image processing, shape, and size optimization, set covering problem, manufacturing cell problem and gene selection [6-9]. However, combining FFA with 1NN classifier and applying it as gene selector on gene expression datasets has rarely been investigated by previous researchers. Gene selection and classifier design are known as two crucial factors in determining the performance of gene expression classification problem. In fact, the gene expression classification results depend on selected relevant gene subsets and performance of the classifiers. In classifier design, classification of multiclass (class >2) microarrays are usually more difficult than the classification of microarray datasets with only two classes. The support vector machines (SVMs) [6], nearest Shrunken Centroids Discriminant Analysis (SCDA) [10], Random Forest, and K-nearest neighbor (K-NN) [1] are three prevalent classifiers, which have been found useful in handling classification tasks in the case of the high dimensionality and multiclass data. The K-NN is one of the most popular nonparametric methods that were introduced by Fix and Hodges in 1951. K-NN is invariant to noisy data and not negatively affected when the training data is large. For error estimation on the classifier, the leave-one-out-cross-validation (LOOCV) schema can be utilized. The LOOCV technique is a straightforward and unbiased estimator that is widely used in small sample-sized data sets. In this paper, we are interested in gene selection and the classification of multiclass microarray data. For this purpose, we proposed a hybrid model that uses two techniques: LOOCV Kruskal-test and Firefly Algorithm (FFA) combined with one nearest neighbor (1-NN). First, to cope with the difficulty related to high-dimensional data, we use a Multi-class generalization to the Wilcoxon rank sum test as a pre-filtering step which ranks the genes from the most relevant to the less relevant for gene reduction. From each data set, 1000 tops ranked genes are selected. Second, the FFA combined with a 1NN classifier is used for final gene selection and classification. The gene subsets were measured by the LOOCV mean absolute error of one nearest neighbor (1-NN). Neighbors are calculated using their Euclidean distance.
The proposed approach is experimentally assessed on three long-familiar multiclass microarrays (9-Tumors, 11-Tumors, and Lung-Cancer). Comparisons with eight well-known classifiers and six state-of-the-art demonstrate that our proposed approach yields a minimum number of genes with high prediction performance. The remainder of this paper is organized as follows; we introduce the general scheme of our hybrid model in Section 2. Experimental results and Comparisons are presented in Section 3. Finally, conclusions are given in Section 4.
2. Gene Selection and Classification by FFA/1NN
In this section, we describe the hybrid FFA/1NN algorithm for performing gene selection and classification of multiclass microarray data. The FFA is designed both for identifying optimal gene subsets (solutions) and for final gene selection and classification. The 1NN-based classifier is used to ensure the fitness evaluation of each candidate solution as part of the firefly based wrapper algorithm.
a) The Firefly Algorithm
The Firefly Algorithm (FFA) is a novel nature-inspired algorithm which was presented by Xin-She Yang in 2008 [7] and applied for solving the linear design problem and multimodal optimization problem. The idea of the FFA is to mimic the behavior of flashing lights of fireflies. The FFA was developed by utilizing the following three idealized rules:
INTERNATIONAL JOURNAL OF ELECTRONICS, MECHANICAL AND MECHATRONICS ENGINEERING
Vol.8 Num.2 - 2018 (1537-1542) Elnaz PASHAEI
The classifier is trained only with the found genes. Wrapper approaches, when compared to the filter approaches, obtain better classification performance, however they are more of a computational cost. Evolutionary algorithms such as Genetic Algorithm (GA), Particle Swarm Optimization (PSO) [1-3], Ant Colony Optimization (ACO) [4], Binary Black Hole Algorithm (BBHA) [5], and Firefly Algorithm (FFA) [6] are some wrapper based approaches that have been provided and widely applied in bioinformatics. Since these approaches simultaneously evaluate many points on the search space, they can obtain excellent performance in gene expression data analysis. FFA has been used effectively to solve various NP-hard problems such as image processing, shape, and size optimization, set covering problem, manufacturing cell problem and gene selection [6-9]. However, combining FFA with 1NN classifier and applying it as gene selector on gene expression datasets has rarely been investigated by previous researchers. Gene selection and classifier design are known as two crucial factors in determining the performance of gene expression classification problem. In fact, the gene expression classification results depend on selected relevant gene subsets and performance of the classifiers. In classifier design, classification of multiclass (class >2) microarrays are usually more difficult than the classification of microarray datasets with only two classes. The support vector machines (SVMs) [6], nearest Shrunken Centroids Discriminant Analysis (SCDA) [10], Random Forest, and K-nearest neighbor (K-NN) [1] are three prevalent classifiers, which have been found useful in handling classification tasks in the case of the high dimensionality and multiclass data. The K-NN is one of the most popular nonparametric methods that were introduced by Fix and Hodges in 1951. K-NN is invariant to noisy data and not negatively affected when the training data is large. For error estimation on the classifier, the leave-one-out-cross-validation (LOOCV) schema can be utilized. The LOOCV technique is a straightforward and unbiased estimator that is widely used in small sample-sized data sets. In this paper, we are interested in gene selection and the classification of multiclass microarray data. For this purpose, we proposed a hybrid model that uses two techniques: LOOCV Kruskal-test and Firefly Algorithm (FFA) combined with one nearest neighbor (1-NN). First, to cope with the difficulty related to high-dimensional data, we use a Multi-class generalization to the Wilcoxon rank sum test as a pre-filtering step which ranks the genes from the most relevant to the less relevant for gene reduction. From each data set, 1000 tops ranked genes are selected. Second, the FFA combined with a 1NN classifier is used for final gene selection and classification. The gene subsets were measured by the LOOCV mean absolute error of one nearest neighbor (1-NN). Neighbors are calculated using their Euclidean distance.
The proposed approach is experimentally assessed on three long-familiar multiclass microarrays (9-Tumors, 11-Tumors, and Lung-Cancer). Comparisons with eight well-known classifiers and six state-of-the-art demonstrate that our proposed approach yields a minimum number of genes with high prediction performance. The remainder of this paper is organized as follows; we introduce the general scheme of our hybrid model in Section 2. Experimental results and Comparisons are presented in Section 3. Finally, conclusions are given in Section 4.
2. Gene Selection and Classification by FFA/1NN
In this section, we describe the hybrid FFA/1NN algorithm for performing gene selection and classification of multiclass microarray data. The FFA is designed both for identifying optimal gene subsets (solutions) and for final gene selection and classification. The 1NN-based classifier is used to ensure the fitness evaluation of each candidate solution as part of the firefly based wrapper algorithm.
a) The Firefly Algorithm
The Firefly Algorithm (FFA) is a novel nature-inspired algorithm which was presented by Xin-She Yang in 2008 [7] and applied for solving the linear design problem and multimodal optimization problem. The idea of the FFA is to mimic the behavior of flashing lights of fireflies. The FFA was developed by utilizing the following three idealized rules:
All fireflies are unisex and are attracted to other fireflies regardless of their sex.
The degree of the attractiveness of a firefly is proportional to its brightness, and thus for any two flashing fireflies, the dimmer firefly is attracted by the brighter one and moves towards it. The fewer distance between two fireflies means more brightness. Fireflies move randomly if there are no brighter fireflies nearby. The brightness of a firefly is determined by the value of the objective function.
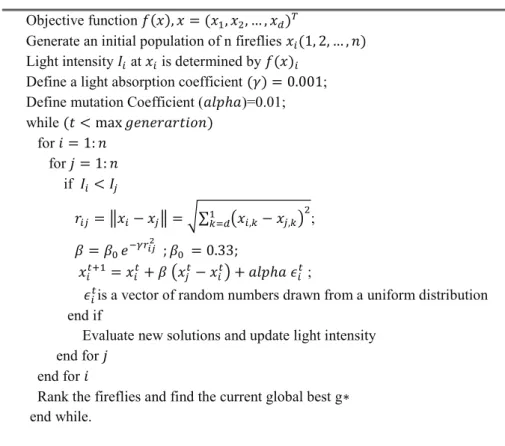
Based on these three rules the pseudo code of FFA is shown in Figure 1. Objective function 𝑓𝑓(𝑥𝑥), 𝑥𝑥 = (𝑥𝑥1, 𝑥𝑥2, … , 𝑥𝑥𝑑𝑑)𝑇𝑇
Generate an initial population of n fireflies 𝑥𝑥𝑖𝑖(1, 2, … , 𝑛𝑛) Light intensity 𝐼𝐼𝑖𝑖 at 𝑥𝑥𝑖𝑖 is determined by 𝑓𝑓(𝑥𝑥)𝑖𝑖
Define a light absorption coefficient (𝛾𝛾) = 0.001; Define mutation Coefficient (𝑎𝑎𝑎𝑎𝑎𝑎ℎ𝑎𝑎)=0.01; while (𝑡𝑡 < max 𝑔𝑔𝑔𝑔𝑛𝑛𝑔𝑔𝑔𝑔𝑎𝑎𝑔𝑔𝑡𝑡𝑔𝑔𝑔𝑔𝑛𝑛) for 𝑔𝑔 = 1: 𝑛𝑛 for 𝑗𝑗 = 1: 𝑛𝑛 if 𝐼𝐼𝑖𝑖< 𝐼𝐼𝑗𝑗 𝑔𝑔𝑖𝑖𝑗𝑗 = ‖𝑥𝑥𝑖𝑖− 𝑥𝑥𝑗𝑗‖ = √∑1𝑘𝑘=𝑑𝑑(𝑥𝑥𝑖𝑖,𝑘𝑘− 𝑥𝑥𝑗𝑗,𝑘𝑘)2; 𝛽𝛽 = 𝛽𝛽0 𝑔𝑔−𝛾𝛾𝑟𝑟𝑖𝑖𝑖𝑖 2 ; 𝛽𝛽0 = 0.33; 𝑥𝑥𝑖𝑖𝑡𝑡+1= 𝑥𝑥𝑖𝑖𝑡𝑡+ 𝛽𝛽 (𝑥𝑥𝑗𝑗𝑡𝑡− 𝑥𝑥𝑖𝑖𝑡𝑡) + 𝑎𝑎𝑎𝑎𝑎𝑎ℎ𝑎𝑎 𝜖𝜖𝑖𝑖𝑡𝑡 ;
𝜖𝜖𝑖𝑖𝑡𝑡is a vector of random numbers drawn from a uniform distribution end if
Evaluate new solutions and update light intensity end for 𝑗𝑗
end for 𝑔𝑔
Rank the fireflies and find the current global best g∗ end while.
Figure 1. Pseudo code of the firefly algorithm. b)Fireflies and initial population.
The Fireflies are binary-encoded; each allele (a bit) of the fireflies represents a gene. If an allele is “1” it indicates that this gene is kept in the gene subset and “0” means that the gene is not included in the subset. Thus, each firefly represents a gene subset. The firefly length is equal in the number of genes selected by the Kruskal test pre-processing (i.e. 1000 for each data set). The initial population of the FFA is randomly generated according to a uniform distribution.
Multiclass cancer Diagnosis using FireFly algorithM anD K- nearest neighbor
c)Objective function.
The fitness of a firefly, i.e. a subset of genes, is evaluated by LOOCV classification mean absolute error of 1NN classifier. In other words, the lower fitness value is gotten; the better gene subset may be obtained.
d)Stopping criterion.
The evolution process ends when a pre-defined number of generations (200) is reached. 3.Evaluation
a)Parameters Settings
Table 1 summarizes three multiclass gene expression data sets that are used for this study. These data sets have thousands of genes (high-dimensional data). They were downloaded from http://www.gems-system.org. All the experimental results reported in this article was acquired using WEKA open source machine learning software and R packages. Firstly, a Kruskal-test was applied for pre-processing in order to pre-select 1000- tops-ranked genes. For performing Kruskal-test, “CMA” package in R [11]was used. The genes were then applied in FFA. Next, the LOOCV mean absolute error of gene subsets that were produced by FFA, was measured by using KNN. Generally, in LOOCV, one sample among all samples is evaluated as testing data while the others are used as training data. This is repeated so that each observation in the sample is used once as the test data. The sizes of population and iterations for all data sets are set to 50 and 200, respectively. These parameters are same for cuckoo search. For FFA, except mutation type that must be set to bit-off, the remaining parameters are set as default.
b)Results and Comparisons
Firstly, in order to accelerate the speed of convergence and alleviate the burden of computation, 1000 top ranked informative genes were selected by Kruskal-test approach. Then to further reduce the number of marker genes and improve the classification accuracy, the FFA/1NN algorithm was applied on these 1000 genes.
Table 2 reports the LOOCV classification accuracy of the five classifiers without using any gene selection approach on 9-Tumor, 11-Tumors, and Lung cancer data sets. The results presented in this table imply that without using any gene selection approach, we cannot be able to capture the patterns that underlie the gene expression profiles. Table 3 shows the LOOCV classification accuracies of eight different classifiers on 1000 top ranked genes which were obtained by filter-based feature ranking approach (Kruskal-test).We compared the LOOCV classification accuracy of the FFA/1NN algorithm proposed in this paper with the following eight most popular algorithms; Cuckoo search/Naive Bayes, PART, 1NN, Boosted C5.0, Correlation-based Feature Subset selection (CFS)/Multinomial logistic regression, SVM with the polynomial kernel, Random Forest (RF), and SCDA. Experimental results show that our method resulted in higher averages of the classification accuracies on all data sets compared to the eight methods in Table 3.
To carry out our experiments, our FFA/1NN algorithm is run 5 times on each of the 9-Tumor, 11-Tumors, and Lung cancer multi-class microarray data sets (Table 4). Table 5 summarizes our results (Column 2) for these data sets with the results of six state-of-the-art methods from the literature (Columns 3-8). Two criteria are used to compare the results: the classification accuracy (first number) and the number of used genes (the number in parenthesis).
INTERNATIONAL JOURNAL OF ELECTRONICS, MECHANICAL AND MECHATRONICS ENGINEERING
Vol.8 Num.2 - 2018 (1537-1542) Elnaz PASHAEI
c)Objective function.
The fitness of a firefly, i.e. a subset of genes, is evaluated by LOOCV classification mean absolute error of 1NN classifier. In other words, the lower fitness value is gotten; the better gene subset may be obtained.
d)Stopping criterion.
The evolution process ends when a pre-defined number of generations (200) is reached. 3.Evaluation
a)Parameters Settings
Table 1 summarizes three multiclass gene expression data sets that are used for this study. These data sets have thousands of genes (high-dimensional data). They were downloaded from http://www.gems-system.org. All the experimental results reported in this article was acquired using WEKA open source machine learning software and R packages. Firstly, a Kruskal-test was applied for pre-processing in order to pre-select 1000- tops-ranked genes. For performing Kruskal-test, “CMA” package in R [11]was used. The genes were then applied in FFA. Next, the LOOCV mean absolute error of gene subsets that were produced by FFA, was measured by using KNN. Generally, in LOOCV, one sample among all samples is evaluated as testing data while the others are used as training data. This is repeated so that each observation in the sample is used once as the test data. The sizes of population and iterations for all data sets are set to 50 and 200, respectively. These parameters are same for cuckoo search. For FFA, except mutation type that must be set to bit-off, the remaining parameters are set as default.
b)Results and Comparisons
Firstly, in order to accelerate the speed of convergence and alleviate the burden of computation, 1000 top ranked informative genes were selected by Kruskal-test approach. Then to further reduce the number of marker genes and improve the classification accuracy, the FFA/1NN algorithm was applied on these 1000 genes.
Table 2 reports the LOOCV classification accuracy of the five classifiers without using any gene selection approach on 9-Tumor, 11-Tumors, and Lung cancer data sets. The results presented in this table imply that without using any gene selection approach, we cannot be able to capture the patterns that underlie the gene expression profiles. Table 3 shows the LOOCV classification accuracies of eight different classifiers on 1000 top ranked genes which were obtained by filter-based feature ranking approach (Kruskal-test).We compared the LOOCV classification accuracy of the FFA/1NN algorithm proposed in this paper with the following eight most popular algorithms; Cuckoo search/Naive Bayes, PART, 1NN, Boosted C5.0, Correlation-based Feature Subset selection (CFS)/Multinomial logistic regression, SVM with the polynomial kernel, Random Forest (RF), and SCDA. Experimental results show that our method resulted in higher averages of the classification accuracies on all data sets compared to the eight methods in Table 3.
To carry out our experiments, our FFA/1NN algorithm is run 5 times on each of the 9-Tumor, 11-Tumors, and Lung cancer multi-class microarray data sets (Table 4). Table 5 summarizes our results (Column 2) for these data sets with the results of six state-of-the-art methods from the literature (Columns 3-8). Two criteria are used to compare the results: the classification accuracy (first number) and the number of used genes (the number in parenthesis).
For all the data sets, the averages of the number of the selected genes for our work were smaller than the previous works [1-3, 12, 13]. As it can be observed, for the 9-Tumor data set, we obtained a classification rate of 90.66% using 43.2 genes, which is much better than that reported in [1-3, 12-14]. The study [13] has shown better classification accuracy than our work on Lung cancer data set but with a greater number of genes (99.52% with 6958 genes). Our approach offers the correct classification rate as 98.32% with only 21.8 genes. For 11-Tumors data set, our approach has achieved the highest (averaged) classification accuracy with the minimum number of genes. The same performance is achieved by [13], with a high number of selected genes.
Table 4 shows the detailed results of five independent runs of our FFA/1NN algorithm. As it can be observed, these results are quite stable in all data sets based on the standard deviations. For the 11-Tumors and Lung cancer data sets, each of the five runs obtains a classification rate of 97% and 98 % while for the 9-tumor data set, the best run gives a classification rate of 93.33. Even the worst obtains a classification rate of 88.33.
Experimental results show that our proposed Kruskal-test/FFA/1NN algorithm may select a smaller gene subset with better LOOCV classification accuracy than many other methods in almost all data sets. Therefore, it is more effective for gene subset selection and pattern classification on multiclass data sets.
4.Conclusion
In this paper, a new hybrid algorithm was presented for gene selection and classification of multiclass high dimensional microarray data. The FFA Algorithm employed KNN classifier to intelligently select the most convenient genes that could maximize the classification accuracy while ignoring the redundant and noisy genes. The proposed approach, compared to the existing methods, achieves better classification accuracy with significantly fewer numbers of genes.
References
[1] L. Y. Chuang, H. W. Chang, C. J. Tu, and C. H. Yang, "Improved binary PSO for feature selection using gene expression data," Computational Biology and Chemistry, vol. 32, pp. 29-38, 2008.
[2] B. Tran, B. Xue, and M. Zhang, "Improved PSO for Feature Selection on High-Dimensional Datasets," Springer
International Publishing Switzerland, pp. 503–515, 2014.
[3] E. Pashaei, M. Ozen, and N. Aydin, "A Novel Gene Selection Algorithm for cancer identification based on Random Forest and Particle Swarm Optimization," presented at the Proceedings of 2015 IEEE Conference on Computational Intelligence in Bioinformatics and Computational Biology (CIBCB), Niagara Falls, Canada, 2015. [4] Y. Hualong, G. Guochang, L. Haibo, S. Jing, and Z. Jing, "A Modified Ant Colony Optimization Algorithm for Tumor Marker Gene Selection," Genomics Proteomics Bioinformatics, vol. 7, pp. 200–208, 2009 Dec.
[5] E. Pashaei and N. Aydin, "Binary black hole algorithm for feature selection and classification on biological data,"
Applied Soft Computing, vol. 56, pp. 94-106, 2017.
[6] A. Srivastava, S. Chakrabarti, S. Das, S. Ghosh, and V. K. Jayaraman, "Hybrid Firefly Based Simultaneous Gene Selection and Cancer Classification Using Support Vector Machines and Random Forests," in Proceedings of
Seventh International Conference on Bio-Inspired Computing: Theories and Applications (BIC-TA 2012), India, 04
December 2012, pp. 485-494.
[7] X. S. Yang, "Firefly algorithm," Nature-Inspired Metaheuristic Algorithms, pp. 79-90, 2008.
[8] B. CRAWFORD, R. SOTO, M. OLIVARES-SUAREZ, W. PALMA, F. PAREDES, E. OLGU´IN, et al., "A Binary Coded Firefly Algorithm that Solves the Set Covering Problem," ROMANIAN JOURNAL OF
Multiclass cancer Diagnosis using FireFly algorithM anD K- nearest neighbor
[9] X.-S. Yang and X. He, "Firefly Algorithm: Recent Advances And Applications," Int. J. Swarm Intelligence, vol. 1, pp. 36-50, 2013.
[10] R. Tibshirani, T. Hastie, B. Narasimhan, and G. Chu, "Class prediction by nearest shrunken centroids with applications to DNA microarrays. ," Statistical Science, vol. 18, pp. 104-117, 2003.
[11] M. Slawski, M. Daumer, and A. L. Boulesteix, "CMA - A comprehensive Bioconductor package for supervised classification with high dimensional data," BMC Bioinformatics, vol. 9, 2008.
[12] A. J. Ferreira and M. r. A. T. Figueiredo, "An unsupervised approach to feature discretization and selection,"
Pattern Recognition, vol. 45, pp. 3048–3060, 2012.
[13] L. Y. Chuang, C. H. Yang, and C. H. Yang, "Tabu search and binary particle swarm optimization for feature selection using microarray data," J Comput Biol, vol. 16, pp. 1689–703, 2009.
[14] M. S. Mohamad, S. Omatu, S. Deris, M. Yoshioka, A. Abdullah, and Z. Ibrahim, "An enhancement of binary particle swarm optimization for gene selection in classifying cancer classes," Algorithms Mol Biol, vol. 8, pp. 1-11, 2013.
INTERNATIONAL JOURNAL OF ELECTRONICS, MECHANICAL AND MECHATRONICS ENGINEERING Vol.8 Num.2 - 2018 (1543-1553)
[9] X.-S. Yang and X. He, "Firefly Algorithm: Recent Advances And Applications," Int. J. Swarm Intelligence, vol. 1, pp. 36-50, 2013.
[10] R. Tibshirani, T. Hastie, B. Narasimhan, and G. Chu, "Class prediction by nearest shrunken centroids with applications to DNA microarrays. ," Statistical Science, vol. 18, pp. 104-117, 2003.
[11] M. Slawski, M. Daumer, and A. L. Boulesteix, "CMA - A comprehensive Bioconductor package for supervised classification with high dimensional data," BMC Bioinformatics, vol. 9, 2008.
[12] A. J. Ferreira and M. r. A. T. Figueiredo, "An unsupervised approach to feature discretization and selection,"
Pattern Recognition, vol. 45, pp. 3048–3060, 2012.
[13] L. Y. Chuang, C. H. Yang, and C. H. Yang, "Tabu search and binary particle swarm optimization for feature selection using microarray data," J Comput Biol, vol. 16, pp. 1689–703, 2009.
[14] M. S. Mohamad, S. Omatu, S. Deris, M. Yoshioka, A. Abdullah, and Z. Ibrahim, "An enhancement of binary particle swarm optimization for gene selection in classifying cancer classes," Algorithms Mol Biol, vol. 8, pp. 1-11, 2013.
Least Significant Bit Gaped: A New Method for Image Steganography
Waleed TUZA
1, Dr. Öğr. Üyesi N. Gökhan KASAPOĞLU
2Abstract - Steganography is an information security technique that provides a solution for hiding information. There are different types of cover mediums that can be used in steganography such as text or image steganography. We chose image steganography as our domain of work where the images are used as cover mediums to be our basis of experiments for the proposed LSBG method. One of the main well-known steganography methods is the least significant bit (LSB), however it has its limitations and therefore many approaches have been proposed to improve it. We propose a new improvement method defined as Least Significant Bit Gaped (LSBG) where the aim is to improve steganography imperceptibility compared to LSB by comparing the histogram analysis of LSB with LSBG methods and MSE measures. The proposed LSBG method will also offer a new key structure that will increase the complexity in secret data extraction and the level of information security.
Keywords: Steganography, Least Significant Bit, Least Significant Bit Gaped 1. Introduction
Steganography is the art of hiding data. It is an information security method that can be applied to secure the information by hiding it in a medium where the secret information cannot be observed. Steganography methods, in recent years, have been applied in the digital world where we deal with different digital media such as images, audio, or video data. Digital steganography works by using those digital mediums as cover mediums where the secret message is required to be in a digital data form too. The application of steganography simply consists of embedding secret information data in a selected cover medium to produce a stego medium where it holds the hidden data. There are wide applications where steganography can be used. Secret and covert communication systems, for instance, the military communications systems need to possess a high level of information security during transmission where steganography takes a place as one of the possible solutions [2]. Some of the widely used applications for steganography are watermarking and fingerprinting, which are used for protecting the copyrights and data property for the owners.
Another possible application area of steganography is the secure storage of information [12]. Steganography can be considered as a useful method to save information data in an undetectable way which is an important element for securing the data.
1 Dept. of Electrical and Electronics Engineering, Istanbul Aydin University, Istanbul, Turkey, [email protected]
Least significant Bit gaped: a new Method for iMage steganography
As mentioned before, steganography can use different types of cover mediums such as text medium, image medium, audio medium, and other types of mediums [7]. Also for secret messages, messages can be any kind of data medium like a text or an image.
1.1. Steganography Elements
As a system, the steganography method can be divided into four main elements as listed below:
Secret message: it is the message that will be embedded in the cover medium. It is actually the crucial element to be secured by hiding so that it cannot be detected. The secret message can be any type of data such as a simple text message or an image.
Cover object: it is the medium that will be used as a carrier of the embedded secret data. Selecting a suitable cover medium is very important for concealing the secret based on the steganography method requirements. Steganography key: the key can be considered as the control data part that you need when you want to apply
the inverse operation of steganography method and extract the secret message. Without the knowledge of the key, you will not be able to extract the secret message from the cover medium.
Stego object: it is the result carrier medium that contains the embedded secret message hidden inside it. 1.2. Steganography in Communication Systems
In covert communication systems, the most important parameter for steganography to be considered is imperceptibility. The main objective for the hidden data is to raise no suspicion regarding the cover medium being edited [4]. That is why the designer will try to maximize the level of imperceptibility on the expense of having reduced levels of capacity and robustness [3]. Improving imperceptibility can be done by reducing the amount of changes in the data values (pixel intensities) in the cover medium during the embedding of the secret data.
Using steganography as an information security technique can be very useful in communication systems. Especially in communication systems that are used for military applications where the communication of information is considered to be confidential and is very important not to be received and analyzed by third parties. That is why it is important to secure the information so that in case received by a third party, the data cannot be analyzed and that is where encryption and steganography come into play. Those information security techniques can be used as pre-stages in the communication system in order to secure the information signal from being used by a third party.
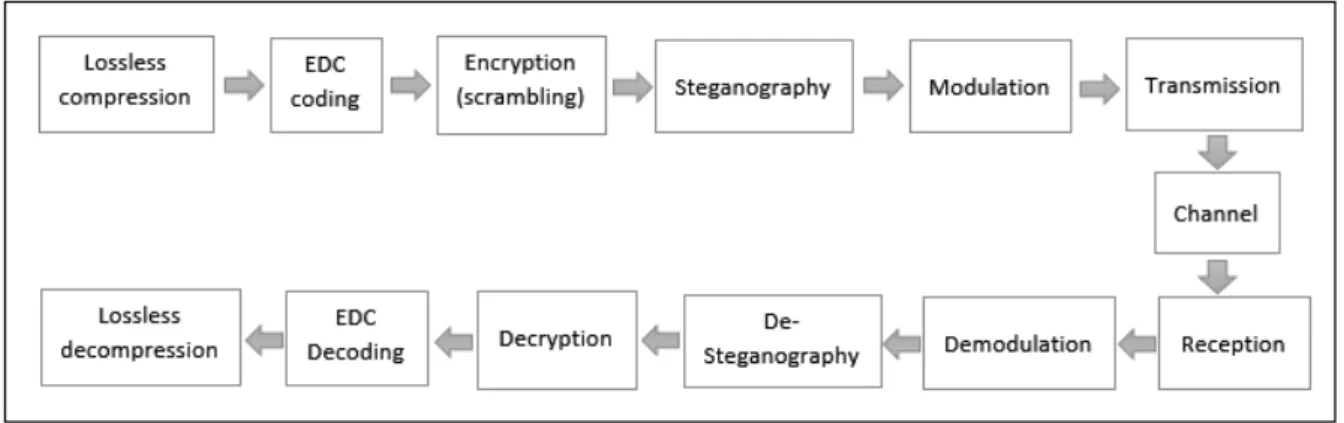
Using lossless compression as a pre-stage operation of steganography in the communication systems provides the capability of extracting and reconstructing the secret message 100% accurately [5]. Moreover, it is a great solution for reducing the capacity of the secret message. Error detection and correction (EDC) coding is used for ensuring the correct reconstruction of the embedded data. Below, Figure 1 shows a block diagram of the communication system that has encryption and steganography methods used for securing the secret data before transmitting it:
INTERNATIONAL JOURNAL OF ELECTRONICS, MECHANICAL AND MECHATRONICS ENGINEERING Vol.8 Num.2 - 2018 (1543-1553)
Waleed TUZA, N. Gökhan KASAPOĞLU
As mentioned before, steganography can use different types of cover mediums such as text medium, image medium, audio medium, and other types of mediums [7]. Also for secret messages, messages can be any kind of data medium like a text or an image.
1.1. Steganography Elements
As a system, the steganography method can be divided into four main elements as listed below:
Secret message: it is the message that will be embedded in the cover medium. It is actually the crucial element to be secured by hiding so that it cannot be detected. The secret message can be any type of data such as a simple text message or an image.
Cover object: it is the medium that will be used as a carrier of the embedded secret data. Selecting a suitable cover medium is very important for concealing the secret based on the steganography method requirements. Steganography key: the key can be considered as the control data part that you need when you want to apply
the inverse operation of steganography method and extract the secret message. Without the knowledge of the key, you will not be able to extract the secret message from the cover medium.
Stego object: it is the result carrier medium that contains the embedded secret message hidden inside it. 1.2. Steganography in Communication Systems
In covert communication systems, the most important parameter for steganography to be considered is imperceptibility. The main objective for the hidden data is to raise no suspicion regarding the cover medium being edited [4]. That is why the designer will try to maximize the level of imperceptibility on the expense of having reduced levels of capacity and robustness [3]. Improving imperceptibility can be done by reducing the amount of changes in the data values (pixel intensities) in the cover medium during the embedding of the secret data.
Using steganography as an information security technique can be very useful in communication systems. Especially in communication systems that are used for military applications where the communication of information is considered to be confidential and is very important not to be received and analyzed by third parties. That is why it is important to secure the information so that in case received by a third party, the data cannot be analyzed and that is where encryption and steganography come into play. Those information security techniques can be used as pre-stages in the communication system in order to secure the information signal from being used by a third party.
Using lossless compression as a pre-stage operation of steganography in the communication systems provides the capability of extracting and reconstructing the secret message 100% accurately [5]. Moreover, it is a great solution for reducing the capacity of the secret message. Error detection and correction (EDC) coding is used for ensuring the correct reconstruction of the embedded data. Below, Figure 1 shows a block diagram of the communication system that has encryption and steganography methods used for securing the secret data before transmitting it:
Figure 1: Covert communication system block diagram. 2. Least Significant Bit (LSB)
Least Significant Bit is a steganography method of embedding hidden data by using the least significant bits of the cover medium data bytes (image pixels).To simply summarize the way of embedding data in LSB method, LSB is located as the last bit from the right side of any binary value [7]. In LSB embedding, it is possible to use the last bit, last two bits, or the last three bits in the binary value of the byte or pixel for data embedding. Therefore, if we have a 1-byte pixel size, the minimum LSB capacity is 1 bit per pixel (bpp) [7]. For example, if we have a byte binary value of (11110101), the last LSB is (1), and the last two LSB bits are (01), also if one wants to know, the last three LSB bits are equal to (101).
For instance, let’s have three pixels of the cover image with binary values of (11110001 11110000 11110011) and if we want to embed a message of 3 bits as (110) in those three pixels then 1 bit is needed for LSB embedding in each pixel. By that, the result stego pixels are (11110001 11110001 11110010). As you can see for the first pixel, the secret bit is equal to last bit in the pixel and that is why the pixel LSB value is still the same. While in the second and the third pixels, the LSB bits were changed to the value of the second and third bits of the message as seen in red color. In Figure 2, we have another example to demonstrate the locations of the LSB pixels in a cover image. It is assumed that we have an (8x8) size cover image and we have a secret message that has a capacity of 24 bits. If we have used LSB with embedding two bits in each selected pixel, then we need a total of 12 pixels to carry the secret message. Therefore, the first 12 pixels in the cover image that are highlighted in grey, are used for LSB embedding. The remaining pixels that are highlighted in white in the cover image will be left untouched.
Least significant Bit gaped: a new Method for iMage steganography
Figure 2: An 8x8 pixel size stego image where the highlighted pixels in gray are the pixels used for LSB method.
3. Least Significant Bit Gaped (LSBG) Methodology
Basically, the concept covers embedding the secret message in certain pixels with a certain rate using LSB method. Also, LSBG method requires gap pixels with a certain rate where there are no data embedded in these pixels. Hence, in the stego medium, the pixels are divided into two parts. First, the LSB pixels that are to be used for LSB embedding are selected. The other part includes the gap pixels which can be defined as the pixels that are not selected for LSB embedding. The reason behind the name “gap pixels” originates from the fact that those pixels not being used for containing any data of the secret message, and that is why they can be considered as gaps. The gapping rate can vary from one LSB pixel to one gap pixel (1LSB to 1G), one LSB pixel to two gap pixels (1LSB to 2G), one LSB pixel to two gap pixels (1LSB to 3G), and so on. The main idea of applying such a method is to have the ability to distribute the secret embedded LSB pixels in the majority of the cover medium area (image pixel area) as much as possible. The ratio of LSB pixels to gap pixels depend on two main factors:
1. The capacity of the secret message to be hidden. The smaller the capacity of the secret message, the more possible gapping rates can be applied in the cover medium.
2. The capacity of the cover medium (cover image). The larger capacity of the cover image offers the capability of applying high variety of (LSB to G) rates.
Studying the previous two factors, we can select a suitable LSB to gap rate based on the capacity of the secret message and the capacity of the chosen cover image to apply LSBG method.
In LSBG method, the ratio of LSB pixels to gap pixels can be performed in either horizontal or vertical axes in the cover image. The selection of the axis can be made by the designer. In Figure 3, same as before, we assume having 12 pixels to carry the secret massage. LSBG method is applied with horizontal gaping and the LSBG gapping rate is 1LSB to 1G.
Figure 3: An 8x8 pixel size stego image where highlighted pixels in gray are the ones used for LSBG method with 1LSB /1G ratio in horizontal access.
3.1. Two-Dimensional LSBG (2D LSBG)
The LSBG gapping can be applied in the vertical or in the horizontal axes as explained previously. However, there is also the possibility of applying (two dimensional) LSBG gapping in both vertical and horizontal axes. The 2D LSBG provides a greater LSB pixels distribution in the cover medium.
In Figure 4, we have the same cover image with a size of 8x8 pixels and 2D LSBG method is applied with 1LSB to 1G rate where the gaping is done in both vertical and horizontal axes and the 12 LSB pixels are distributed as shown in the figure below.
Figure 4: An 8x8 pixel size stego image where highlighted pixels in gray are the ones used for 2D LSBG method with 1LSB /1G ratio.
3.2. Shifting Property for LSBG
Shifting property can be applied to either LSB or LSBG method where the aim is not to apply the steganography technique from the beginning of the cover medium but to shift the starting point (starting LSB pixel) with a certain number that is chosen by the designer. Applying this method will increase the difficulty of extracting the secret information from the LSB pixels by third parties since the starting point is only known by the designer. The shifting property can be used as an additional element to the steganography LSBG key elements.
In Figure 5 where the 2D LSBG method is used with the ratio of 1LSB to 1G, an additional shifting property was applied for placing the start point from the third row from up in the cover image as seen in the figure.
INTERNATIONAL JOURNAL OF ELECTRONICS, MECHANICAL AND MECHATRONICS ENGINEERING Vol.8 Num.2 - 2018 (1543-1553)
Waleed TUZA, N. Gökhan KASAPOĞLU
Figure 3: An 8x8 pixel size stego image where highlighted pixels in gray are the ones used for LSBG method with 1LSB /1G ratio in horizontal access.
3.1. Two-Dimensional LSBG (2D LSBG)
The LSBG gapping can be applied in the vertical or in the horizontal axes as explained previously. However, there is also the possibility of applying (two dimensional) LSBG gapping in both vertical and horizontal axes. The 2D LSBG provides a greater LSB pixels distribution in the cover medium.
In Figure 4, we have the same cover image with a size of 8x8 pixels and 2D LSBG method is applied with 1LSB to 1G rate where the gaping is done in both vertical and horizontal axes and the 12 LSB pixels are distributed as shown in the figure below.
Figure 4: An 8x8 pixel size stego image where highlighted pixels in gray are the ones used for 2D LSBG method with 1LSB /1G ratio.
3.2. Shifting Property for LSBG
Shifting property can be applied to either LSB or LSBG method where the aim is not to apply the steganography technique from the beginning of the cover medium but to shift the starting point (starting LSB pixel) with a certain number that is chosen by the designer. Applying this method will increase the difficulty of extracting the secret information from the LSB pixels by third parties since the starting point is only known by the designer. The shifting property can be used as an additional element to the steganography LSBG key elements.
In Figure 5 where the 2D LSBG method is used with the ratio of 1LSB to 1G, an additional shifting property was applied for placing the start point from the third row from up in the cover image as seen in the figure.
Least significant Bit gaped: a new Method for iMage steganography
Figure 5: An 8x8 pixel size stego image where highlighted pixels in gray are the ones used for 2D LSBG method with 1LSB /1G ratio and shift property.
3.3. LSB and LSBG capacity
The formula for finding the maximum possible capacity of LSB method in a cover image is shown in formula (1) below:
𝑀𝑀𝑀𝑀𝑀𝑀 {𝐶𝐶𝐿𝐿𝐿𝐿𝐿𝐿} = 𝑛𝑛𝑃𝑃. 𝑛𝑛𝑏𝑏 (1)
Where 𝑛𝑛𝑃𝑃 is total number of pixels and 𝑛𝑛𝑏𝑏 is total number of bits used per pixel. While the maximum possible capacity of LSBG method in a cover image is shown in formula (2) below:
𝑀𝑀𝑀𝑀𝑀𝑀{𝐶𝐶𝐿𝐿𝐿𝐿𝐿𝐿𝐿𝐿} =(𝑛𝑛𝑛𝑛𝑃𝑃. 𝑛𝑛𝑏𝑏
𝑔𝑔+ 1) (2)
Where 𝑛𝑛𝑔𝑔 is the number of gaps in the gapping rate. Finally, the maximum possible capacity of 2D LSBG method in a cover image is given in formula (3) below:
𝑀𝑀𝑀𝑀𝑀𝑀{𝐶𝐶2𝐷𝐷 𝐿𝐿𝐿𝐿𝐿𝐿𝐿𝐿} =(𝑛𝑛𝑛𝑛𝑃𝑃. 𝑛𝑛𝑏𝑏
𝑔𝑔+ 1)2 (3)
For a cover image of a selected pixel size of 256 x 256, Table 1 demonstrates the maximum capacity of the secret data to be embedded when using LSB and LSBG at different possible gapping rates for 1 byte pixel capacity for LSB and LSBG.
Table 1. Maximum capacity for cover image with 256x256 pixel size.
Method Max. capacity
LSB (2 bpp) 131,072 bits (16,384 byte) LSBG (2 bpp) (1LSB to 1G) 65,536 bits (8,192 byte) LSBG (2 bpp) (1LSB to 3G) 32,768 bits (4,096 byte) LSBG (2 bpp) (1LSB to 7G) 16,384 bits (2,048 byte) LSBG (2 bpp) (1LSB to 15G) 8,192 bits (1,024 byte) LSBG (2 bpp) (1LSB to 31G) 4,096 bits (512 byte) LSBG (2 bpp) (1LSB to 63G) 2,048 bits (256 byte) LSBG (2 bpp) (1LSB to 127G) 1,024 bits (128 byte)
As it can be noticed that the more you increase the gapping rate the less capacity it can support for embedding the secret message. From the given secret message capacity, a suitable gapping rate that supports a greater embedding capacity is selected for carrying the secret message .
3.3. LSBG Key Elements
One of the main improvement points of LSBG over LSB is the complexity of the key elements of LSBG method. In LSBG method, the length of the secret message and the LSB method’s embedding rate per pixel are not enough alone. One actually needs to have all the elements of the LSBG key to be able to extract the embedded secret message successfully. The LSBG key elements can be defined as follows:
- The capacity of the secret message (Total number of the bits of the secret bit stream). - The selection of number of bits to be embedded in each pixel by the designer. - The selection of the ratio of LSB pixels to gap pixels to be used for data embedding.
- The selection of the start point of LSBG embedding. An additional applicable element by using shifting property.
- The LSB sequence number in the LSB to G ratio. (In case multiple messages multiplexing is used). - The possible usage of encryption (scrambling) before applying LSBG method as pre-stage. Adding the key
of encryption will cause the secret bits to be embedded in a non-sequential way in the selected LSB pixels. - The possible usage of Lossless compression method for the secret message before applying LSBG method.
Adding the key of compression as a pre-stage will help reduce the capacity of the secret message and also the secret message cannot be analyzed during extraction from LSBG unless it is decompressed
- Band selection for LSBG method. This is applicable certainly; if multiple bands colored images are used like RGB images. This way one band would be selected while the other band will remain the same. 4. Designed Experiments and Results
The used secret image is a 50x50 pixel size white background image with fixed pixel value of 255 (the binary value of 11111111). This secret image was selected as a severe case as it causes a high amount of deviation in the stego histogram which is important since it requires applying different methods that are used in the experiments, demonstrating the great difference clearly in the stego histogram between the each embedding method used. The used cover image is a grayscale watch image with the size of 256x256 pixels.
Embedding methods used in this case:
- Least Significant Bit method, (LSB) (2 bpp).
- Least Significant Bit Gaped method, (2D LSBG) (2 bpp) (1LSB to 1G).
The evaluation process is conducted by analyzing the histograms of the stego images and making a comparison of the histograms of LSB and LSBG methods. Mean square error (MSE) and Peak Signal to Noise Ratio (PSNR) are measured to determine the amount of change between the cover and stego mediums for both LSB and LSBG methods. The less MSE value indicates less difference between the cover image and stego image and by that the imperceptibility level is increased.
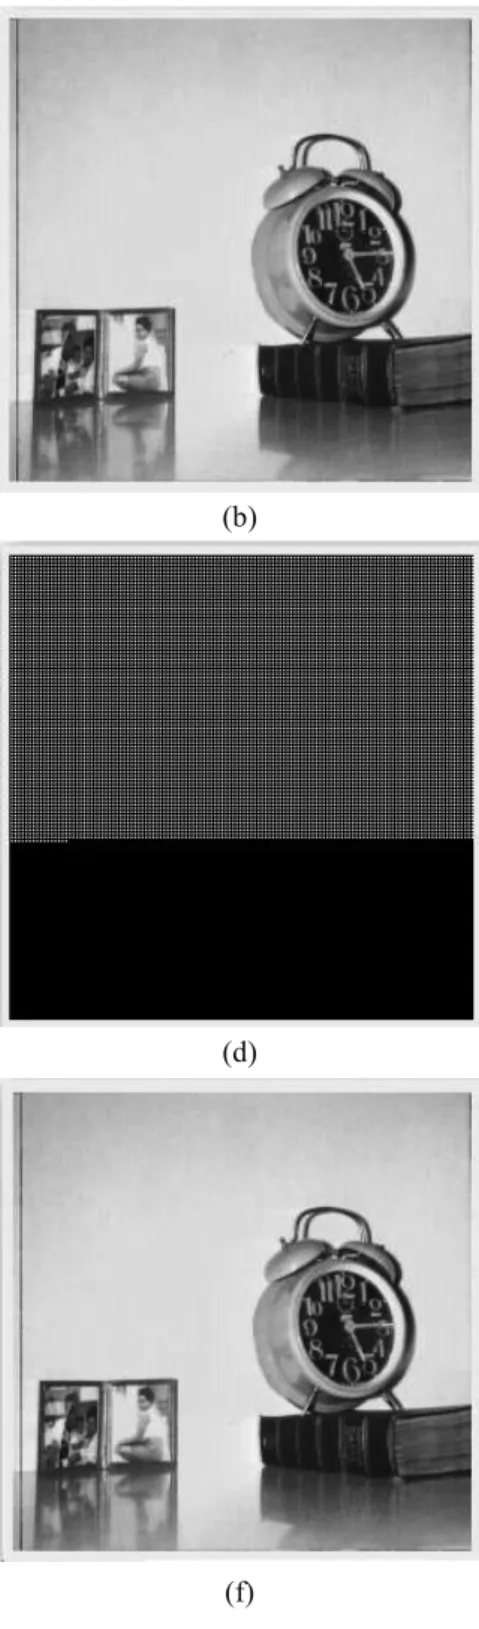
The following figure is composed in six subfigures, the selected secret white image is shown in Figure 6 (a). Watch image is the selected cover image in the experiment as seen in Figure 6 (b). A demonstration figure with the cover image pixel size was generated to highlight the selected pixels for embedding in white and remaining unchanged pixels in black. In Figure 6 (c) we can see the demonstration figure of selected pixels for LSB embedding and in Figure 6 (d) the demonstration figure of selected pixels for 2D LSBG embedding. Figure 6 (e) shows the result stego image after using LSB embedding and Figure 6 (f) shows the result stego image using 2D LSBG method.
INTERNATIONAL JOURNAL OF ELECTRONICS, MECHANICAL AND MECHATRONICS ENGINEERING Vol.8 Num.2 - 2018 (1543-1553)
Waleed TUZA, N. Gökhan KASAPOĞLU
As it can be noticed that the more you increase the gapping rate the less capacity it can support for embedding the secret message. From the given secret message capacity, a suitable gapping rate that supports a greater embedding capacity is selected for carrying the secret message .
3.3. LSBG Key Elements
One of the main improvement points of LSBG over LSB is the complexity of the key elements of LSBG method. In LSBG method, the length of the secret message and the LSB method’s embedding rate per pixel are not enough alone. One actually needs to have all the elements of the LSBG key to be able to extract the embedded secret message successfully. The LSBG key elements can be defined as follows:
- The capacity of the secret message (Total number of the bits of the secret bit stream). - The selection of number of bits to be embedded in each pixel by the designer. - The selection of the ratio of LSB pixels to gap pixels to be used for data embedding.
- The selection of the start point of LSBG embedding. An additional applicable element by using shifting property.
- The LSB sequence number in the LSB to G ratio. (In case multiple messages multiplexing is used). - The possible usage of encryption (scrambling) before applying LSBG method as pre-stage. Adding the key
of encryption will cause the secret bits to be embedded in a non-sequential way in the selected LSB pixels. - The possible usage of Lossless compression method for the secret message before applying LSBG method.
Adding the key of compression as a pre-stage will help reduce the capacity of the secret message and also the secret message cannot be analyzed during extraction from LSBG unless it is decompressed
- Band selection for LSBG method. This is applicable certainly; if multiple bands colored images are used like RGB images. This way one band would be selected while the other band will remain the same. 4. Designed Experiments and Results
The used secret image is a 50x50 pixel size white background image with fixed pixel value of 255 (the binary value of 11111111). This secret image was selected as a severe case as it causes a high amount of deviation in the stego histogram which is important since it requires applying different methods that are used in the experiments, demonstrating the great difference clearly in the stego histogram between the each embedding method used. The used cover image is a grayscale watch image with the size of 256x256 pixels.
Embedding methods used in this case:
- Least Significant Bit method, (LSB) (2 bpp).
- Least Significant Bit Gaped method, (2D LSBG) (2 bpp) (1LSB to 1G).
The evaluation process is conducted by analyzing the histograms of the stego images and making a comparison of the histograms of LSB and LSBG methods. Mean square error (MSE) and Peak Signal to Noise Ratio (PSNR) are measured to determine the amount of change between the cover and stego mediums for both LSB and LSBG methods. The less MSE value indicates less difference between the cover image and stego image and by that the imperceptibility level is increased.
The following figure is composed in six subfigures, the selected secret white image is shown in Figure 6 (a). Watch image is the selected cover image in the experiment as seen in Figure 6 (b). A demonstration figure with the cover image pixel size was generated to highlight the selected pixels for embedding in white and remaining unchanged pixels in black. In Figure 6 (c) we can see the demonstration figure of selected pixels for LSB embedding and in Figure 6 (d) the demonstration figure of selected pixels for 2D LSBG embedding. Figure 6 (e) shows the result stego image after using LSB embedding and Figure 6 (f) shows the result stego image using 2D LSBG method.
Least significant Bit gaped: a new Method for iMage steganography
(a) (b)
(c) (d)
(e) (f)
Figure 6: (a) Secret image; (b) cover image before embedding; (c) a demonstration figure of the selected pixels for embedding in white for LSB method (d) a demonstration figure of the selected pixels for embedding in white for
INTERNATIONAL JOURNAL OF ELECTRONICS, MECHANICAL AND MECHATRONICS ENGINEERING Vol.8 Num.2 - 2018 (1543-1553)
Waleed TUZA, N. Gökhan KASAPOĞLU
(a) (b)
(c) (d)
(e) (f)
Figure 6: (a) Secret image; (b) cover image before embedding; (c) a demonstration figure of the selected pixels for embedding in white for LSB method (d) a demonstration figure of the selected pixels for embedding in white for
2D LSBG (1LSB to 1G) method; (e) the stego image using LSB (f) the stego image using LSBG (1LSB to 1G).
In Figure 7 which is composed of three subfigures, the histogram is generated for the selected cover image before embedding as seen in Figure 7 (a). The generated histogram of the resulting stego image acquired by using LSB method is shown in Figure 7 (b). Finally, in Figure 7 (c), we can observe the generated histogram of the resulting stego image acquired by the 2D LSBG method.
(a)
(b) (c)
Figure 7: (a) Histogram of the cover image before embedding; (b) Histogram of the stego image after LSB embedding; (d) Histogram of the stego image after 2D LSBG (1LSB to 1G) embedding.
From the analysis of the histogram results with the cases applied, we can see the stego histogram having a high deviation that is in a specific range of the histogram and can only be noticed when compared to the cover histogram in a simple LSB method. In 2D LSBG method, on the other hand, the deviation in stego image histogram spreads in a higher range and the range cannot be accurately defined.
Least significant Bit gaped: a new Method for iMage steganography
The MSE and PSNR measurements of the given cases are listed below in Table 2: Table 2. MSE & PSNR Results.
Secret Cover image Method MSE PSNR
White image Watch image LSB (2 bpp) 0.5467 50.7528
White image Watch image 2D LSBG (2 bpp) (1LSB to 1G) 0.5011 51.1307
If we study the MSE and PSNR results above, we notice the improvement achieved by LSBG method by reducing the MSE value and increasing the PSNR value compared to the applied LSB method.
5. Conclusion
Compared to LSB, applying LSBG method distributes and spreads deviation in a higher range in the histogram of the stego image. The interesting improvement is that the deviation effect is getting reduced since the deviation itself has been stretched and distributed in the histogram range.
For MSE and PSNR results of the given case, we can conclude that the LSBG method improved the system performance compared to LSB method by reducing the MSE value and logically increasing the PSNR value. As mentioned before, MSE improvement indicates an imperceptibility improvement in the stego image. For some other cases and experiments using other cover images, we did not have the same improvement in the MSE and PSNR values. This specific point shows the importance of selecting a suitable cover image for LSBG method which ensures the MSE and PSNR improvement.
According to our study, we recommend selecting a cover image with a narrow dynamic range histogram in order to ensure the improvement of the performance in applying LSBG method. We suggest using multiple options for cover images and applying multiple LSBG rates to them and analyzing the results, the case with the best result can be chosen. One recommendation that can be made is to apply the highest LSBG rate possible to ensure a greater distribution of LSB embedded pixels in the selected cover image. Another recommendation is to apply the shifting property of LSBG to enhance the key complexity of the used steganography method.
INTERNATIONAL JOURNAL OF ELECTRONICS, MECHANICAL AND MECHATRONICS ENGINEERING Vol.8 Num.2 - 2018 (1543-1553)
Waleed TUZA, N. Gökhan KASAPOĞLU
The MSE and PSNR measurements of the given cases are listed below in Table 2: Table 2. MSE & PSNR Results.
Secret Cover image Method MSE PSNR
White image Watch image LSB (2 bpp) 0.5467 50.7528
White image Watch image 2D LSBG (2 bpp) (1LSB to 1G) 0.5011 51.1307
If we study the MSE and PSNR results above, we notice the improvement achieved by LSBG method by reducing the MSE value and increasing the PSNR value compared to the applied LSB method.
5. Conclusion
Compared to LSB, applying LSBG method distributes and spreads deviation in a higher range in the histogram of the stego image. The interesting improvement is that the deviation effect is getting reduced since the deviation itself has been stretched and distributed in the histogram range.
For MSE and PSNR results of the given case, we can conclude that the LSBG method improved the system performance compared to LSB method by reducing the MSE value and logically increasing the PSNR value. As mentioned before, MSE improvement indicates an imperceptibility improvement in the stego image. For some other cases and experiments using other cover images, we did not have the same improvement in the MSE and PSNR values. This specific point shows the importance of selecting a suitable cover image for LSBG method which ensures the MSE and PSNR improvement.
According to our study, we recommend selecting a cover image with a narrow dynamic range histogram in order to ensure the improvement of the performance in applying LSBG method. We suggest using multiple options for cover images and applying multiple LSBG rates to them and analyzing the results, the case with the best result can be chosen. One recommendation that can be made is to apply the highest LSBG rate possible to ensure a greater distribution of LSB embedded pixels in the selected cover image. Another recommendation is to apply the shifting property of LSBG to enhance the key complexity of the used steganography method.
References
[1] R. J. Anderson and F. A. P. Petitcolas, "On the Limits of Steganography," IEEE Journal on Selected Areas in
Communications, vol. 16, no. 4, pp. 474 - 481, 1998.
[2] Petitcolas, F. A. P. R. J. Anderson and M. G. Kuhn, "Information Hiding - A Survey," Proceedings of the
IEEE, vol. 87, no. 7, pp. 1062 - 1078, 1999.
[3] L. M. Marvel, C. G. Boncelet and C. T. Retter, "Spread Spectrum Image Steganography," IEEE Transactions
on Image Processing, vol. 8, no. 8, pp. 1075 - 1083, 1999.
[4] N. Nikolaidis and I. Pitas, "Digital Image Watermarking: an Overview," in Proceedings IEEE International
Conference on Multimedia Computing and Systems, 1999.
[5] N. F. Johnson and S. Jajodia, "Exploring Steganography: Seeing the Unseen," IEEE, Computer , vol. 31, no. 2, pp. 313 - 336, 1998.
[6] W. Bender, D. Gruhl, N. Morimoto and A. Lu, "Techniques for data hiding," IBM Systems Journal, vol. 35, no. 3.4, pp. 313 - 336, 1996.
[7] G. L. Smitha and E. Baburaj, "A Survey on Image Steganography Based on Least Significant Bit Matched Revisited (LSBMR) Algorithm," in International Conference on Emerging Technological Trends (ICETT) , 2016.
[8] T. Shelare and V. Powar, "A Secure Data Transmission Approach Using B+trees In Steganography," in
International Conference on Automatic Control and Dynamic Optimization Techniques (ICACDOT), 2016.
[9] J. Kumar, "A Novel Approach to Image Steganography using Quadtree Partition," in 2nd International
Conference on Next Generation Computing Technologies (NGCT), 2016.
[10] A. Abuadbba and I. Khalil, "Walsh-Hadamard Based 3D Steganography for Protecting Sensitive Information in Point-of-Care," IEEE Transactions on Biomedical Engineering, vol. 64, no. 9, pp. 2186 - 2195, 2017. [11] V. Sharon, B. Karthikeyan, S. Chakravarthy and V. Vaithiyanathan, "Stego Pi : An Automated Security
Module for Text and Image Steganography using Raspberry Pi," in International Conference on Advanced
Communication Control and Computing Technologies (ICACCCT), 2016.
[12] A. A. J. Altaay, S. b. Sahib and M. Zamani, "An Introduction to Image Steganography Techniques," in
International Conference on Advanced Computer Science Applications and Technologies (ACSAT), 2012.
[13] M. Kude and M. Borse, "Skintone Detection Based Steganography Using Wavelet Transform," in
International Conference on Automatic Control and Dynamic Optimization Techniques (ICACDOT), 2016.
[14] J. Fridrich, M. Goljan and R. Du, "Detecting LSB Steganography in Color and Gray-Scale Images," IEEE


![Figure 2. Before Histogram Equalization [3]](https://thumb-eu.123doks.com/thumbv2/9libnet/4174171.64399/29.892.123.758.127.438/figure-before-histogram-equalization.webp)
![Figure 4. RGB - HSV scales [4]](https://thumb-eu.123doks.com/thumbv2/9libnet/4174171.64399/30.892.492.705.137.350/figure-rgb-hsv-scales.webp)
