The effects of somatic cell count on milk yield and milk composition
in Holstein cows
Ertuğrul Kul1*, Aziz Şahin1, Savaş Atasever2, Emre Uğurlutepe1, and Mustafa Soydaner1
1Department of Animal Science, Faculty of Agriculture, University of Kırşehir Ahi Evran, Kırşehir, Turkey 2Department of Animal Science, Faculty of Agriculture, University of Ondokuz Mayis, Samsun, Turkey
________________________________________________________________________________________
KUl, E., A. ŞAHİn, S. ATASEvEr, E. UğUrlUTEpE, M. SoydAnEr: The effects of somatic cell count on milk yield and milk composition in Holstein cows. vet. arhiv 89, 143-154, 2019.
ABSTrACT
This study was conducted to assess the impact of somatic cell count (SCC) on the test day milk yield (TDMY) and milk composition parameters (fat, solids-not-fat, protein and lactose) of Holstein cows raised in the Kırşehir province of Turkey. A total of 1194 raw milk samples were collected from 195 Holstein cows at different stages of lactation (from 1 to 7), parities (from 1 to 3) and calving seasons (autumn, winter, spring and
summer). Also, TDMY and milk composition traits were tested by SCC in four groups (<100×103, 100-200×103,
201-500×103 and >500×103 cells/mL). For statistical evaluation, SCC data were converted to log
10 base. The
overall means of log10SCC, TDMY, fat, solids-not-fat (SNF), protein and lactose were determined as 4.95 ±
0.016, 33.36 ± 0.232 kg/day, 3.39 ± 0.021%, 9.04 ± 0.013%, 3.32 ± 0.005% and 4.92 ± 0.007%, respectively. Log10SCC, TDMY, fat, SNF, protein and lactose were significantly affected by the stage of lactation, parity and calving seasons (P<0.05). An increase in the SCC was accompanied by a decrease in the milk yield as well as
its content (P<0.05). Cows’ milk with high SCC (>201×103 cells/mL) had a lower TDMY than milk with lower
SCC (<100×103 and 100-200 cells/mL). However, the lowest fat, SNF, protein and lactose were determined in
milk with SCC >500×103 cells/mL. It was concluded that SCC in milk should not exceed 500×103 cells/mL for
Holstein cows, suggesting that monthly control of SCC may be effective for improving milk production and milk quality in Holstein cows.
Key words: Holstein cow; somatic cell count; milk production; milk fat; milk protein; lactose
________________________________________________________________________________________
Introduction
Somatic cell count (SCC) is the body's natural defense system and a measure of the white blood cell count in milk (ACATINCĂI et al., 2008). Somatic cells, which are mainly *Corresponding author:
Dr. Ertuğrul Kul, Department of Animal Science, Faculty of Agriculture, University of Kırşehir Ahi Evran, Kırşehir, Turkey, Phone: +90 544 790 5392; Fax: +90 386 280 4832, E-mail: [email protected]
composed of macrophages, lymphocytes polymorph nuclear cells and some epithelial cells, are naturally present in milk (PAVEL and GAVAN, 2011). It has been revealed that SCC increases when mastitis is characterized by inflammation due to bacterial infections in the mammary gland (ACATINCĂI et al., 2008; MOSLEHISHAD et al., 2010). Elevated SCC may contribute to proteolysis and lipolysis of the milk constituents (RAMOS et al., 2015). Increased proteolysis reduces the economic value of milk by its negative impact on protein functionality. Therefore SCC, which is a universally accepted parameter in the evaluation of udder health status (GUO et al., 2010; CINAR et al., 2015), is widely used for monitoring milk quality and raw milk pricing in dairy farming (SERT et al., 2016).
High SCC causes great serious economic losses to both producers and the dairy industry (RAMOS et al., 2015). The main reason for these losses related to elevated SCC is decreased milk yield in cows (SERT et al., 2016). Besides, high SCC in milk adversely affects the quality of raw milk and dairy products, due to deteriorated flavor quality and shelf life (SOBCZUK-SZUL et al., 2015). The performance of processed milk and milk products are affected by milk quality (NAJAFI et al., 2009).
Milk yield and its composition can be very variable, and affected by multiple interrelated factors, including genetic and non-genetic factors (SOBCZUK-SZUL et al., 2015). Parity (ERDEM et al., 2007; KUL and ERDEM, 2008), stage of lactation (ERDEM et al., 2010; ATASEVER and STÁDNÍK, 2015) and season (BERTOCCHI et al., 2014) are the important non-genetic factors affecting the yield and composition of a cow’s milk. However, the correlations between these parameters and SCC in the milk from herds with low and high SCC is not fully understood.
There are few and scarce data regarding the relationships between SCC, milk yield and milk composition, and the factors that affect these in Holstein cows in Turkey. Thus, further studies are needed to determine regarding these field. The aim of this study was to investigate the effects of different SCC levels on raw milk on milk yield and composition, and the relationships between SCC, milk yield and milk composition in Turkish Holstein populations. Additional objectives were to investigate the parity, stage of lactation and seasonal factors that affect SCC, milk yield and milk components.
Materials and methods
A total of 1194 milk yield records of 195 Holstein cows were analyzed. Data were obtained from a private farm from November 2014 to July 2016 in the Kırşehir province of Turkey. The test day milk yield (TDMY) of each cow was recorded daily using a computerized system.
All animals were housed in a free stall and were in good health. Feeding management on the farms was not altered during the sampling. The cows were milked three times per day and each milking was recorded for each cow. Individual milk samples were collected
during the morning milking in sterile bottles of 50 mL using a special sample collecting cup, mounted on the automatic milking system, and thereafter kept in ice and immediately transported to the laboratory. The raw samples were stored at +4 °C, and then analyzed within 5-6 h of collection.
The SCC was determined with a DCC (DeLaval Cell Counter, DeLaval, Tumba, Sweden), while fat content, protein content, lactose and solids-not-fat (SNF) were determined using Lacto Star (Funke-Gerber, Labortechnik, Article No 3510, Berlin, Germany). The actual SCC were transformed using a log10 transformation to avoid bias of the mean by extremely high raw SCC.
The cows were grouped as first, second and third parities. The milk samples were collected at 30 days intervals and at 30 ± 15, 60 ± 15, 90 ± 15, 120 ± 15, 150 ± 15, 210 ± 15 and 270 ± 15 days of lactation. The research material was divided into four groups according to the SCC values: <100×103, 100-200×103, 201-500 ×103 and >500×103 cells
/mL. To evaluate by calving season, four groups were formed: 1 = autumn (September to November); 2 = winter (December to February); 3 = spring (March to May); 4 = summer (June to August).
The following linear model was used to examine the influence of parity, stage of lactation and calving season on SCC, TDMY, fat content, SNF, protein content and lactose:
Yijkl = μ + Ai + Bj + Ck + εijkl
where
Yijkl is the observation value, μ is the overall mean,
Ai is effect of parity (i = 1, 2, 3)
Bj is effect of lactation stage (j = 30 ± 15, 60 ± 15, 90 ± 15, 120 ± 15, 150 ± 15, 210 ± 15, 270 ± 15) Ck is effect of calving season (k = autumn, winter, spring, summer)
ɛijkl is random error.
Data were analyzed using the general linear model (GLM) procedure of SPSS 13.0 for Windows. The means were compared with Duncan’s multiple range test.
results and discussion
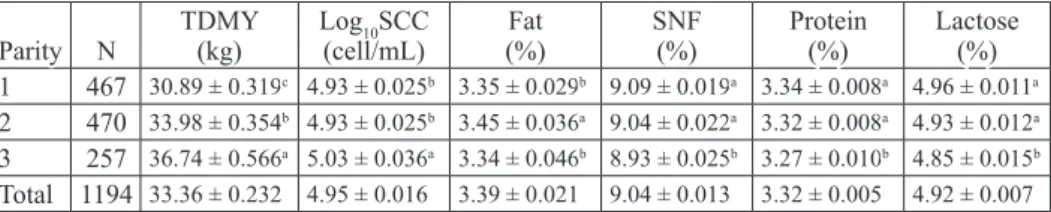
As seen from Table 1, the effect of parity on TDMY was significantly important (P<0.05). The highest TDMY was determined in the third parity, and the lowest in the first parity (P<0.05). In other words, TDMY tended to increase with advancing parity (Table 1). ERDEM et al. (2010) and CINAR et al. (2015) found similar results and concluded that the effect of parity on milk yield was significantly important. YOON et al. (2004) reported that milk yield was lower (P<0.01) in the first parity than other parities.
Increasing TDMY with later parity may be explained by the advancing ages of the cows (ERDEM et al., 2010).
Table 1. Effects of parity on test day milk yield, somatic cell count and milk composition Parity N TDMY(kg) Log(cell/mL)10SCC (%)Fat SNF(%) Protein(%) Lactose(%)
1 467 30.89 ± 0.319c 4.93 ± 0.025b 3.35 ± 0.029b 9.09 ± 0.019a 3.34 ± 0.008a 4.96 ± 0.011a
2 470 33.98 ± 0.354b 4.93 ± 0.025b 3.45 ± 0.036a 9.04 ± 0.022a 3.32 ± 0.008a 4.93 ± 0.012a
3 257 36.74 ± 0.566a 5.03 ± 0.036a 3.34 ± 0.046b 8.93 ± 0.025b 3.27 ± 0.010b 4.85 ± 0.015b
Total 1194 33.36 ± 0.232 4.95 ± 0.016 3.39 ± 0.021 9.04 ± 0.013 3.32 ± 0.005 4.92 ± 0.007
N - number of sample; TDMY - test day milk yield; log10SCC - logarithmic somatic cell count; SNF - solids-
not-fat; a-b - differences between different superscript in the same column is significant (P<0.05)
Log10SCC related to the parity of the cows in the present study (P<0.05). Significantly higher log10SCC (P<0.05) was observed in third parity compared with first and second parities. Log10SCC increased with advancing parity and this result agrees with previous reports (ERDEM et al., 2007; KUL and ERDEM, 2008; NASR and EL-TARABANY, 2017). Unlike the report of SEVI et al. (2000), parity had no significant effect on SCC. Despite some opposing research, most research results clearly indicate that the rise in SCC with the progressive aging of cows is attributable to a higher incidence of permanent glandular impairment from retreated infections (NASR and EL-TARABANY, 2017).
As can be understood from Table 1, fat content increased in the second parity, but declined in the third parity (P<0.05). The highest SNF, protein content and lactose were found in the first and second parity than the third parity (P<0.05). Similar conclusions were reached by CINAR et al. (2015), who documented that the effect of parity on protein content and lactose was significantly important (P<0.01). MARTIN et al. (2006) reported that milk fat content was relatively higher in the first lactation and decreased thereafter. This finding is disagreement with the findings of GURMESA and MELAKU (2012) who mentioned that the fat, protein, SNF and lactose contents of milk were similar in primiparous and multiparous cows. As seen from Table 1, the milk components in the third lactation decreased with increasing milk yield in general.
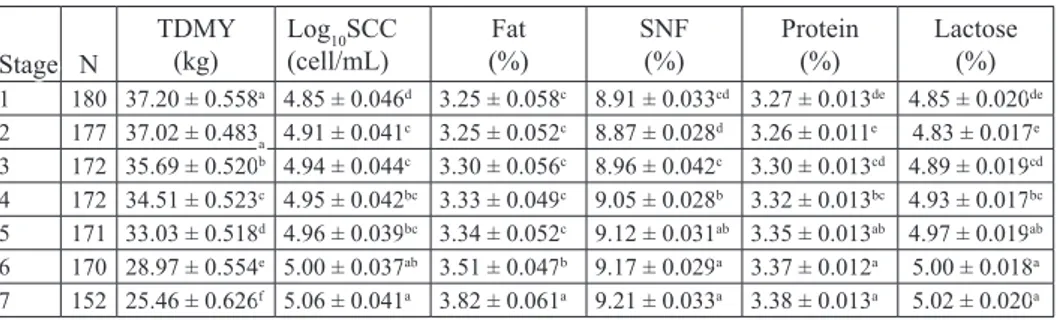
The effect of stage of lactation on TDMY is shown in Table 2. The highest TDMY was determined in the first two months of lactation and it decreased linearly with following lactations (P<0.05). Similar results were determined by ERDEM et al. (2010) and ATASEVER and STÁDNÍK (2015). However, GURMESA and MELAKU (2012) declared that the highest yield was recorded in mid stage and the lowest in late stage lactation. This could be due to the dilution effect of increased milk yield during early lactation and declines in milk yield during mid and late lactation. These variations could correspond to the level of negative energy balance during the inital period of lactation (DUCHÁCEK et al., 2014). This agrees with previous research reporting that a gradually
decline could be seen in mean TDMY related to lactation persistency (ERDEM et al., 2010).
Table 2. Effects of lactation stage on test day milk yield, somatic cell count and milk composition Stage N TDMY(kg) Log(cell/mL)10SCC (%)Fat SNF(%) Protein(%) Lactose(%)
1 180 37.20 ± 0.558a 4.85 ± 0.046d 3.25 ± 0.058c 8.91 ± 0.033cd 3.27 ± 0.013de 4.85 ± 0.020de 2 177 37.02 ± 0.483a 4.91 ± 0.041c 3.25 ± 0.052c 8.87 ± 0.028d 3.26 ± 0.011e 4.83 ± 0.017e 3 172 35.69 ± 0.520b 4.94 ± 0.044c 3.30 ± 0.056c 8.96 ± 0.042c 3.30 ± 0.013cd 4.89 ± 0.019cd 4 172 34.51 ± 0.523c 4.95 ± 0.042bc 3.33 ± 0.049c 9.05 ± 0.028b 3.32 ± 0.013bc 4.93 ± 0.017bc 5 171 33.03 ± 0.518d 4.96 ± 0.039bc 3.34 ± 0.052c 9.12 ± 0.031ab 3.35 ± 0.013ab 4.97 ± 0.019ab 6 170 28.97 ± 0.554e 5.00 ± 0.037ab 3.51 ± 0.047b 9.17 ± 0.029a 3.37 ± 0.012a 5.00 ± 0.018a 7 152 25.46 ± 0.626f 5.06 ± 0.041a 3.82 ± 0.061a 9.21 ± 0.033a 3.38 ± 0.013a 5.02 ± 0.020a
Stage 1 - 30 ± 15 days of lactation; Stage 2 - 60 ± 15 days of lactation; Stage 3 - 90 ± 15 days of lactation; Stage 4 - 120 ± 15 days of lactation; Stage 5 - 150 ± 15 days of lactation; Stage 6 - 210 ± 15 days of lactation; Stage
7 - 270 ± 15 days of lactation; N - number of sample; TDMY - test day milk yield; Log10SCC - logarithmic
somatic cell count; SNF - solids-not-fat; a-f -differences between different superscript in the same column is significant (P<0.05)
As seen in Table 2, log10SCC increased gradually until the end of lactation, while it was the lowest in the first month of lactation (P<0.05). YOON et al. (2004) reported that lower SCC was determined in the early and middle periods of lactation. The results obtained in the study were different to other study (ERDEM et al., 2010; ATASEVER and STÁDNÍK, 2015) which reported that the effect of lactation on SCC was not significant. IKONEN et al. (2004) demonstrated that SCC was high at the beginning of the lactation period, then decreased steadily and dropped to minimal level at the second month, but increased thereafter, thus reaching its maximum level at the end of lactation. The increase in milk SCC towards the end of lactation may be attributed to the higher prevalence of mastitis, normal involution of the udder and decreased milk production, which causes less dilution of the milk leucocytes (OSTENSSON, 1993).
The effects of stage of lactation on fat content, SNF, protein content and lactose were also statistically important (P<0.05). In the present study, fat in milk did not differ until five months of lactation, then it increased linearly to the end of lactation (Table 2). However, this finding disagrees with the report of BOHMANOVA et al. (2009), who reported that milk fat content was the lowest especially in the late lactation period. A reasonable explanation is the low fat percentage in the early days of lactation results in the highest DMY during this period.
The results of this study indicate that protein content, lactose and SNF were lower in the second month of lactation and increased gradually with the advancing stages of lactation, and this difference was statistically important (P<0.05). This finding disagreed with the results of GURMESA and MELAKU (2012) who reported that lactation stage
had no significant effect on milk composition. The decrease in fat and protein percentage in the peak period could be explained by the antagonist relationship between milk yield and the dry matter ratio of milk, as well as by the negative energy balance during the post-partum period (ATASEVER and STÁDNÍK, 2015). SOBCZUK-SZUL et al. (2015) stressed that the lowest protein and fat content and the highest yield were typical of milk from early stage of lactation. In this study, the milk yield increased in early lactation, however, milk components decreased. This case may be explained by the antagonistic relationships between milk yield and milk solids (FEDAKU et al., 2005).
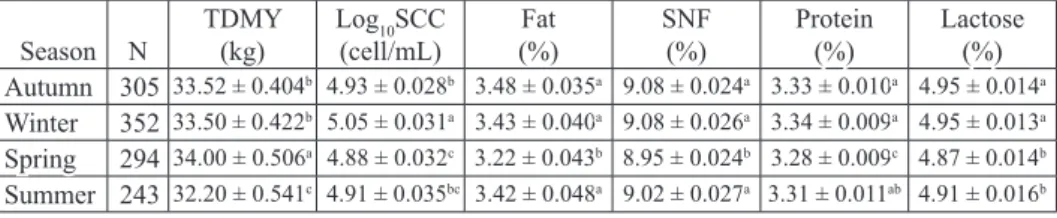
Table 3. Effects of calving season on test day milk yield, somatic cell count and milk composition Season N TDMY(kg) Log(cell/mL)10SCC (%)Fat SNF(%) Protein(%) Lactose(%) Autumn 305 33.52 ± 0.404b 4.93 ± 0.028b 3.48 ± 0.035a 9.08 ± 0.024a 3.33 ± 0.010a 4.95 ± 0.014a Winter 352 33.50 ± 0.422b 5.05 ± 0.031a 3.43 ± 0.040a 9.08 ± 0.026a 3.34 ± 0.009a 4.95 ± 0.013a Spring 294 34.00 ± 0.506a 4.88 ± 0.032c 3.22 ± 0.043b 8.95 ± 0.024b 3.28 ± 0.009c 4.87 ± 0.014b Summer 243 32.20 ± 0.541c 4.91 ± 0.035bc 3.42 ± 0.048a 9.02 ± 0.027a 3.31 ± 0.011ab 4.91 ± 0.016b
N - number of sample; TDMY - test day milk yield; log10SCC- logarithmic somatic cell count; SNF-
solids-not-fat; a-c -Differences between different superscript in the same column is significant (P<0.05)
As seen from Table 3, the significant effect of calving season on TDMY (P<0.05) was in agreement with the study results of RAJČEVIČ et al. (2003) and YOON et al. (2004). The lowest TDMY was found in cows calving in the summer, but the highest in cows calving in the spring. In parallel with these findings, CATILLO et al. (2002) reported that the lowest milk production level was determined from cows calved in the summer. EL-TAHAWY and EL-FAR (2010) reported that milk yield was highest in the autumn and winter. YOON et al. (2004) emphasized that a reduced rate of metabolism, decreased dry matter and nutrient intake, and altered water metabolism all occur in response to heat stress. Unfortunately, responses to heat stress often have negative effects on the physiology of the cow and on milk yield (KOÇ, 2011).
Log10SCC was significantly affected by calving season (P<0.05). The highest log10SCC (P<0.05) was observed in winter and the lowest in cows calving in the spring (Table 3). This was in agreement with many other studies (RAJČEVIČ et al., 2003; BERTOCCHI et al., 2014). The highest SCC during autumn and winter was previously determined by EL-TAHAWY and EL-FAR (2010). In our study, SCC was much higher during the colder seasons because the cows were indoors during the winter. Contrary to our findings, some authors reported higher SCC in milk in the summer season (ERDEM et al., 2007; NAJAFI et al., 2009).
As seen from Table 3, the calving season significantly (P<0.05) affected all milk composition parameters (P<0.05). Milk fat, protein and SNF in cows calving in spring were lower compared to other seasons. Moreover, lactose was lowest in cows calving in
the spring and summer compared to those that calved in the autumn and winter (Table 3). GENCUROVA and HANU (1997) reported that the highest fat content in milk
was determined in winter. The content of fat, protein and lactose could be influenced by the different food regimes in the summer and winter, besides the climate conditions (RAJČEVIČ et al., 2003). In the present study, the low milk components in the spring may be explained by the high milk yield in the spring season.
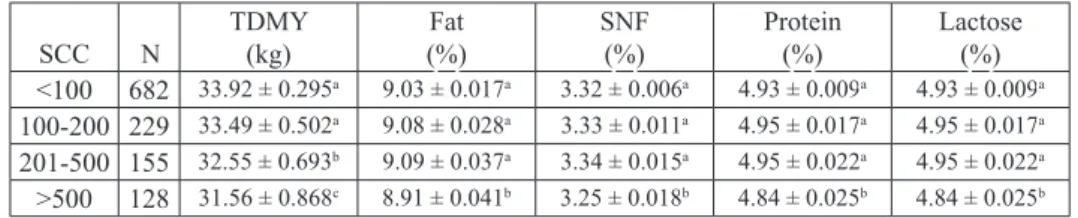
Changes to the milk components according to SCS thresholds are shown in Table 4. The effect of SCC on TDMY was significantly important (P<0.05). The results showed that SCC was negatively correlated with TDMY. Milk yield decreased in milk with SCC of 201-500×103 cells/mL, especially the highest milk yield losses were determined in
milk with SCC >500×103 cells/mL (Table 4). These results are largely consistent with
findings reported by other authors. MILLOGO et al. (2009) reported that high SCC led to lower milk yield. In the study by CINAR et al. (2015), milk yield decreased when the SCC increased. Unlike the current study, ERDEM et al. (2010) reported that the effect of SCC level on TDMY was not statically important.
Table 4. The effects of SCC in milk on milk yield and milk composition SCC N TDMY (kg) (%)Fat SNF(%) Protein(%) Lactose(%) <100 682 33.92 ± 0.295a 9.03 ± 0.017a 3.32 ± 0.006a 4.93 ± 0.009a 4.93 ± 0.009a
100-200 229 33.49 ± 0.502a 9.08 ± 0.028a 3.33 ± 0.011a 4.95 ± 0.017a 4.95 ± 0.017a
201-500 155 32.55 ± 0.693b 9.09 ± 0.037a 3.34 ± 0.015a 4.95 ± 0.022a 4.95 ± 0.022a
>500 128 31.56 ± 0.868c 8.91 ± 0.041b 3.25 ± 0.018b 4.84 ± 0.025b 4.84 ± 0.025b
SCC- somatic cell count (cells/mL×103); N - number of sample; TDMY- test day milk yield; SNF-
solids-not-fat; a-c - differences between different superscript in the same column is significant (P<0.05)
High SCC was associated with decreased fat content (P<0.05). Table 4 shows that fat content decreased to the lowest percentage with elevated SCC (SCC >500×103 cells/
mL). NAJAFI et al. (2009) demonstrated that the fat content of the milk decreased with increased SCC. The results in the present investigation were different than the results of MILLOGO et al. (2009), who determined that fat content was higher in samples with SCC <200×103 cells/mL than samples with SCC >200×103 cells/mL. Nevertheless,
some authors found no significant reduction in fat when correlated with increased SCC (MOSLEHISHAD et al., 2010; CINAR et al., 2015). Elevation of SCC significantly changed the fat content in the present study (P<0.05). This could be explained by the decrease in fat synthesis by the epithelial cells of the mammary glands (FERNANDES et al., 2004).
The lowest milk protein and SNF in the present study were determined in milk with SCC >500×103 cells/mL (Table 4). In other words, higher SCC caused a marked decline
in the content of protein of milk and SNF. The present results agree with those of CINAR et al. (2015), who found that SCC had a negatively and statically important effect on milk protein (P<0.01). Consistent with our findings, JAEGGI et al. (2003) reported that the milk protein was the lowest in milk with the highest SCC, disagreeing with the findings of ALBENZIO et al. (2005). According to GUO et al. (2010), decreases in protein content in cows responding to infection are mainly associated with the serum protein fraction. RAMOS et al. (2015) stressed that there was a higher proteolytic activity associated with high SCC. Therefore, casein synthesis during mastitis was usually reduced (RAMOS et al., 2015).
Lactose is the main determinant of milk volume and displays disorders in secretory tissues (GURMESA and MELAKU, 2012). Low lactose content shows metabolic and functional disorders in the udder tissues (RAJČEVIČ et al., 2003). Similarly, SOBCZUK-SZUL et al. (2015) determined that lactose content decreased with increasing SCC in milk. The lowest lactose in the present study was determined in milk with SCC >500×103
cells/mL (Table 4). RAMOS et al. (2015) reported that inflammation of mammary glands results in a reduction in lactose synthesis. This is because the glandular edema makes it difficult for glucose to reach the udder gland (GARCIA et al., 2015). As seen in Table 4, SNF decreased with elevated SCC, and the lowest SNF was determined in milk with SCC >500×103 cells/mL (P<0.05). MOSLEHISHAD et al. (2010) found similar
results regarding the relationships between high SCC and SNF. Higher SCC can cause higher enzymatic activity of proteinases, such as plasmin, lower synthetic ability of the mammary glands, and an increase in barrier permeability in mastitis milk, consequently lower quality milk (MOSLEHISHAD et al., 2010).
Conclusion
The results of this study indicate that parity, stage of lactation and calving season significantly (P<0.05) affected TDMY, log10SCC, fat, SNF, protein and lactose. The results obtained showed that elevated SCC negatively affected milk yield and milk composition parameters. Moreover, milk production markedly declined in cows with higher SCC (>500×103 cells/mL). In conclusion, the lowest milk yield and milk composition were
observed in milk when SCC was more than 500×103 cells/mL, and it is suggested that
monthly control of SCC may be effective for improving milk production and milk quality in Holstein cows.
_______
Acknowledgements
This work was supported by the Kırşehir Ahi Evran University Scientific Research Projects Coordination Unit with Project Number: PYO-ZRT.4001.14.003.
references
ACATINCĂI, S., A. MARCU, L. T. CZISZTER, M. ROMAN, I. TRIPON, S. ERINA (2008): Study regarding the corelation between somatic cells count and major chemical compounds in raw milk. Sci. Pap. Anim. Sci. Biotech. 41, 350-353.
ALBENZIO, M., M. CAROPRESE, A. SANTILLO, R. MARINO, A. MUSCIO, A. SEVI (2005): Proteolytic patterns and plasmin activity in ewe’s milk as affected by somatic cell count and stage of lactation. J. Dairy Res. 72, 86-92.
DOI: 10.1017/S0022029904000676
ATASEVER, S., L. STÁDNÍK (2015): Factors affecting daily milk yield, fat and protein percentage, and somatic cell count in primiparous Holstein cows. Indian J. Anim. Res. 49, 313-316. DOI: 10.5958/0976-0555.2015.00048.5
BERTOCCHI, L., A. VITALI, N. LACETERA, N. NARDONE, G. VARISCO, U. BERNABUCCI (2014): Seasonal variations in the composition of Holstein cow's milk and temperature-humidity index relationship. Animal 8, 667-674.
DOI: 10.1017/S1751731114000032
BOHMANOVA, J., J. JAMROZIK, F. MIGLIOR (2009): Effect of pregnancy on production traits of Canadian Holstein cows. J. Dairy Sci. 92, 2947-2959.
DOI: 10.3168/jds.2008-1782
CATILLO, G., N. MACCIOTTA, A. CARRETTA, A. CAPPIO-BORLINO (2002): Effects of age and calving season on lactation curves of milk production traits in Italian water buffaloes. J. Dairy Sci. 85, 1298-306.
DOI: 10.3168/jds.S0022-0302(02)74194-5
CINAR, M., U. SERBESTER, A. CEYHAN, M. GORGULU (2015): Effect of somatic cell count on milk yield and composition of first and second lactation dairy cows. Ital. J. Anim. Sci. 14, 105-108.
DOI: 10.4081/ijas.2015.3646
DUCHÁCEK, J., L. STÁDNÍK, M. PTÁCEK, J. BERAN, M. OKROUHLÁ, J. CÍTEK, R. STUPKA (2014): Effect of cow energy status on hypercholesterolemia fatty acids proportion in raw milk. Czech J. Food Sci. 32, 273-279.
DOI: 10.17221/360/2013-CJFS
EL-TAHAWY, A. S., A. H. EL-FAR (2010): Influences of somatic cell count on milk composition and dairy farm profitability. Int. J. Dairy Technol. 63, 463-469.
DOI: 10.1111/j.1471-0307.2010.00597.x
ERDEM, H., S. ATASEVER, E. KUL (2010): Determination of milk production characteristics and milk losses related to somatic cell count in Jersey cows raised in the black sea region of Turkey. Asian J. Anim. Vet. Adv. 5, 217-222.
ERDEM, H., S. ATASEVER, E. KUL (2007): Some environmental factors affecting somatic cell count of Holstein cows. J. Appl. Anim. Res. 32, 173-176.
DOI: 10.1080/09712119.2007.9706871
FEDAKU, B., K. SORYAL, S. ZENG, D. VAN HEKKEN, B. BAH, M. VILLAQUIRAN (2005): Changes in goat milk composition during lactation and their effects on yield and quality of hard and semi-hard cheeses. Small Rumin. Res. 59, 55-63.
DOI: 10.1016/j.smallrumres.2004.12.003
FERNANDES, A. M., C. A. F. OLIVEIRA, P. TAVOLARO (2004): Relationship between somatic cell counts and composition of milk from individual Holstein cows. Arq. Inst. Biol. Sao Paulo. 71, 163-166.
GARCIA, R. R., V. B. MAION, K. MOLIN DE ALMEIDA, E. H. WALTER DE SANTANA, M. R. COSTA, R. FAGNANI, A. LUDOVICO (2015): Relationship between somatic cell counts and milk production and composition in Jersey cows. Rev. Salud. Anim. 37, 137-142.
GENCUROVA, V., O. HANU (1997): The effect of season on the composition of individual samples of cow milk with a focus on nitrogen fractions. Vyzkum-v-Chovu-Scotu. 39, 11-15. GUO, J. Z., X. L. LIU, A. J. XU, Z. XIA (2010): Relationship of somatic cell count with milk yield
and composition in Chinese Holstein population. Agr. Sci. China. 9, 1492-1496. DOI: 10.1016/S1671-2927(09)60243-1
GURMESA, J., A. MELAKU (2012): Effect of lactation stage, pregnancy, parity and age on yield and major components of raw milk in bred cross Holstein Friesian cows. World J. Dairy Food Sci. 7, 146-149.
JAEGGI, J. J., S. GOVINDISAMY-LUCCY, Y. M. BERGER, M. E. JOHNSON, B. C. McKUSICK, D. L. THOMAS, W. L. WENDORFF (2003): Hard ewe’s milk cheese manufactured from milk of three different groups of somatic cell counts. J. Dairy Sci. 86, 3082-3089.
DOI: 10.3168/jds.S0022-0302(03)73908-3
IKONEN, T., S. MORRI, A. M. TYRISEVÄ, O. RUOTTINEN, M. OJALA (2004): Genetic and phenotypic correlations between milk coagulation properties, milk production traits, somatic cell count, casein content, and pH of milk. J. Dairy Sci. 87, 458-467.
DOI: 10.3168/jds.S0022-0302(04)73185-9
KOÇ, A. (2011): A study of the reproductive performance, milk yield, milk constituents, and somatic cell count of Holstein-Friesian and Montbeliarde cows. Turk. J. Vet. Anim. Sci. 35, 295-302.
KUL, E., H. ERDEM (2008): Relationships between somatic cell count and udder traits in Jersey cows. J. Appl. Anim. Res. 34, 101-104.
DOI: 10.1080/09712119.2008.9706949
MARTIN, R., R. MANSFELD, M, HOEDEMAKER, A. DEKRUIF (2006): Milk yield and feeding. In: Veterinary Livestock Care for Dairy Cattle. 2nd ed. (DeKruif, A., R. Mansfeld, M.
MILLOGO, V., G. A. OUÉDRAOGO, S. AGENÄS, K. SEVENNERSTEN-SJAUNJA (2009): Day-to-day variation in yield, composition and somatic cell count of salable milk in hand-milked Zebu dairy cattle. African J. Agric. Res. 4, 151-155.
MOSLEHISHAD, M., H. EZZATPANAH, M. AMINAFSHAR (2010): Chemical and electrophoretic properties of Holstein cow milk as affected by somatic cell count. Int. J. Dairy Technol. 63, 512-515.
DOI: 10.1111/j.1471-0307.2010.00616.x
NAJAFI, M. N., S. A. MORTAZAVI, A. KOOCHEKI, J. KHORAMI, B. REKIK (2009): Fat and protein contents, acidity and somatic cell counts in bulk milk of Holstein cows in the Khorasan Razavi Province, Iran. Int. J. Dairy Technol. 62, 19-26.
DOI: 10.1111/j.1471-0307.2008.00451.x
NASR, M. A. F., M. S. EL-TARABANY (2017): Impact of three THI levels on somatic cell count, milk yield and composition of multiparous Holstein cows in a subtropical region. J. Therm. Biol. 64, 73-77.
DOI: 10.1016/j.jtherbio.2017.01.004
OSTENSSON, K. (1993): Variation during lactation in total and differential leukocyte counts, N-acetyl-ß-D-glucosaminidase, antitrypsin and serum albumin in foremilk and residual milk from non-infected quarters in the bovine. Acta Vet. Scand. 34, 83-93.
PAVEL, E. R., C. GAVAN (2011): Seasonal and milking-to-milking variations in cow milk fat, protein and somatic cell counts. Not. Sci. Biol. 3, 20-23.
DOI: 10.15835/nsb325715
RAJČEVIČ, M., K. POTOČNIK, J. LEVSTEK (2003): Correlations between somatic cells count and milk composition with regard to the season. Agric. Conspec. Sci. 68, 221-226.
RAMOS, T. M., F. F. COSTA, I. S. B. PINTO, S. M. PINTO, L. R. ABREU (2015): Effect of somatic cell count on bovine milk protein fractions. J. Anal. Bioanal. Tech. 6, 1-7.
DOI: 10.4172/2155-9872.1000269
SERT, M., M. MERCAN, S. AYDEMIR, M. CIVELEK (2016): Effects of milk somatic cell counts on some physicochemical and functional characteristics of skim and whole milk powders. J. Dairy Sci. 99, 5254-5264.
DOI: 10.3168/jds.2016-10860
SEVI, A., L. TAIBIB, M. ALBENZIOA, A. MUSCIOA, G. ANNICCHIARICO (2000): Effect of parity on milk yield, composition, somatic cell count, renneting parameters and bacteria counts of Comisana ewes. Small Rumin. Res. 37, 99-107.
DOI: 10.1016/S0921-4488(99)00133-9
SOBCZUK-SZUL, M., Z. WIELGOSZ-GROTH, Z. NOGALSKI, M. MOCHOL, A. RZEMIENIEWSKI, P. POGORZELSKA-PRZYBYŁEK (2015): Changes in the fatty acid profile of cow’s milk with different somatic cell counts during lactation. Vet. Med. Zoot. 69, 52-57.
YOON, J. T., J. H. LEE, C. K. KIM, Y. C. CHUNG, C. H. KIM (2004): Effects of milk production, season, parity and lactation period on variations of milk urea nitrogen concentration and milk components of Holstein dairy cows. Asian-Aust. J. Anim. Sci. 17, 479-484.
DOI: 10.5713/ajas.2004.479
Received: 28 November 2017 Accepted: 18 December 2018 ________________________________________________________________________________________
KUl, E., A. ŞAHİn, S. ATASEvEr, E. UğUrlUTEpE, M. SoydAnEr: Učinak broja somatskih stanica na prinos i sastav mlijeka u krava holštajnske pasmine. vet. arhiv 89, 143-154, 2019.
SAžETAK
Ovim se istraživanjem želio ustanoviti utjecaj broja somatskih stanica (SCC) na dnevni prinos mlijeka (TDMY) i sastav mlijeka (masnoća, suha tvar, bjelančevine i laktoza) krava holštajnske pasmine u Kirşehiru u Turskoj. Ukupno 1194 uzoraka sirova mlijeka prikupljeno je od 195 krava holštajnske pasmine u različitim fazama laktacije (od 1 do 7), pariteta (od 1 do 3) i različitim razdobljima teljenja (jesen, zima, proljeće i ljeto). Također, ispitivan je broj somatskih stanica s obzirom na dnevni prinos i sastav mlijeka u četiri skupine (<100 103, 100-200×103, 201-500×103 i >500×103 stanica po mililitru). Za statističku obradu podaci o broju stanica prikazani su u bazi 10 logaritma (log10). Ukupna srednja vrijednost log10 za SSC iznosila je 4.95 ± 0.016, za TDMY 33.36 ± 0.232 kg/day, za masnoću 3.39 ± 0.021 %, za suhu tvar 9.04 ± 0.013 %, za bjelančevine 3.32 ±
0.005 % i za laktozu 4.92 ± 0.007 %. Na ukupnu srednju vrijednost log10SCC, dnevnog prinosa, masnoće, suhe
tvari, bjelančevina i laktoze statistički znakovito (P<0,05) su utjecali faza laktacije, paritet i sezona teljenja. Porast broja somatskih stanica praćen je smanjenim dnevnim prinosom mlijeka kao i promjenom njegova sastava (P<0,05). Krave s velikim brojem somatskih stanica (>201×103 stanica po mililitru) imale su manji
dnevni prinos mlijeka nego one s manjim brojem somatskih stanica (<100×103 i 100-200 stanica po mililitru).
Smanjen dnevni prinos i manja količina masnoće, suhe tvari, bjelančevina i laktoze utvrđeni su u mlijeku s
brojem somatskih stanica većim od 500×103 stanica po mililitru. Zaključeno je da broj somatskih stanica u
mlijeku ne bi trebao biti veći od 500× 103 stanica po mililitru te da bi mjesečna kontrola broja somatskih stanica u mlijeku krava holštajnske pasmine mogla povećati proizvodnju i poboljšati njegovu kakvoću.
Ključne riječi: krave holštajnske pasmine; broj somatskih stanica; proizvodnja mlijeka; mliječna masnoća; mliječne bjelančevine; laktoza