INFLUENCE OF USING ALTERNATIVE MEANS ON TYPE-I ERROR RATE IN THE
COMPARISON OF INDEPENDENT GROUPS
H. Mirtagioğlu, S. Yiğit*, A. Mollaoğulları**, S. Genç***and M. Mendeş****
Yüzüncüyıl University, Faculty of Agriculture, Department of Animal Science, Biometry and Genetics Unit,Van-Turkey
*Transitional Zone Agricultural Research Institute, Eskişehir,TURKEY.
**Çanakkale Onsekiz Mart University, Faculty of Art and Science, Department of Mathematics, Çanakkale-Turkey ***
Ahi Evran University, Faculty of Agriculture Department of Agricultural Biotechnology, Kırşehir -Turkey
****Çanakkale Onsekiz Mart University, Department of Animal Science, Biometry and Genetics Unit, Çanakkale -Turkey
Corresponding author’s email: [email protected]
ABSTRACT
In this study, the effect of using trimmed, winsorized, and modified means instead of arithmetic mean on type-I error rate was investigated when the assumptions of the one-way ANOVA were not satisfied. Therefore, random numbers were generated by simulation technique from the populations distributed by Normal (0,1), Beta (5,2) and χ2(3) for 3 and 4 groups. The results of 30 000 simulation trials demonstrated that all the means displayed similar type-I error rates when the variances were homogenous regardless of the distribution shape, sample size and the number of groups. When homogeneity of variances assumption was not satisfied, the most reliable result was obtained by using trimmed mean in terms of keeping the type-I error rate at nominal alpha level and it was followed by modified and winsorized means. The most biased results were obtained when arithmetic mean was used.
Key words: One-way ANOVA, Outlier, Non-normality, Homogeneity of variance, Type-I error.
INTRODUCTİON
Outliers in the data set studied may cause serious problems in statistical analysis process (Iglewicz & Hoaglin 1993; Zimmerman 1994; Zimmerman 1998). One of the problems is significant deviation from the assumptions of analysis of variance; namely, normality and homogeneity of variance (Jeyaratnam & Othman 1985; Sutton 1993; Wilcox 1994; 1996). As a result, the statistical differences existing among groups compared cannot be revealed. Analysis of variance (ANOVA) is widely used in practice to compare group means and the arithmetic mean is used for necessary calculations. However, outliers have a negative effect on arithmetic mean. There are different strategies to deal with outliers in measured data sets. One of these strategies is to use alternative means instead of arithmetic mean. These are trimmed mean and winsorized mean that are not affected much from outliers (Tukey & McLaughlin 1963; Yuen 1974; Huber 1981; Hall & Padmanabhan 1992; Rivest 1994; Wilcox 2001). Trimmed mean was introduced to overcome non-normality (especially studying with heavy tails) and heterogeneity of variances (Tukey & McLaughlin 1963; Yuen 1974; Wilcox 1994; 1995).
In this study, the effect of using trimmed mean, winsorized mean and a new approach instead of arithmetic mean on type-I error rate in one-way fixed effect ANOVA was investigated.
MATERIALS AND METHODS
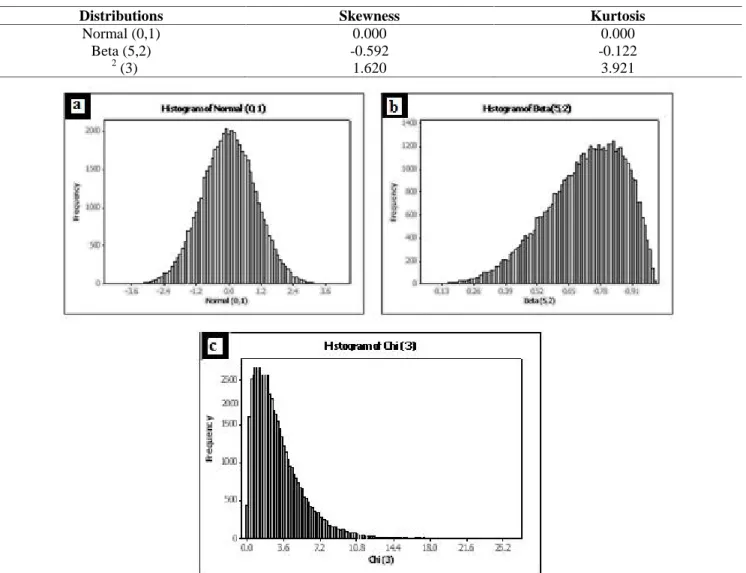
The material of this study is random numbers generated from Normal (0,1), Beta (5,2) and χ2(3) distributions by Monte Carlo simulation technique. RNNOA, RNBET and RNCHI functions of IMSL library of Microsoft FORTRAN Developer Studio were used to generate random numbers. Characteristics of these distributions were given in table 1 and figure 1 respectively. We considered k=3 and 4 group cases where each group contained 10, 20, 30 and 40 observations. Each experimental condition was repeated 30 000 times. It is well known that the trimmed mean is not appropriate for small sample size (n<10; Mendes and Yigit, 2012). We considered both homogeneity (1:1:1 and 1:1:1:1) and heterogeneity (1:1:4, 1:1:10, 1:1:1:4 and 1:1:1:10) of the variances on type-I error rates. In order to create outliers in data sets, constant numbers were added to some of the random numbers. First, type-I error rates for one-way analysis of variance were obtained under these experimental conditions. Type-I error rates regarding ANOVA were calculated by dividing the number of falsely rejected H0 hypotheses by the total number of trials (30 000). Then, trimmed, winsorized, and modified means were used instead of arithmetic mean in ANOVA and type-I error rates were estimated under these circumstances. In the simulation study, type-I error rate was determined as 0.05 and the percent of trim was 5.00%.Table 1. Characteristics of populations
Distributions Skewness Kurtosis
Normal (0,1) 0.000 0.000
Beta (5,2) -0.592 -0.122
χ2(3) 1.620 3.921
Figure 1. Distribution shapes: (a) Normal (0, 1) distribution, (b) Beta (5, 2) distribution, (c) Chi-Square distribution with 3 d.f.
Arithmetic mean: Arithmetic mean is calculated as
n X X n 1 i i (1)
Where n: sample size, Xi: observed value of ithsubject.
2.2. Trimmed mean
Trimmed mean is one of the robust estimators of the population mean especially when outliers exist in the data set. Therefore, this mean is preferred to arithmetic mean in order to reduce the effects of outliers. The trimmed mean is computed after the kth smallest and largest observations are removed from the sample. Let X={X1, X2, …, Xn} denote the observed values in the
sample concerning X-variable, (
(n) X ... (2) X (1) X )
be the order statistics, r is the amount of trimming and h = n – 2k be the effective sample size. Where k=[r n]
The sample trimmed mean is calculated as n k 1 k i X(i) 2k) (n 1 tr X (2)
Test statistics based on trimmed mean are computed depending on winsorized variance (Tukey & McLaughlin 1963; Staudte & Sheather 1990). The sample winsorized variance is
)
3
(
1
n
)
X
i
(X
S
2 wr 2 w
Let nj is the number of observation for group j
j
h is the effective size of group j 2
wj
S is the variance of group j and
tj
1) j (h j h 2 wj 1)S (n j d , (4) j d 1 j w , (5) wj U (6) wjXtj U 1 X~ (7) wj(Xtj X)2 1 j 1 A ~ (8) 1 j h 2 /U) j w (1 1 2 j 2) 2(j B and (9) 1 B A t F (10)
The null hypothesis of equal trimmed means is rejected, when ) 2 v , 1 (v F t F Where v1 (j1) ] 1 j h 2 /U) j w (1 1 2 j 3 [ 1 2 v (11)
(Luh & Guo 2005; Wu 2007).
2.3. Winsorized mean
Winsorized mean is a robust estimator of the population mean like trimmed mean when outliers exist in the sample. Winsorized mean is computed after the rth smallest observations are replaced by the (r+1)stsmallest observation, and the rthlargest observations are replaced by the (k+1)st largest observation. Winsorized mean is calculated as
n r 1 2 r i Xi (r 1)X(n r) 1) (r 1)X (r n 1 wr X (12)(Tukey & McLaughlin 1963; Rivest 1994; Wilcox 1994; 1996)
2.4. New approximation: modified mean
Let X={X1, X2, , Xn} denote the observed values
in the sample concerning any variable. Moreover, let (X1 ≤ X2 ≤…..≤ Xn) denote the arranged version of these
values. In this case, modified mean was obtained as follows:
The data set was divided by two groups as Set-1 and Set-2 including the data less than Xand greater than X, respectively. Where Xdenoted the arithmetic mean of this data set. Then, the arithmetic means of Set-1 and Set-2 were calculated as XS1 and XS2, respectively. The XS1 was replaced with the smallest value in Set-1
and XS2 with the largest value in Set-2. Afterwards, the mean of the new data set was considered and could be used as original arithmetic mean (Xnew; Mendes & Yigit, 2012).
RESULTS AND DISCUSSION
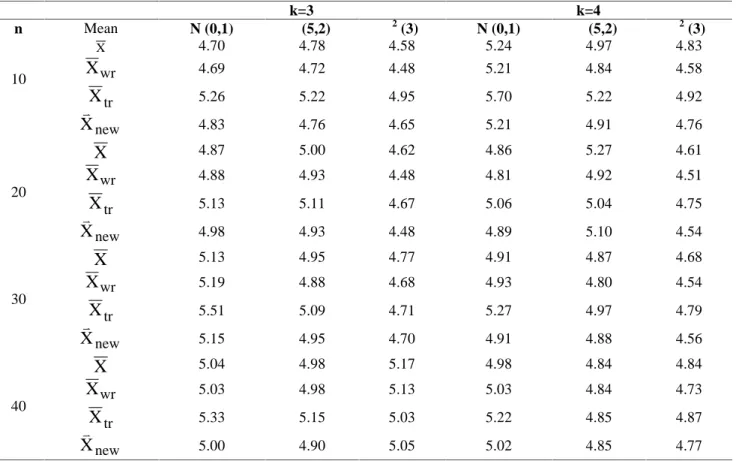
Results of the simulations are presented in Tables 2- 4, respectively. Table 2 illustrates represents the empirical type-I error rates of the ANOVA at α=0.05 significance level when homogeneity of variance assumption is fulfilled. Table 3 and Table 4 represent type-I error estimates when homogeneity of variance assumption is not met. Bradley (1987) criterion was used to evaluate robustness of these means or approaches. According to Bradley criterion, if empirical type-I error estimates of any test fall within the interval [0.5α ≤ α*≤1.5 α], in this case this test called as robust test. Therefore, for 0.05 alpha level, the empirical type-I error estimates of a robust test should be between 0.025 and 0.075.
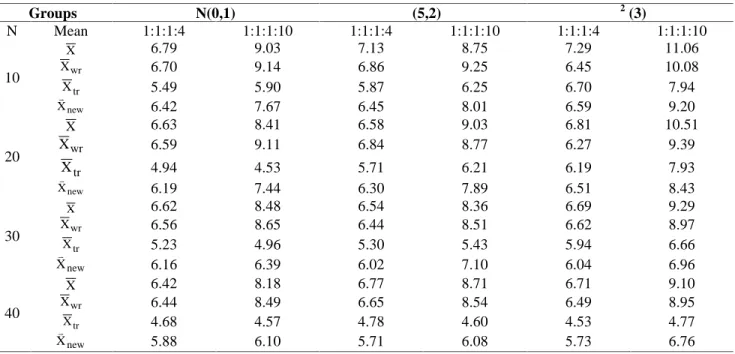
The type-I error estimates obtained by using arithmetic, winsorized, trimmed, and modified means are generally around 5.00%, when homogeneity of variances was satisfied, regardless of the distribution shapes, sample size and the number of groups (Table 2). The type-I error rate estimates for arithmetic, winsorized, trimmed and modified means varied between 4.58-5.27 %, 4.48-5.21%, 4.67-5.51% and 4.48-5.21%, respectively. As seen in table 2, all approaches gave similar results under these experimental conditions. Therefore, it is possible to conclude that all approaches are robust. All approaches, except trimmed mean, were affected negatively from deviations from homogeneity of variances. This negative effect was more obvious when variance ratio was 1:1:10 for k=3 and 1:1:1:10 for k=4 (Table 3 and 4). When there was a small deviation in the homogeneity of variances (1:1:4 and 1:1:1:4), the type I error estimates of all approaches fall within Bradley (1987) criterion. However, the most reliable results were obtained when trimmed mean was used. Trimmed mean was followed by the modified mean. When variance ratio increased to 10 (1:1:10 and 1:1:1:10), the type I error rates of all approaches deviated from 5.00% alpha level. However, theses deviations were more prominent for arithmetic mean and winsorized mean. Increasing the number of groups to be compared has generally caused higher type I error rates. It is more obvious for winsorized and arithmetic means especially when the variances are 1:1:10 and 1:1:1:10 under Chi-Square distribution with 3 d.f. On the other hand, trimmed and modified means were detected as not to be significantly affected from the number of groups. Under these
conditions, most reliable estimations were obtained again by using trimmed and modified means.
As can be seen in Table 3, the type I error estimations most approximated for trimmed mean were obtained by using modified mean. The case is more prominent especially when the variance ratios are 1:1:4 for k=3 and 1:1:1:4 for k=4 and the shape of the distribution is Normal or Beta (5,2). Therefore, under these conditions, the modified mean can be considered as a good alternative of trimmed mean. At the same time, by looking at the steps of calculating trimmed mean and modified mean, the modified mean can be considered to be much easier than trimmed mean. This case can be evaluated as modified mean has an important advantage with respect to trimmed mean. Although the most reliable results were obtaining by using trimmed mean, if biased results of trimmed mean especially when n<10 are taken into consideration, it can be interpreted that in Analysis of Variance calculations, using modified mean might be considered in case of possessing outliers in data set or the assumptions of the ANOVA test are not satisfied.
The present study reflected that the results were similar when the variances were homogenous and all the
conditions studied were evaluated together. However, the same results were invalid when the variances were not homogenous. When the variances were heterogeneous, trimmed mean could be considered regardless of distribution shapes and sample size. The results of this simulation study suggested that the most reliable results were obtained when trimmed mean was used. Trimmed mean was followed by the modified mean. Westfall & Yang (1993) and Wilcox (2003; 2005) reported that testing the hypothesis regarding trimmed mean provides more reliable results in the skewed distributions. The standard error of trimmed mean was determined to be smaller than arithmetic mean in the case of the skewed distributions. Likewise, Tukey & McLaughlin (1963), Wilcox (1995) and Luh & Guo (2005) reported that trimmed mean methods could be used efficiently for both non-normality (especially heavy tails) and heterogeneity of variance conditions. On the other hand, Wu (2004) reported that a problem occurred when sampling was made from a highly skewed distribution where outliers were more common in the right tail than in the left or vice versa.
Table 2. Type-I error rates (%) under homogeneity of variances.
k=3 k=4 n Mean N (0,1) β(5,2) χ2(3) N (0,1) β(5,2) χ2(3) 10 X 4.70 4.78 4.58 5.24 4.97 4.83 wr
X
4.69 4.72 4.48 5.21 4.84 4.58 trX
5.26 5.22 4.95 5.70 5.22 4.92 newX
4.83 4.76 4.65 5.21 4.91 4.76 20X
4.87 5.00 4.62 4.86 5.27 4.61 wrX
4.88 4.93 4.48 4.81 4.92 4.51 trX
5.13 5.11 4.67 5.06 5.04 4.75 newX
4.98 4.93 4.48 4.89 5.10 4.54 30X
5.13 4.95 4.77 4.91 4.87 4.68 wrX
5.19 4.88 4.68 4.93 4.80 4.54 trX
5.51 5.09 4.71 5.27 4.97 4.79 newX
5.15 4.95 4.70 4.91 4.88 4.56 40X
5.04 4.98 5.17 4.98 4.84 4.84 wrX
5.03 4.98 5.13 5.03 4.84 4.73 trX
5.33 5.15 5.03 5.22 4.85 4.87 newX
5.00 4.90 5.05 5.02 4.85 4.77X: arithmetic mean, Xwr:winsorized mean,Xtr:trimmed mean and new
Table 3. Type-I error rates (%) for k=3 when variances are not homogeneous Groups N(0,1) β(5,2) χ2(3) N Mean 1:1:4 1:1:10 1:1:4 1:1:10 1:1:4 1:1:10 10 X 6.55 8.06 6.86 8.30 6.98 10.09 wr X 6.42 8.07 6.40 7.85 6.41 8.73 tr X 5.17 5.49 5.87 6.13 6.25 7.68 new X 6.13 7.36 6.12 7.49 6.32 8.26 20 X 6.17 7.29 6.24 7.84 6.68 8.88 wr X 6.14 7.26 6.09 7.56 6.14 8.24 tr X 4.69 4.74 5.45 5.56 5.96 7.33 new X 5.98 7.02 5.97 7.12 6.21 7.55 30 X 5.99 7.40 6.55 7.54 6.46 8.36 wr X 6.04 7.44 6.38 7.34 6.20 7.93 tr X 5.10 4.82 5.35 5.51 5.91 6.57 new X 5.80 6.57 5.89 7.05 6.01 7.06 40 X 6.16 7.38 6.24 7.38 6.36 7.99 wr X 6.16 7.36 6.15 7.34 6.09 7.53 tr X 4.75 4.57 4.47 4.40 4.43 5.86 new X 5.77 6.12 5.67 6.39 5.89 6.97
X: arithmetic mean, Xwr:winsorized mean,Xtr:trimmed mean andXnew:modified mean
Table 4. Type-I error rates (%) for k=4 when variances are not homogeneous
Groups N(0,1) β(5,2) χ2(3) N Mean 1:1:1:4 1:1:1:10 1:1:1:4 1:1:1:10 1:1:1:4 1:1:1:10 10 X 6.79 9.03 7.13 8.75 7.29 11.06 wr X 6.70 9.14 6.86 9.25 6.45 10.08 tr X 5.49 5.90 5.87 6.25 6.70 7.94 new X 6.42 7.67 6.45 8.01 6.59 9.20 20 X 6.63 8.41 6.58 9.03 6.81 10.51 wr X 6.59 9.11 6.84 8.77 6.27 9.39 tr X 4.94 4.53 5.71 6.21 6.19 7.93 new X 6.19 7.44 6.30 7.89 6.51 8.43 30 X 6.62 8.48 6.54 8.36 6.69 9.29 wr X 6.56 8.65 6.44 8.51 6.62 8.97 tr X 5.23 4.96 5.30 5.43 5.94 6.66 new X 6.16 6.39 6.02 7.10 6.04 6.96 40 X 6.42 8.18 6.77 8.71 6.71 9.10 wr X 6.44 8.49 6.65 8.54 6.49 8.95 tr X 4.68 4.57 4.78 4.60 4.53 4.77 new X 5.88 6.10 5.71 6.08 5.73 6.76
X: arithmetic mean, Xwr:winsorized mean,Xtr:trimmed mean and new
X :modified mean
Conclusions: When the variances are homogeneous, any mean can be used. When the variances are not homogeneous, the use of trimmed mean and modified mean could be more reliable than the others. The usage of modified mean may be more appropriate especially when
there is an outlier problem with small sample size (n<10) or small deviation in homogeneity of variances under the distribution which has not very large skewness and kurtosis values.
REFERENCES
Bradley, J. V. (1987). Robustness? British J. Math. & Stat. Psych. 31: 144-152.
Hall, P. and A. R. Padmanabhan (1992). On the bootstrap and the trimming mean. J. Multivariate Analysis 41: 132-153.
Huber, P. J. (1981). Robust Statistics. Wiley, New York. 204 p.
Iglewicz, B. and D. C. Hoaglin (1993). How to Detect and Handle Outliers. Milwaukee, WI: ASQC Quality Press. 507 p.
Jeyaratnam, S and A. R. Othman (1985). Test of hypothesis in one-way random effects with unequal error variances. J. Statistical Computation and Simulation 21(1): 51-57. Luh, W. M. and J. H. Guo (2005). Heteroscedastic test
statistics for one-way analysis of variance: The trimmed means and Hall’s transformation conjuction. The J. Experimental Education 74(1): 75-100.
Mendes, M. and S. Yigit (2012). Comparison of ANOVA-F and ANOM tests with regard to type I error rate and test power. J. Statistical Computation and Simulation,1: 1-12.
Rivest, L. P. (1994). Statistical properties of winsorized mean for skewed distributions. Biometrika 81: 373-383.
Staudte, C. D. and S, Sheather (1990). Robust Estimation and Testing. John Wiley & Sons. Inc., USA. 568 p.
Sutton, C. D. (1993). Computer-intensive methods for test about the means of an asymmetrical distribution. J. American Stat. Asso. 88: 802-810.
Tukey, J. W. and D. H. Mc. Laughlin (1963). Less vulnerable confidence and significance procedures for location based on a single sample: trimming / winsorizing Sankhya A 25: 331-352.
Westfall, P. H. and S. S. Young (1993). Resampling-based multiple testing. New York, Wiley. 340 p. Wilcox, R. R. (1994). Some results on the Tukey–
McLaughlin and Yuen methods for trimmed means when distributions are skewes. Biometrical J. 36: 259-273.
Wilcox, R. R. (1995). ANOVA: The practical importance of heteroscedastic methods, using trimmed means versus means, and designing simulation studies. British J. Math. & Stat. Psych. 48: 99-114.
Wilcox, R. R. (1996). A note on testing hypotheses about trimmed means. Biometrical J. 38: 173-180. Wilcox, R. R. (2001). Fundamentals of Modern
Statistical Methods: Substantially Increasing Power and Accuracy. Springer, New York. 355 p.
Wilcox R R (2003). Applying Contemporary Statistical Techniques. San Diego, Academic Press. 608 p. Wilcox, R. R. (2005). Introduction to Robust Estimation
and Hypothesis Testing. 2nd Edition. San Diego, CA, Academic Press. 588 p.
Wu, P. C. (2004). Measure of location: comparing means, trimmed means, one step m-estimators and modified one step-m estimators under non-normality. Chinese J. Psychology 46 (1): 29-47. Wu, P. C. (2007). Modern one-way ANOVA F methods:
trimmed means, one step-m estimators and bootstrap methods. J. Quantitative Res., 155-172.
Yuen, K. K. (1974). The two sample Trimmed t for Unequal Population Variances. Biometrika 61: 165-170.
Zimmerman, D. W. (1994). A Note on the Influence of Outliers on Parametric and Nonparametric Tests. J. General Psycholog 121(4): 391-401.
Zimmerman, D. W. (1998). Invalidation of Parametric and Nonparametric Statistical Tests by Concurrent Violation of Two Assumptions. J. Exp. Edu. 67(1): 55-68.