Ankara University
Institute of Nuclear Sciences
Owner on behalf of Institute of Nuclear Sciences,
Ankara University,
Director
Niyazi MERİÇ, Ph.D.
http://jns.ankara.edu.tr
Editor-in-Chief
Haluk YÜCEL, Ph.D.
Assistant Editor-in-Chief
George S. POLYMERIS, Ph.D.
Editorial Board
A. HEIDARI, Ph.D.
Ayşe KAŞKAŞ, Ph.D.
Birol ENGİN, Ph.D.
Erkan İBİŞ, M.D.
Gaye Ö. ÇAKAL, Ph.D.
İskender Atilla REYHANCAN, Ph.D.
İsmail BOZTOSUN, Ph.D.
Mehmet TOMBAKOĞLU, Ph.D.
M.Salem BADAWI, Ph.D.
Mustafa KARADAĞ, Ph.D.
Niyazi MERİÇ, Ph.D.
Osman YILMAZ, Ph.D.
Özlem BİRGÜL, Ph.D.
Özlem KÜÇÜK, M.D.
Slobodan JOVANOVIC, Ph.D.
Turan OLĞAR, Ph.D.
Turgay KARALI, Ph.D.
Volume 3, No. 1 January 2016
p-ISSN: 2147-7736, e-ISSN:2148-3981
Journal of Nuclear Sciences
* Corresponding author.
E-mail address: [email protected], (P.D. Townsend )
Journal of Nuclear Sciences, Vol. 3, No. 1, Jan 2016, 15-24 Copyright ©, Ankara University, Institute of Nuclear Sciences ISSN: 2148-7736
Review Article
Hosted by Ankara University
Journal of Nuclear Sciences
p-ISSN: 2147-7736, e-ISSN:2148-3981
J o ur na l ho me pa g e : h t t p : / / j n s . a n ka r a . e d u . t r /
DOI: 10.1501/nuclear_0000000016
Unexploited Information from Luminescence Spectra
P.D. Townsend
** Physics Building, University of Sussex, Brighton BN1 9QH, UK
Received 26.12.2015; received in revised form 07.01.2016; accepted 11.01.2016 ABSTRACT
Luminescence is a highly sensitive technique to monitor the presence of impurities, imperfections and lattice distortions. To fully exploit it requires sensitive detection systems with high resolution spectral data and temperature control. This review notes both how detector technology has advanced, and mentions simple routes to generate more efficient use of existing photomultipliers. Modern detectors enable wavelength multiplexed spectrometer systems, which are prerequisites for both detailed thermoluminescence analyses and newer applications. These include recording the spectral changes from different crystalline phases, and capturing their characteristic intensity signatures at the phase transition temperature. Less expected is that the luminescence intensity is strongly influenced by the presence of impurities, even when they are not dispersed in the host lattice, but are grouped as nanoparticle inclusions. Spectacular host intensity changes can occur when the inclusions undergo phase transitions. Luminescence is also frequently used to monitor ion implanted materials, but for examples reported here, the spectra can be seriously distorted by absorption and reflectivity properties of the implant layer. Further, luminescence data have demonstrated that the underlying host material can be stressed and then relax into new structural phases. These aspects of spectral distortion and lattice relaxations may be far more common than has been noted in the previous literature. Finally, because the techniques are multi-disciplinary, brief mentions of systematic errors in signal analysis are noted.
Keywords: Luminescence spectra, Photomultiplier performance, Phase transitions, Nanoparticle inclusions 1. Introduction
The present article consists of two different sections. In the first section current progress in photomultiplier and photon detector technology are noted, together with very simplistic techniques that can be applied retrospectively to enhance the overall performance of existing equipment. In the second part the benefits of spectral data collection with wavelength multiplexed systems are demonstrated. Here the examples range from the essential requirement of such systems in detailed
thermoluminescence analysis, where the spectra are transient and changing with temperature, to far less common examples of the detection of phase transitions. Spectral information has been widely used to track the association of imperfections, impurities and associations of defects into pairs or larger clusters. But, an unexpected aspect of impurity detection is to record luminescence spectra that reveal the presence of nanoparticle impurity inclusions, via their temperature related phase transitions. This is effective since very small inclusions can strongly alter the luminescence
16
efficiency of the entire sample in which they are embedded. The examples are primarily drawn from data obtained on an extremely sensitive spectrometer system that was originally built in Sussex University [1], but which has now been relocated to St Andrews University and upgraded [2].
A final section addresses the consequences, in luminescence terms, of surface ion implantation. Whilst a technique as sensitive as luminescence is routinely used by the ion beam implantation community, with both insulator and semiconductor materials, there is considerable oversight in realising that the implants introduce absorption and reflectivity changes that distort the emission spectra. This is particularly relevant when the signals are
stimulated by any of the normal methods (photoluminescence, cathodoluminescence and radioluminescence) that excite non-uniformly through both the implant zone and into the underlying material. Examples will be emphasised with radioluminescence data, where the spectra from the bulk material are significantly altered by the implant layer. For the implanted target materials one invariably assumes that the underlying substrate is structurally unaltered (except for a small stressed boundary layer). However, luminescence data unequivocally demonstrate that in a number of systems the entire bulk substrate is restructured. This has far reaching consequences that have previously been ignored.
Fig.1 Addition of a torchlight reflector reduces losses from the reflections of the high refractive index
photocathode. In an initial test the gains were up towards 20%.
2. Simple enhancements of photomultiplier performance
Photon detection with photomultiplier tubes (PMT) has been available for around 80 years and in terms of reliability and sensitivity performance has gently been improved, initially by very empirical methods. Spectral coverage from say 200 to 900 nm is now standard. However, the performance across the range falls steeply at long wavelengths. In order to consider improvements it is helpful to consider the inherent stages [3]. The photo-emissive material is usually a mixture of alkali metals but there is considerable empirical “black magic” in the conditions for deposition, rather than a full understanding of the science. Signals are lost as light reflects both from the tube window (~a few percent) and the alkali layer (> 30% for shorter wavelengths). Of the light that enters the cathode the photon needs to be absorbed and an excited photo-electron must be generated with sufficient energy to diffuse to the vacuum region and be extracted. For short wavelengths this implies tolerable absorption and a
thin cathode. Whereas, for longer wavelengths absorption is very poor (<5%) and the electrons may lack the requisite escape energy. Some attempts at formation of a negative work function (possibly with an oxygen layer) have assisted the extraction. Overall, there are uncertainties and conflicting design challenges.
Manufacturers therefore now try to overcome these difficulties with better deposition reproducibility, inbuilt anti-reflection coatings or structured surfaces which minimise reflection, and/or increase absorption, plus topographies that enhance electron extraction [4-7]. Far less appreciated is that even with standard PMT systems it is often simple to greatly improve on the manufacturer’s original performance specification, merely by making simple changes in the way light is coupled into the PMT. Such gains do not increase the background noise level of the tube so immediately offer high signal to noise data collection.
Townsend/Journal of Nuclear Sciences Vol 3(1) 15-24
17
One incredibly low cost route is to add an external reflector to bring back light that was lost at the first interaction with the cathode surface. For less than 2 Euros, we [6, 8] used a reflector cone from a torch (flashlight) and, without any optimisation, this raised sensitivity from between 20 to 10% from the blue to the red regions. The simplicity of adding a reflector, plus the improvements it offered, is shown in Fig. 1. Further experimentation would undoubtedly improve on this. Importantly, the design is merely an on-line insert into normal equipment geometry. For standard radiation dosimetry a sensitivity enhancement of nearly 20% is possible. To place this gain in perspective, relative to the history of PMT improvements, this is equivalent to the benefits
accrued over around 5 to 10 years development by most manufacturers.
A second simple approach is to introduce the light into the photocathode, not at normal incidence, but at a steep angle of say 60 degrees. This is simple to do by adding a prism or semicircular dome (e.g. with glycerol as an index matching fluid). The main bonus here is that within the cathode layer the photon interaction is routinely increased by factors of ~2 at 400 nm to almost 10 times by 900 nm. The very high gains at long wavelengths merely emphasise how poor were the conventional responses. Fig.2 sketches one such arrangement and improvements on a standard S20 (trialkali) photocathode.
Fig.2 By using high angles of incident light there is enhanced absorption in the photocathode. In these trials,
with different S20 tubes, improvements of up to 5 times appeared at long wavelengths.
An even greater performance enhancement accrues by any coupling that causes the light to waveguide across the cathode surface within the window (or support layer) [4]. Here there are multiple interactions at steep angles and so, even for the longest wavelength red light, absorption approaches 100%. This is highly effective. It enhances and
extends the useful effective long wavelength range of the PMT (by up to 30 times near 900 nm, and to beyond 1,140 nm). Fig. 3a sketches two simple coupling strategies with standard tubes. Fig. 3b compares the original tube performance and values obtained with enhancement.
18
Fig.3(b) Examples of sensitivity enhancements produced by using waveguiding techniques, data are compared
with normal head on illumination of the same S20 PM tube
3. Spectrometer designs
The broad requirements are for wavelength multiplexing and a small f number throughout the entire apparatus. Many systems use a CCD array for the detector, and these have the bonus that they perform into the near infra-red region, so are realistically the only alternative for narrow band gap materials. However, for detection at shorter wavelengths there are major benefits from photocathode type detectors. Their strengths are that they have better UV performance, a very large dynamic intensity range, and extremely fast responses compared with CCD systems. For the multiplexed PMT systems the photocathode is packaged as a photon imaging tube (also called IPD). These are pixelated by using a fibreoptic channel plate as the cathode support. They retain the dynamic range of a simple PMT and also have the same wavelength response. Initially they were inferior to a simple PMT in terms of sensitivity and pulse resolution, but in the last decade there have been significant enhancements in both sensitivity and response time [9].
Some of the results presented here used modern IPD detectors with quantum efficiency values up to ~55% and with response times that enable lifetime measurements to be made down to the microsecond range. Note that different emission bands have different lifetimes, and in such an IPD design the spectral lifetimes can be determined in parallel. The Sussex/St Andrews system [1, 2] has an f value of 2.2, which overall offers high sensitivity, and it is compatible with both static spectral recording and data collected during temperature ramping, as needed in thermoluminescence, or observation of optical detection of phase transitions (e.g. to monitor both temperature of the phase change and hysteresis). A variety of ports allow flexibility of excitation with X-rays (RL), electrons (CL) or light (PL). The excitation methods can be combined and multiple excitations are opening new avenues to
monitoring excited state luminescence data. Fibre optics also allows the system to record to longer wavelength data on a CCD spectrometer.
The potential for such luminescence analyses linked to optical absorption and reflectivity data can be highly instructive, and an experimental system to do such multiple measurements whilst performing ion beam implantation, has been discussed elsewhere [10]. The additional benefits in that design allow one to track the formation of clusters of implanted species, formation of new compounds, and stress induced distortions of the substrate etc.
4. Unexploited information encoded in luminescence data
The literature of luminescence data from many disciplines is immense and consequently not all the possible techniques are fully exploited. Therefore the following list of examples will highlight aspects of both familiar and novel types of information that can be studied.
4.1 Heat treatments
Luminescence arises from band to band transitions and impurity ions or intrinsic defects. The signals reveal the ways that the imperfections associate or dissociate when exposed to thermal treatments, or different excitation dose rates. Familiar style examples emphasise that during annealing the complex interactions not only depend on the anneal temperature, but also on the speed of cooling back to room (or low) temperature. Normally, furnace anneals only return the sample to room temperature, but equally feasible is the use of in-situ pulsed laser annealing. Such laser pulse treatments have for example been used to maintain separated rare earth ions in laser hosts to give more intense laser action with longer lifetime excited states (i.e. localised annealing without long range diffusion) [11].
Townsend/Journal of Nuclear Sciences Vol 3(1) 15-24
19
In principle there are equally obvious applications for using pulse laser anneals [12] with samples within a cryostat. Such data would be highly informative, but this has rarely been considered or attempted. Nevertheless, and particularly if it is combined with excitation during the cooling, one could probe not only the final states of defect associations and cluster formation, but also the dynamics of the details of such processes. Even in a material as simple as silica, there are a number of stable and metastable localised zones of quartz crystalline phases and their presence might be apparent via the luminescence spectra.
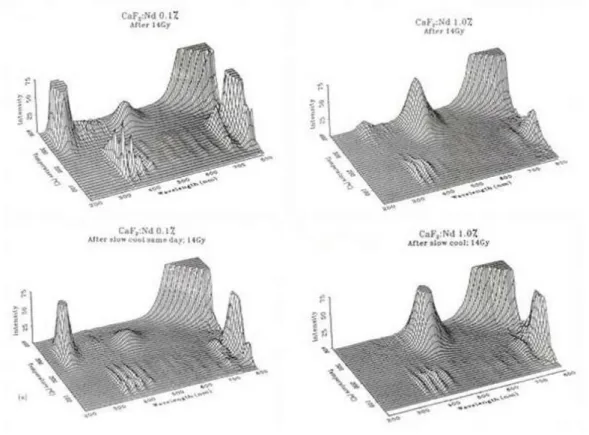
A less speculative example can be cited from the luminescence data of Nd doped CaF2 [13] in which,
depending on the Nd doping level, the spectra altered with cooling rate, because it controlled the movement and clustering of Nd complexes. Spectra of lightly, and heavily doped samples differ when annealed and cooled at the same rate. However, even
for the same sample the rate of cooling influences the clustering and thus the emission spectra. An example is presented in Fig. 4. Variants of such experiments, with more detail, offer considerable opportunities to gain new insights into the range of interactions and lattice distortions.
4.2 Interactions with neighbours
Clustering and long range interactions have been cited in many places (e.g. even with detailed spectra from nearest to 60th neighbouring shell separation of
electrons and holes that give excitonic-like spectra). Similarly, site selective spectroscopy of laser excited rare earth ions reveal how different local distortions give energy shifted spectra. Perhaps less familiar, is that by recording the spectra and peak temperatures of TL linked to rare earth impurity ions in LaF3 there
was observed a direct correlation of the TL temperature with the size and co-ordination number of the impurity [14, 15].
Fig.4 Examples of luminescence from Nd doped CaF2 with different Nd doping levels of 0.1 and 1%. Concentration
effects are seen, as are changes caused in clustering depending on the cooling rate after annealing. The lower data are for slow cooling.
Fig. 5 shows data for low temperature TL of Nd doped LaF3. Key points are that the intrinsic broad
band excitonic emission bands (in the UV) differ in temperature from those linked to RE impurity sites.
The figure also shows that the spectra change with temperature and the peak wavelengths are transition sensitive.
20
Fig.5 TL of LaF3 doped with Nd. The data resolve intrinsic and dopant signals as well as showing temperature
and spectral differences for each glow peak.
Variations in dopant concentration reveal peak movements in temperature resulting from impurity clustering. The temperature displacements depend on the dopant ion volume, implying that the peaks represent signals from several linked RE ions. For example in samples with both Ho and Pr the peak temperature moved depending on the Ho/Pr ratio. This implies a clustering of at least 3 substituted La sites. Data are shown in Fig. 6a. Parallel examples have been noted with several other rare earth doped compounds, and/or proposals that the clustering evolved into different precipitate compounds. The scale of the effects differ considerably, as the shift in TL peak temperature with RE ion size is less than 20 degrees for LaF3 [14, 15] or CaSO4 [16], but it rises
to 60 degrees for bismuth germinate [17] and to a 200 degree range for zircon [18] (as shown in Fig. 6b). Without the spectral data, the systematic shifts would be unnoticed. In the case of zircon this may imply the impurities have precipitated into a phase inclusion.
The rare earth emission lines originate from transitions from a variety of excited states, therefore the extent of their interactions with the local lattice, will differ. This means the TL peak temperature (and also radioluminescence temperature dependence) will differ for each higher level starting state. This feature is apparent for some rare earth transitions and an example is shown in Fig. 7 for TL data of
Mg2SiO4:Eu. Fig.6.(a) RE doped LaF3 changes in TL peak
temperature depending on dopant size and co-ordination number. b) The pattern for zircon samples spreads over a greater temperature range.
Townsend/Journal of Nuclear Sciences Vol 3(1) 15-24
21 Fig.7 Transition sensitive TL data of Mg2SiO4:Eu.
The TL curves have been normalized.
4.3 Phase transitions
In insulators there have been numerous luminescence examples of crystalline phase changes induced by temperature or pressure. This is a very direct approach as every phase has a different characteristic spectrum, and dopants, such as RE ions alter their coupling in the local crystal field, and so have wavelength displacements of their emission and absorption line transitions. In a temperature ramped mode of excitation with a full spectral coverage it is simple to note that such phase changes occur at different temperatures during heating and cooling (i.e. to reveal hysteresis). Less obvious is that at the phase transition event the normal selection rules, that govern the luminescence intensity, are broken. So the very high concentrations of excited electrons and holes frequently generate a major intensity spike, which acts as a beacon to indicate the presence of a phase change. A KNbO3 example is
shown in Fig. 8 that also reveals the hysteresis of the phase transitions.
The Sussex spectral system has contributed to detection of phase transitions for many materials, as summarised and referenced in our reviews [19-21], not just for insulators, but also for fullerenes and high temperature superconductors. In some cases the signals originate via contaminants rather than the target system. These have been beneficial and, for example, with superconductors have indicated components with higher transition temperatures than the bulk.
4.4 Detection of nanoparticle impurities
When the host contains nanoparticle impurities, the host luminescence intensity and spectra, can be strongly influenced by phase changes within the inclusions. Effectively the stress from the structural phase change causes relaxation or compression, which in turn influences the entire bulk of the host crystal. The intensity of the luminescence from the host material can alter by orders of magnitude.
Further, there are many common trace impurities that are difficult to resolve in compositional analyses.
Fig.8 Phase transitions and hysteresis detected by
luminescence in KNbO3.
For example if there are parts per million of say water, or CO2, O2, N2, Ar etc, that became
incorporated during the crystalline or glass production, then they frequently precipitate out as nanoparticles. Low temperature TL, RL and CL are then effective at detection of such impurities when they are in the form of nanoparticle inclusions, because there are intensity steps of the host luminescence driven by their phase changes. For CO2 there is a well documented sublimation
temperature, ice has a cubic to hexagonal structural change, and the gases all go through the usual shifts from solid to liquid to gas. Numerous such examples have been detected and reviewed [19-21]. Note however the phase transitions of nanoparticles may occur at temperatures which vary with particle size. The scale of the effects on the bulk luminescence signals can be remarkable and Fig. 9 gives two examples from measurements with Sm doped ZrSiO4 and Nd doped YAG. In the zircon example
the low temperature signals are suppressed when water ice makes a transition from the higher temperature hexagonal phase to the lower temperature cubic ice phase. This ice phase feature has been widely detected in the spectra of other materials. The Nd:YAG spectra are equally responsive to surface water transitions and nanoparticle inclusions. In the data shown here the surface water caused an intensity spike from a surface ice phase change near 225 K (seen here as a dark line on the contour map). More dramatic is the pressure change caused by sublimation of CO2
inclusions and this pressure increase near 195 K has changed the intensity map (as for the zircon) and produce a lattice distortion that was seen in the lattice parameter, and here as a sideways jump in the position of the emission near 400 nm.
22
Surface ice CO2
Fig.9 Examples of spectral changes induced by
phase transitions of nanoparticle impurities. The upper hand figure shows a change driven by the hexagonal to cubic phase transition of ice. The lower data for Nd:YAG indicates a surface ice intensity effect, plus intensity and lattice parameter changes
from CO2 nanoparticle sublimation.
4.5 Ion implanted surfaces and bulk changes
The preceding examples of stress generated by nanoparticle inclusions emphasised that these are long range effects across the entire sample. It is therefore not unrealistic that the stress generated by surface ion implantation will be equally pervasive, and this will be apparent by modifications of the emission spectra from the supporting crystal or glass. (A potential experiment to reveal this would be to look for line shifts of rare earth ions from the unimplanted side of a sample.) In unstable lattice structures, those with several alternative phases, or piezo-optic materials, are likely candidates for the implant stress to trigger both relaxations and phase changes. Such possibilities are normally ignored by those focusing on implantation. Nevertheless, there are detailed luminescence data for SrTiO3 [19,
22-24], a crystal structure which displays several metastable bulk crystalline phases as a consequence of surface implantation. More recently, relaxation of the wurtzite structure of ZnO has been detected [25] as a result of stress from the implant. Luminescence changes are apparent as the energy of band to band transitions is altered. Further, ZnO structural changes are also clearly seen in data for TL, because the pattern of glow peaks is displaced in temperature in the implanted samples.
Undoubtedly this is a more general consequence of implant stress extending over long ranges, but it is not normally considered, nor is evidence sought to detect it. This omission offers the possibility of a wider exploration of such features for future publications.
4.6 Ion implanted layers and luminescence spectra
Many implantation studies use luminescence to monitor changes in the target material but inevitably the excitation techniques (PL, CL, RL and semiconductor light production) extend over a larger volume than the implant. This means, firstly, that the desired signals are seriously contaminated by components from other regions. Secondly, normal practice is to view the light from the implant face and so the spectra are seriously distorted by absorption in the surface layer (or by layer reflectivity dependence if viewed from the reverse face). A recent example using RL with implanted ZnO [25] emphasizes that the spectral data from both RL and TL viewed from the implant or reverse face are significantly different. For the ZnO case a true analysis of the spectra from the implant zone is not feasible. Yet again this is undoubtedly a far more general situation, and it indicates that much of the published luminescence data from surface implants may be flawed. Agreement between alternative research groups may merely imply a consistent error.
4.7 Systematic problems of analysis
The extreme sensitivity of luminescence techniques, and their apparent simplicity, has made them accessible across a wide range of disciplines from archaeology, geology, biology, chemistry etc to many branches of physics. Inevitably the users are expert in their own fields, rather than in luminescence. Therefore, a brief reminder of some common errors in data collection and processing seem appropriate. The first is that diffraction gratings in a spectrometer have responses that are strongly polarization sensitive. So for a signal that includes a polarized component, not only will it appear to alter if the sample is re-oriented, but the requisite correction factors to scale the recorded signal to compensate for the response of the overall system, will be in error. Indeed, it may be impossible to assess how to make a proper correction to allow for polarization sensitivity if there is a mixture of unpolarized and polarized signals.
Secondly, for routine applications, such as TL dosimetry, the primary aim is to record the total light intensity and hence deduce a radiation exposure. To minimise background noise most commercial systems use a high heating rate. For dosimetry this is
Townsend/Journal of Nuclear Sciences Vol 3(1) 15-24
23
fine. However for more detailed signal analysis the data are flawed as there are extremely large temperature gradients across the insulating samples [26]. This difficulty has been indicated by many authors, but not all the users of dosimetry have appreciated this, so when comparing TL with other techniques it is essential to be aware of this common error.
A similar persistent error in signal processing is that diffraction grating spectrometers offer a wavelength dispersed spectrum. Invariably the recorded intensity at each wavelength (λ) is corrected for the overall system response. Data are then conventionally displayed in the form of I(λ)dλ versus λ (where dλ is the band width of the spectrometer entrance slit). However, for de-convolution into component features the underlying science needs the data in the form of an energy plot, I(E)dE versus E. Very many articles have failed to do this, and often only the λ to E adjustment has been made. The failure distorts the spectrum and de-convolution produces incorrect values and additional false features. When reading the literature this potential error should be recalled [27] as historically it was a common mistake, and unfortunately is still perpetuated, and not always recognised by reviewers.
5. Summary
Luminescence is a sensitive and powerful analytical tool with a very long history. This very brief overview indicates that it has far more potential for current and novel applications than has been appreciated. There is a minor caveat that, with such a long established method, one must be alert to systematic errors in signal analysis that are entrenched in the literature.
Conflicts of Interest
The authors have no conflict of interest.
References
[1] Luff, B. J. ,Townsend, P.D. “High sensitivity thermoluminescence spectrometer,” Meas. Sci. Technol. 3, 65-71 (1992).
[2] Finch, A., Wang, Y., Townsend, P. D., Ingle,
M. “High Sensitivity Luminescence
Measurements of Materials – The St Andrews Luminescence Facility”, in press.
[3] Townsend, P. D., “Photocathodes – Past performance and future potential”, Contemp. Phys. 44, 17-34 (2003).
[4] Townsend, P.D., Downey, R., Harmer, S.W., Wang, Y., Cormack, A., McAlpine, R, Bauer,
T. “Designs for waveguide and structured photocathodes with high quantum efficiency”, J. Phys. D: Appl. Phys. 39, 1525-1536 (2006). [5] Harmer, S. W., Townsend, P. D., Bowring, J.,
“Enhancement of photomultiplier sensitivity with anti-reflective layers”, J. Phys. D: Appl. Phys. 45, 055102 (2012).
[6] Harmer, S.W., Townsend, P.D., “Improving the performance of photomultiplier tubes”, J. Phys. D: Appl. Phys. 43, 415101 (2010). [7] Townsend, P.D., Valberg, L., Momchilov, N.,
Harmer, W. S., Downey, R., Cormack, A. J., “Optimization of photomultiplier spectral sensitivity with a graded thickness photocathode”, J. Phys D: Appl. Phys. 41, 185504 (2008).
[8] Harmer, S. W., Townsend, P. D., “Low cost enhancements of photomultiplier sensitivity”, Proc. SPIE, 7747, 77470A-5 (2011).
[9] Townsend, P. D., Hallensleben, S.,Phillips, M., Downey, R. J., Brooks, R. J., Howorth, J., Milnes, J., “Improvements in sensitivity and response times of photon imaging tubes”, J. Phys. D : Appl. Phys. 39, 4331-4336 (2006). [10] Townsend, P. D., Crespillo, M. L., “An ideal
system for analysis and interpretation of ion beam induced luminescence”, Physics Procedia, 66, 345-351 (2015).
[11] Can, N., Townsend, P. D., Hole, D. E., Snelling, H. V., Ballesteros, J. M., Afonso, C. N., “Enhancement of luminescence by pulse laser annealing of ion implanted europium in Sapphire and Silica”, J. Appl. Phys. 78, 6737-6744 (1995).
[12] Townsend, P. D., Olivares, J., “Laser processing of insulator surfaces”, Appl. Surf. Sci. 109/110, 275-282 (1997).
[13] Holgate, S. A., Sloane, T. H., Townsend, P. D.,
White, D. R., Chadwick, A. Y.,
“Thermoluminescence of calcium fluoride doped with neodymium”, J. Phys. Condens. Matter 6, 9255-9266 (1994).
[14] Yang, B., Townsend, P. D., Rowlands, A. P., “Low temperature thermoluminescence of rare earth doped lanthanum fluoride”, Phys. Rev. B 57, 178-188 (1998).
[15] Yang, B., Townsend, P. D., “Patterns of peak movement in rare earth doped lanthanum fluoride”, J. Appl. Phys. 88, 2103-2122 (2000).
24
[16] Maghrabi, M., Karali, T., Townsend, P. D., Lakshmanan, A. R., “Luminescence spectra of CaSO4 with Ce, Dy, Mn and Ag co-dopants”, J
Phys D: Appl. Phys. 33, 477-484 (2000). [17] Raymond, S. G., Townsend, P. D., “The
influence of rare earth ions on the low
temperature thermoluminescence of
Bi4Ge3O12”, J. Phys: Condens. Matter 12,
2103-2122 (2000).
[18] Karali, T., Can, N., Townsend, P. D.,
Rowlands, A. P., Hanchar, J.,
“Radioluminescence and thermoluminescence of rare earth element and phosphorus-doped zircon”, Am. Mineral. 85, 668-681 (2000). [19] Townsend, P. D., Maghrabi, M., Yang, B’,
“Luminescence detection of phase transitions”, Nucl. Instrum. Meth. B 191, 767-771 (2002). [20] Townsend, P. D., Yang, B., Wang, Y.,
“Luminescence detection of phase transitions,
local environment and nanoparticle
inclusions”, Contemp. Phys. 49:4, 255-280 (2008).
[21] Wang, Y., Townsend, P. D., “Structural changes and relaxations monitored by luminescence”, Luminescence 28, 253-258 (2013).
[22] Yang, B., Townsend, P. D., Fromknecht, R., “Radioluminescence detection of bulk effects
in SrTiO3 induced by surface
ion-implantation”, Nucl. Instrum. Meth. B 217, 60-64 (2004).
[23] Yang, B., Townsend, P. D., Fromknecht, R., “Low temperature detection of phase transitions and relaxation processes in SrTiO3
by means of cathodoluminescence”, J. Phys: Condens. Matter 16, 8377-8386 (2004). [24] Yang, B., Townsend, P. D., Fromknecht, R.,
“Effects of the ion-implantation on the thermoluminescence spectra of strontium titanate’’, Nucl. Instrum. Meth. B 226, 549 (2004).
[25] Wang, Y., Ma, B., Zhang, W., Li, D., Zhao, Y., Finch, A. A., Townsend, P. D., “Substrate lattice relaxations, spectral distortions and nanoparticle inclusions of ion implanted zinc oxide”, J. Appl. Phys. 118, 095703 (2015). [26] Ege, A., Wang, Y., Townsend, P. D.,
“Systematic errors in thermoluminescence”, Nucl. Instrum. Meth. A 576, 411-416 (2007). [27] Wang, Y., Townsend, P. D., “Potential
problems in collection and data processing of luminescence signals”, J. Lumin. 142, 202-211 (2013).