FINANCIAL STRESS INDEX FOR TURKEY
TÜRKİYE FİNANSAL STRES ENDEKSİAykut EKİNCİ
Türkiye Kalkınma BankasıABSTRACT: This study presents a financial stress index for Turkey on a daily
basis. The index covers the time period between 01.08.2002 and 31.01.2013, and it presents the summation of stress levels collected through the Banking Sector, Public Sector, Stock Market and Foreign Exchange Market. So as to enable the financial institutions and policy makers to determine the financial stress on the sub-markets and financial sector, and manage the monetary policy, an indicator with high frequency was aimed to be provided. By use of the financial stress analysis, the Turkish Economy has been broken down into six different periods, namely (i) the high stress period (ii) the normal stress period (iii) the global crisis stress period (iv) the low stress period (v) the increasing stress period (vi) the decreasing stress period and the analyses related to each of these periods are presented.
Keywords: Financial Crises; Financial Stress Index; Monetary Policy; Fiscal
Policy; Banking Sector
JEL Classification: F30; G10; E17
ÖZET: Çalışmada Türkiye için günlük bazda bir finansal stres endeksi oluşturulmuştur. Endeks, 01.08.2002-31.01.2013 dönemini kapmakta ve Bankacılık Sektörü, Kamu Sektörü, Hisse Senedi Piyasası ve Döviz Piyasası için elde edilen stres seviyelerinin toplamından oluşmaktadır. Çalışmada sunulan finansal stres endeksi aracılığıyla, finansal kurumlar ile politika uygulayıcılara alt piyasalar ve toplam sektör üzerindeki finansal stresin algılanması ve para politikasının yönetilmesi konusunda günlük sıklığa sahip bir endeks sunulması amaçlanmıştır. Finansal Stres Endeksi aracılığıyla, Türkiye ekonomisi (i) yüksek stres dönemi (ii) normal stres dönemi (iii) küresel kriz dönemi (iv) düşük stres dönemi (v) yükselen stres dönemi (vi) azalan stres dönemi olmak üzere altı ayrı finansal stres dönemine ayrılmış ve ilgili dönemlerin analizlerine yer verilmiştir.
Anahtar Kelimeler: Finansal Krizler; Finansal Stres Endeksi; Para Politikası; Maliye Politikası; Bankacılık Sektörü
1. Introduction
Studies that aim at collecting information about the general outlook of the financial sector through indicators go back to the early 1980s. This early literature consists mostly of studies that focus on single market or only one indicator. By the increase in the degree of the interrelations and transitions among markets in 1990s, the focus area of these studies remained narrow, compared to the size of the whole picture. This problem necessitated a new holistic understanding which can measure the total stress on the entire financial system, and starting from the late 1990s, the studies representing this understanding have proliferated, most of which are conducted by the central banks of developed countries and the academic cadres of international financial organizations. These indexes, which are named “financial stress”,
“pressure or condition”, are formed through integration of other sub-market indexes. An episode of financial stress is defined as a period when the financial system is under strain and its ability to intermediate is impaired or financial stress can be thought of as an interruption to the normal functioning of financial markets (see Balakrishnan et al., 2009; Hakkio and Keeton, 2009).
The financial crisis that has emerged in the U.S. by the late 2000s and quickly spread to the other countries gave way to attempts to understand the structure and the general condition of the financial sector. Measurement of financial stress is a culmination of these attempts, and it has grasped significant attention after the global financial crisis.
In the related literature, financial stress indexes (FSIs) are mostly calculated on a monthly basis for the developed countries and the USA in particular. FSIs are a relatively new topic for developing countries and Turkey. When the fact that the developing countries tend to participate further in the world economy is taken into account, the growing need for the calculation of financial stress index on a daily basis becomes more obvious. This article presents the Financial Stress Index for Turkey (FSI_T) for Turkey, which is also a developing country. FSI_T is designed to measure the stress in Turkish financial sector through four sub-indexes and is calculated on a daily basis.
In the next section of the study, the literature is discussed. The third section is devoted to a discussion over the formation of the financial index for Turkey and the sub-indexes are introduced. In the fourth section, financial stress periods are examined through FSI_T. The last section provides the analyses of the results.
2. Literature
Various indicators have been developed since the 1980s to measure the financial stress. The slope of the yield curve is one of these indicators. The slope of the yield curve provides significant information as to the subsequent real economic growth, based on the difference between long-term and short-term interest rates as it was addressed by the research in the late 1980s and early 1990s (Harvey, 1989; Stock and Watson, 1989; Chen, 1991; Estrella and Hardouvelis, 1991; Plosser and Rouwenhorst, 1994; Davis and Fagan, 1997; Estrella and Mishkin, 1998). Credit risk is another leading indicator of output since the 1980s, which is measured by the commercial paper-Treasury bill spread (Friedman and Kuttner 1992; Stock and Watson, 1989). Some other studies also state that stock markets are good leading-indicators (Zarnowitz, 1992; Estrella and Mishkin, 1996).
In the mid-1990s, The Bank of Canada (BOC) introduced its monetary condition index (MCI) as the first example of work on broader financial condition measures, which is the weighted average of changes in interest rates and an exchange rate relative to their values during a base period (Freedman, 1994). MCIs can be used as indicators of monetary conditions as well as operational short-run targets for monetary policy. Soon after the introduction of MCI, it has gained international popularity and similar indexes were started to be used for conducting monetary policies by other central banks including the central banks of Canada, New Zealand, Norway, and Sweden.
MCIs and similar other indexes, which have been pioneered by BOC, have been improved by the inclusion of other indicators such as long-term interest rates, stock prices and real estate values. Improved MCIs have gained the capacity to represent a broader field then mere conditions of monetary policies and these new MCIs started to be called Financial Condition Index (FCI) or Financial Stress Index (FSI).
Hatzius et al. (2010:7-8) discusses seven different other well designed FCIs: the Bloomberg FCI, the Citi FCI, the Deutsche Bank (DB) FCI, the Goldman Sachs (GS) FCI, the Kansas City Federal Reserve Financial Stress Index (KCFSI), the Macroeconomic Advisers Monetary and Financial Conditions Index, and the OECD FCI.
The Bloomberg FCI is a convenient measure to watch financial conditions since it is accessible to many financial markets and updated on a daily basis. The index is an equally weighted sum of three major sub-indexes: money market indicators, bond market indicators, and equity market indicators (Rosenberg, 2009). Each of these sub-indexes is also formed by the combination of other underlying indicators which are all represented with an equal weight. Ten variables come together to form an index representing a history available from 1991.
Unlike the Bloomberg FCI, Citi FCI, includes only six financial variables, including corporate spreads, money supply, equity values, mortgage rates, the trade-weighted dollar, and energy prices (D‘Antonio, 2008). The index is available from 1983. The nominal values in Citi FCI are deflated and the indicators include various transformations and lags that are used for anticipating movements in the coincident index at a horizon of roughly six months.
Deutsche Bank FCI diverges from the other indexes by its use of the principal components approach (Hooper, Mayer and Slok, 2007; Hooper, Slok and Dobridge, 2010). The index is available from 1983. The first principal component is extracted from a set of seven standardized financial variables including the exchange rate, bond, stock, and housing market indicators. Weighted sum of these principal components and the target federal funds rate are then calculated to set the FCI. Regression of the real GDP growth on financial variables and the lagged GDP growth is used to determine the weights. Negative or positive values of the index indicate the percentage point drag or boost to GDP from financial conditions respectively, at a point in time.
Goldman Sachs FCI has four main components; namely, weighted sums of short-term bond yields, long-short-term corporate yields, the exchange rates, and a stock market variable (Dudley and Hatzius, 2000; Dudley, Hatzius and McKelvey, 2005). This FCI represents tightening of financial conditions by an increase whereas it represents easing by a decrease.
In 2009, the Federal Reserve Bank of Kansas City has developed a Financial Stress Index (KCFSI), which is a combination of 11 standardized financial indicators. The financial variables chosen by the Federal Reserve Bank of Kansas City can be divided into two categories: yield spreads and asset price behavior. The bank chooses these variables based on three criteria: (1) the monthly availability with a history extending back to at least 1990; (2) the ability to represent market prices or yields; and (3) the ability to represent at least one of five financial stress features
that were identified by the Kansas City Federal Reserve. The series is updated monthly and history is available from 1990. Hakkio and Keton (2009), the founders of the index, define these aforementioned five financial stress features as: increased uncertainty about fundamental value of assets, increased uncertainty about behavior of other investors, increased asymmetry of information, decreased willingness to hold risky assets (flight to quality) and decreased willingness to hold illiquid assets (flight to liquidity).
Another index that was developed in the 1990s is the monetary and financial conditions index of Macroeconomic Advisers (MA). The index incorporates 38 quarters of financial variable lags and is available from 1982:Q4. This index includes the dynamic effects of financial variables on GDP over time for its calculations (Macroeconomic Advisers, 1998). A “surface impulse response” methodology is developed to integrate five different financial variables in the FCI. These variables are real short rate, real long rate, dividend ratio, real exchange rate, and real stock market capitalization. Estimation of the partial effects of changes in the financial variable on real GDP growth over time is used to generate response functions through the use of simulations with MA’s large-scale macroeconomic model. The response functions were inverted and aggregated for the combined effects of current and past changes in each of the financial variables on real GDP growth in the current period to be shown by MA FCI at any point in time.
In 2008, OECD has developed its own FCI by combining six financial variables and weighting them according to their effects on GDP over the next four to six quarters (Guichard and Turner, 2008). This FCI distinguishes itself from others by its inclusion of a variable for tightening of credit standards: the Federal Reserve Senior Loan Officer Survey’s series for the net percent of banks tightening standards for large and medium-sized firms. A regression of the output gap on a distributed lag of the financial indicators is used to determine the index weights. The history of the index is from 1995.
Cardarelli et al. (2009) developed an index for the developed countries by examining the episodes of financial stress and recession for 17 countries1 within a
range of 30 years. They focus on changes in three sub-indexes which are banking, security and foreign exchange markets. The FSI for each country is constructed as a variance-weighted average of three sub-indexes. The authors used three variables for the banking sector: for the banking sector, TED spread and the slope of the yield curve. The variables that are used for the securities market are corporate bond spreads, stock market revenue within one month period and the volatility of the monthly returns of the stock market calculated derived from the GARCH (1, 1) model. For the exchange market, the volatility of the monthly changes in nominal effective exchange value are used, derived from the GARCH (1, 1) model.
The financial stress index for developed countries that was constructed by Cardarelli et al. (2009) was later adapted to the developing countries by Balakrishnan et al. (2009). Five variables come together to form the Emerging Market (EM) FSI to represent changes in three financial market segments; those are, banking, securities
1 Australia, Austria, Belgium, Canada, Denmark, Finland, France, Germany, Italy, Japan,
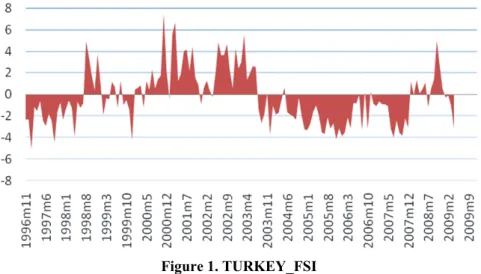
markets, and exchange markets. The five variables of the EM-FSI are the “banking-sector beta,” denoted as β, stock market returns, time-varying stock market return volatility, sovereign debt spreads, and an exchange market pressure index (EMPI). Authors form the financial stress index on a monthly basis. Index starts from 1997 and includes 26 countries2. Figure 1 shows the authors’ FSI data for Turkey.
Figure 1. TURKEY_FSI
Oet et al. (2011) developed a FSI for the United States, the Cleveland Financial Stress Index (CFSI). The CFSI is constructed using daily data from 11 components reflecting four financial sectors: credit markets, equity markets, foreign exchange markets, and interbank markets. Most of the CFSI components are spreads (i.e. interbank liquidity spread, corporate bond spread, liquidity spread) and two of the remaining CFSI components are ratios, and one is a measure of stock market volatility.
Studies related to the financial stress index in Turkey are quite recent. But there are studies which aim at forecasting financial crises using monthly and quarterly data; mostly having data lags due to their variables (Kibritçioğlu, Köse and Uğur, 1999; Tosuner, 2005; Kaya and Yılmaz, 2007). Uygur (2001) has formed a financial stress index which aims at forecasting financial crises through standardized series that are formed by percentage changes in interest rates, percentage changes in exchange rates and percentage changes in foreign currency reserves. Uygur states that a +/- 1.5 standard deviation from the mean index value will produce a crisis signal.
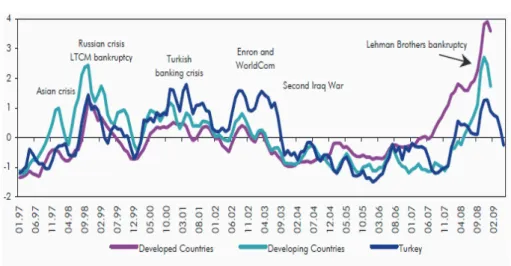
In the May 2009 Financial Stability Report of Central Bank of Turkey (CBRT) (2009:76-78), Turkey’s performance during the global crisis is evaluated through a monthly financial stress index which was designed for Turkey. CBRT computed the financial stress index through five sub-market indexes. These are foreign exchange market pressure index, riskiness of the banking sector, equity market and perceptions of uncertainty towards this market.
2 Argentina, Brazil, Chile, China, Colombia, Czech Republic, Egypt, Hungary, India,
Indonesia, Israel, Korea, Malaysia, Mexico, Morocco, Pakistan, Peru, Philippines, Poland, Russia, Slovak Republic, Slovenia, South Africa, Sri Lanka, Thailand, and Turkey.
Figure 2. Financial Stress Index
By using FSI, CBRT compared the stress of the financial markets of Turkey and the other developing countries (see Figure 2). Stress in the financial markets of Turkey is observed to increase more than the average of developing countries during global stress periods. This situation became more obvious during the banking sector crisis of 2001 in Turkey and second Iraq War in 2003. However, during the current financial crisis, Turkey’s financial stress index performed better than that of developing countries. Turkey’s FSI increased less and in the last period decreased remarkably more than the average of developing country FSIs.
Elekdağ et al. (2010) examined the relationship between economic activity and financial stress for the Turkish economy. In their study, indexes and variables that form the FSI are as follows: (i) foreign exchange market pressure index, (ii) differences in returns that measures country credit risk (iii) returns on stock prices, (iv) uncertainty related to the returns on stock pricesand lastly (v) the “beta” value that measures banking sector risk level. Authors concluded that financial stress has negative effects on output.
3. Formation of the Financial Stress Index for Turkey
3.1 Financial Stress Index: Its Purpose and Limits
FSIs can be developed for various reasons. Therefore, indicating the reasons behind developing a particular FSI is important for determining the limits and variables of that index.
FSI_T do not have any purpose of doing inter-country comparisons. Therefore, FSI_T is not a common stress index that is computed according to countries or groups of countries, and the variables chosen for FSI do not necessarily have to be meaningful for a common group of countries. This situation creates a possibility to choose indicators which are thought to be more representative of the financial stress in Turkey.
Another special attribute of FSI related to its Turkish characteristics is its relationship with time. Turkey, as a developing country, has various periods of monetary policies, namely exchange rate peg (between January 2001 and February 2001), transition period (between February 2001 and December 2001), and dual
targeting, which includes monetary targeting and implicit inflation targeting
(between 2002 and 2005) and explicit inflation targeting (between 2006 and today). It is obvious that these changes in monetary policy have effects on all other financial indicators, especially on the exchange rates. For example, since foreign exchange rate was set by the CBRT during the exchange rate targeting episode, it is hard to develop a stress factor for this indicator, except the periods of devaluation. Therefore, indicators that are chosen for this study: (i) have similar monetary policy backgrounds; (ii) have prices that are determined by the market. For this reason, FSI_T is designed for the post-2002 period when there exists an inflation targeting, the interest rates are used as means of monetary policies and exchange rates are determined by the market.
In the literature, FSI is mostly computed monthly or quarterly. Since changes in financial sector are rapid, and these changes can occur only within months during a financial crisis, a real-time frequency is needed. Therefore, in this study, FSE is calculated on a daily basis, and variables are chosen to match with this daily frequency.
Current studies of continuous indexes generally allow use of both spreads and the conceptually similar volatility indexes as index components. Following Oet et al. (2011:13), volatility indexes are chosen not to add as index components. Although observations of financial sector stress can be obtained from both spreads and volatility indexes, one important shortcoming can be considered as their concurrent use in constructing a FSI in which their contributions have qualitatively different insights. The prices of many securities are blended in volatility indexes. Causal transmission mechanism become invisible by the indexes, in a way that the factors entering the volatility series influence the stress index, making the mechanism a “black box”3 that is, only indirectly observable -and obfuscating the stress index. On
the other hand, spreads can be explained as differences between two related securities. Their definition helps the clarifying of the transmission mechanism in spread changes. Empirically, when the stress index and alternative indexes using mixed methods are compared, interestingly it would be seen that a spread-based financial stress index can identify stress episodes more quickly. In addition, Oet et al. (2011) show that a spread-based financial index frequently leads the volatility indexes in the interbank and credit markets.
3.2 Construction of Financial Stress Index
FSI_T is an equally weighted4 sum of four sub-indexes: Banking Sector, Public
Sector, Stock Market and Foreign Exchange Market. Each variable is standardized, demeaned (using the arithmetic mean) and divided by its standard deviation. These four standardized components are summed up in order to yield the aggregate financial stress index for Turkey. Positive index values indicate that financial stress
3 See Bernanke and Gertler (1995), “Inside the Black Box: The Credit Channel of Monetary
Policy Transmission.”
is above the long-run average, while negative values indicate that financial stress is below the long-run average.
In this study, TRLIBOR, foreign exchange rate and stock prices data were retrieved from Reuters database; other data were collected from CBRT Electronic Data Delivering System (EDDS). Definitions for the data are presented in the further subsections where sub-compounds of the index are described. The four sub-indexes (banking sector, public sector, stock market and foreign exchange market) are presented in the Appendix.
3.2.1 Banking Sector
Following Oet et al. (2011), interbank cost of borrowing is used for capturing banking sector stress level. Interbank cost of borrowing measures the degree of apprehension with which banks loan to one another. The three-month LIBOR-Fed funds spread was used by Oet et al. (2011). In a financial market which is considered to be well-functioning, the unsecured LIBOR rate and the Fed funds target rate difference would approach zero through arbitrage. The spread between the two rates demonstrates that there are either increase in default risk or a lack of capital requirements for banks to enter arbitrage deals. The following is an indicator of Turkey banking sector:
Interbank cost of borrowingt = 3M TRLt – TFRt
where 3M TRL is the three-month Turkish LIBOR rate, and TFR is the Central Bank of Turkey policy rate. TRLIBOR published by The Banks Association of Turkey since 1st of August, 2002 (see www.tbb.org.tr). For this reason, FSI_T start from 1st of August, 2002.
3.2.2 Public Sector
CBRT (2005:10-11) states that the public sector affects the performance of inflation targeting in Turkey through four different channels. The first channel is the long-term expectations. Further enhancement of fiscal discipline through its continuity will increase the effectiveness and predictability of monetary policy by extending the borrowing maturities and reducing the risk premium and the volatilities in risk premiums and contribute to the credibility of the inflation targeting regime. The second channel works through the prices of goods and services produced by the public sector itself. The third channel works through the income policy of the public sector. Wage improvements by the public sector to its own employees are among the main determinants of expectations for price and wage inflation in Turkey. The fourth channel is the direct spending channel. Direct purchases of goods and services by the public sector are reflected on inflation via aggregate demand. This relationship between fiscal discipline and inflation targeting shows that continuity and consistency of fiscal discipline constitute the main pillars of the success of inflation targeting.
This strong relationship between the public sector and monetary policy affects all other financial indicators and the expectations as well. Besides, public sector is also important for controlling the current account deficit related risks5.
Balakrishnan et al. (2009:8) used sovereign debt spreads for emerging markets including Turkey. Sovereign debt spreads is defined as the bond yield minus the 10-year United States Treasury yield using JP Morgan EMBI Global spreads or five-year credit default swap spreads. In this paper, Turkey five-five-year USD credit default swap spreads were used in constructing the FSI_T.
3.2.3 Stock Market
Stock market is one of the markets that reflect the changes in financial markets, fluctuations and expectations best. In computation of FSI, the returns on this market are included as an indicator of stress in stock markets. For this aim, following Balakrishnan et al. (2009), Istanbul Stock Exchange (XU100) returns are computed as the year-on-year percent change in the stock index multiplied by minus one. Hence, a drop in the stock returns that exceeds the mean of the sample period will be included in computation of FSI as a factor increasing the financial stress.
3.2.4 Foreign Exchange Market
Foreign exchange market is a very important market for many reasons. Its global character similar to stock markets, its ability to immediately reflect expectations, fluctuations and changes in financial markets onto the exchange rates, its tendency to be affected from the monetary policy of countries, its effects on production (especially on imports and exports) and its capacity of financing the trade deficit are among these reasons.
In this study, the year-on-year percent change on the U.S. dollar closing prices are calculated and standardized. Any increase in returns on the U.S. dollar (depreciation in Turkish Lira) that exceeds the mean of sample period shows an increase in financial stress.
Most of the studies in the literature (see Balakrishnan et al., 2009), an exchange market pressure index (EMPI) was used for capturing the foreign exchange market stress. EMPI captures exchange rate depreciations and declines in international reserves (total reserves minus gold). EMPI was not used as a component of foreign exchange market stress as the international reserve data was not available in daily frequencies.
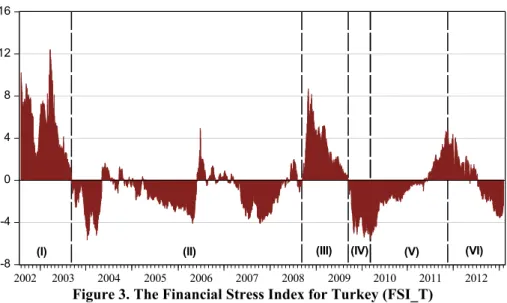
4. The Financial Stress Index for Turkey
Four different stress indicators listed above come together to form FSI_T6. For the
entire period, FSI_T has a maximum 12.41 and a minimum -5.67 standard deviation. According to the stress levels, financial stress periods can be classified through five different categories: (I) the high stress period (II) the normal stress period (III) the
5 In addition, in CBRT’s (2010) Monetary and Exchange Rate Policy for 2011 report, this
issue is emphasized by the following phrase: “increasing government savings -and therefore maintaining fiscal discipline- is also essential with a view to containing the risks regarding the current account deficit”.
global crisis stress period (IV) the low stress period (V) the increasing stress period (VI) the decreasing stress period (see Figure 3).
Figure 3. The Financial Stress Index for Turkey (FSI_T)
On the way to show the sources of stress, Table 1 shows the average stress levels of FSI_T and the sub-markets that cause stress.
Table 1. Average Stress Levels by Period
FSI_T Market Stock Exchange
Foreign-Market
Public Sector Banking Sector
Period I 5.36 0.59 0.31 2.59 1.86 Period II -1.23 -0.31 -0.52 -0.23 -0.16 Period III 3.11 1.43 1.75 0.18 -0.25 Period IV -3.73 -1.74 -0.44 -0.54 -1.00 Period V -0.59 -0.14 0,12 -0.58 0.01 Period VI -0.02 0.47 0.38 -0.44 -0.43
I) The high stress period
This period covers the time period between 01.08.2002 and 09.09.2003, when the index is above zero and the average stress level is 5.36. The main characteristic of this period is that it represents the post-2001 financial crisis, during which political risks were important and the second Iraq War occurred. After the liquidity crisis in November 2000 and the following February 2001 financial crisis,7 many banks were
bailed out by Saving Deposits Insurance Fund of Turkey (SDIF), including Bank Kapital Türk, Etibank, Milli Aydın Bankası, Bayındırbank, Demirbank, İktisat Bankası, Ege Giyim Sanayicileri Bankası, Kentbank, Sitebank and Toprakbank. In addition to this, losses of the publicly owned banks were paid, capital structures of these banks were enhanced and their operational systems were restructured. Bailing out these banks and covering their losses worsened the already downward outlook of the public resources. Therefore, during this period while all the sub-markets were increasing the stress, the primary source of the stress was the public sector (2.59) and the secondary source was the banking sector (1.86).
7For more information Boratav and Yeldan, 2005; Alper and Onis,2003. -8 -4 0 4 8 12 16 2002 2003 2004 2005 2006 2007 2008 2009 2010 2011 2012
II) The normal stress period
This period covers the time period between 10.09.2003 and 03.09.2008, when the index remained close to zero, which indicates the normal stress level. The mean stress level for this period is -1.23. All the sub-markets contributed to the reduction of stress. Foreign-exchange market (-0.52) and stock market (-0.31) made the biggest contribution to the decrease in stress. In accordance with the recovery in the public budget, the public sector has no longer been a stress-producing factor for financial Sector.
The positive stress episode that occurred between 05.06.2006 and 10.08.2006 represents the May-June 2006 financial turbulence. During this episode Fed’s decision to increase the interest rates due to its expectation of inflation gave way to capital outflow from the developing countries such as Turkey. This had negative effects first on the exchange rates, which is then followed by other negative effects on stock market, inflation and interest rates (see Appendix). Stock market and exchange rate market are two main factors that determine the stress before the global crisis. With the increase in the stress levels of the stock markets by January 2008, financial stress has also started to increase. However, during this time, the stress of financial sector remained low since the exchange market kept its negative stress position (see Appendix).
III) The global crisis stress period
This period covers the time between 04.09.2008 and 09.09.2009 when the index was above zero. The mean stress for this period is 3.11. Two factors that increase the financial stress are the exchange rate market (1.75) and the stock market (1.43) which carry the early effects of foreign financial shocks. Although the banking sector created positive risk between October 2008 and December 2008, it helped reduce the total risk later thanks to the decrease in inflation and interest rate. During this period stress of banking sector kept its -0.25 level, which is a normal stress level. Restructuring and regulation of the banking sector during the post-2001 crisis period, increase in the strength of the financial sector against global crisis and the weak relationship of the Turkish banking sector with derivative financial instruments helped banking sector remain less effected from the financial crisis. Public sector had also significant role in reducing the financial stress. Existence of a stronger fiscal discipline in Turkey than the developed countries also helped stress on financial sector remain low.
IV) The low stress period
This period covers the time period between 10.09.2009 and 08.03.2010, when the index fell below zero level and reached the minimum level. The mean stress for this period is -3.73. All the sub-markets contributed to the reduction of stress. Stock market (-1.74), banking sector (-1.00), and the public sector (-0.54) made the biggest contribution to the decrease in stress. During this period Turkey distinguished itself from many other developed countries which were affected from crisis; Turkish economy experienced low inflation rates accompanied with an increase in output and low interest rates.
During the global crisis, the central banks of developed countries provided extraordinary levels of liquidity to the markets. Due to the financial support
programs implemented during the crisis period, government budget deficits also reached very high levels. The stronger position of Turkey’s public sector and financial markets compared to especially to the developed countries gave way to a flow of short-term capital into the country. It should be noted that during this period the FSI_T did not reflect signs of serious stress during the time of capital flow. The increase in the capital flow also increased returns on stock market and caused valuation of the Turkish Lira. It also caused an increase in current account deficit, while this deficit was financed by short-term capital. The decrease in prices of imported goods also decreased the inflation and the increase in capital flow helped reduce interest rates. These low interest rates help decrease riskiness by reducing ex-ante real interest rates in banking sector and in public sector until there is deterioration in inflation expectations. Therefore, it is possible to argue that capital flow reduces the financial stress.
In this situation, a low financial stress level below zero can be considered as a risk factor as well as a high financial stress level. The high stress level which is above the long-term average (max: 12.41) fell significantly below the long-term stress levels (min: -5.67). Perception of this low stress level can also be a threat for the financial stability. However, it can be seen that financial stress has later approached to the normal levels thanks to the policies implemented by CBRT which took place in the next period, which is named as the increasing stress
period.
V) The increasing stress period
This period covers the time between 09.03.2010 and 21.11.2011, when stress has started to increase from its minimum level to a higher level. The mean stress of this period is -0.59. Due to the “exit strategy” that was started to be implemented by CBRT in April 2010 and the effects of the European debt crisis mainly on stock prices and the foreign exchange market, FSI_T started to increase from its minimum level of -5.58. The stress level reached to 4.78 by 21.11.2011 (local maximum).
The CBRT decreased the funding in excess of the needs of the market as the first phase of exit strategy8 from global crisis, announced on 14 April 2010. In this
context, low policy rate, wider interest rate corridor downwards and high required reserve ratios were considered as an appropriate policy mix. In the exit strategy period, the low-remaining interest rates and inflation rates in line with expectations enabled stress index in banking sector and public sector to remain at low levels (See Appendix).
From November 2010 to August 2011, when the uncertainties in the European economy intensified, the CBRT9 aimed at limiting short term capital flows and
preventing excessive appreciation of the Turkish lira on the one hand, and ensuring a more controlled growth in domestic credit and demand as well as balancing the divergence between external and domestic demand on the other. The CBRT widened the interest rate corridor by reducing the overnight borrowing rate. Meanwhile, the required reserve ratios were raised significantly in the same period
8 For more information CBRT, (2010b). 9 For more information CBRT, (2011).
to avert excessive credit growth and contain domestic demand. Furthermore, the Central Bank aimed to make use of the short-term capital inflows as much as possible, through regular foreign exchange purchase auctions, in order to strengthen the reserves of the Central Bank in this period. These measures lifted the excessive appreciation pressure on the Turkish lira.
With the policies followed, the stress level in the stock market and foreign exchange market increased; and the stress level in the banking sector, keeping at a low level, approached its normal level, and the stress level in the public sector kept low.
VI) The decreasing stress period
This period covers the time between 22.11.2011 and 31.01.2013, when stress has started to decrease from its local maximum to a lower level. The mean stress of this period is -0.02. While the main source of stress are the stock market (0.47) and exchange market (0.38); public sector (-0.44) and banking sector (-0.43) are reducing the stress.
The Central Bank implemented a sizable tightening in October 2011 in order to contain inflation expectations. The CBRT widened the interest rate corridor upwards in October by increasing its overnight lending rate. Due to the increase in global risk appetite, improvement in the inflation outlook besides the more evident stabilization process in the economy, monetary policy has gradually proved more supportive since the midst of 2012. Accordingly, the CBRT has reduced the average cost of funding gradually by injecting more liquidity to the market from June onwards. The CBRT’s weighted average cost of funding reduced from 11 percent in January to 5-6 percent in December (see CBRT, 2013).
4. Conclusion
This study presents a financial stress index for Turkey on a daily basis. The index covers the time period between 01.08.2002 and 31.01.2013, and it presents the summation of stress levels collected through the Banking Sector, Public Sector, Stock Market and Exchange Market. So as to enable the financial institutions and policy makers to determine the financial stress on the sub-markets and financial sector, and manage the monetary policy, an indicator with high frequency was aimed to be provided.
The stress in Turkey’s financial sector is examined through six different periods: (i) the high stress period (ii) the normal stress period (iii) the global crisis stress period (iv) the low stress period (v) the increasing stress period and (vi) the decreasing stress period. The most important sources of stress are public sector during the high stress period, the banking during the normal stress period, foreign exchange market and stock markets during the global crisis period. During the low stress period stock market and the banking sector became the main factors that helped reduce stress.
While being a positive source of stress in general, the banking sector helped reduce stress in the post-global crisis period. Although public sector was a component of stress in the pre-2004 period, due to the improvements in the fiscal
budget it helped reduce stress during the post-2004 period. However, the foreign exchange market and the stock market, which are more prone to the outer shocks, were factors that increased the stress during the global crisis. In addition to this, unlike the stock market, the low stress level of the foreign exchange market during the pre-global crisis period helped keep Turkey’s financial stress at low levels. The increase in the capital flow during the low risk period is considered as a risk factor by CBRT and reduced financial stress to significantly low levels below normal. This shows that significantly low levels of financial stress below average can be taken as a risk factor as well as high levels. It is important to consider this fact during the management of monetary policies.
5. Acknowledgments
The author thanks Ozkan Erdal (Head of the Risk Monitoring Department, Development Bank of Turkey), anonymous referees and editor for useful comments without implicating them for any remaining errors.
The views expressed in this paper are those of the author only and cannot be taken to represent the views of the Development Bank of Turkey.
6. References
ALPER, C.E., ONIS, Z. (2003). Emerging market crises and the IMF: rethinking the role of the IMF in the light of Turkey’s 2000-2001 financial crises. Canadian Journal of Development Studies, 23 (3), pp.267-284.
BALAKRISHNAN, R., DANNINGER, S., ELEKDAG, S., TYTELL, I. (2009). The transmission of financial stress from advanced to emerging economies. IMF Working Paper, WP/09/133.
BERNANKE, B., GERTLER, M. (1995). Inside the black box: the credit channel of monetary policy transmission. Journal of Economic Perspectives. 9 (4), pp.27–48. BORATAV, K., ERİNÇ Y. (2005). Turkey, 1980-2000: financial liberalization,
macroeconomic (in)stability, and patterns of distribution. Chapter 14, in L. TAYLOR (ed.) External liberalization in Asia, post-socialist Europe, and Brazil. New York: Oxford University Press.
CARDARELLI, R., ELEKDAG, S., LALL, S. (2009). Financial stress, downturns, and recoveries. IMF Working Paper. WP/09/100.
CBRT. (2005). General framework of inflation targeting regime and monetary and exchange rate Policy for 2006. December.
CBRT. (2009). Financial stability Report, 8, May.
CBRT. (2010). Monetary and exchange rate policy for 2011, December. CBRT. (2010b). Monetary policy exit strategy, April.
CBRT. (2011). Monetary and exchange rate policy for 2012, December. CBRT. (2013). Monetary and exchange rate policy for 2013, December.
DAVIS, E.P., FAGAN, G. (1997). Are financial spreads useful indicators of future inflation and output growth in EU countries?. Journal of Applied Econometrics. 12 (6). pp.701-14.
D‘ANTONIO, P. (2008). A view of the U.S. subprime crisis. EMA Special Report, Citigroup Global Markets Inc., Appendix, pages 26-28. in DiClemente, R. and K. Schoenholtz. September.
DUDLEY, W., HATZIUS, J., McKELVEY, E. (2005). Financial conditions need to tighten further. US Economics Analyst. Goldman Sachs Economic Research. April 8.
DUDLEY, W., HATZIUS, J. (2000). The Goldman Sachs financial conditions index: the right tool for a new monetary policy regime. Global Economics Paper, 44. June 8.
ELEKDAĞ, S., KANLI, İ., B., SAMANCIOĞLU, Z., SARIKAYA, Ç. (2010). Finansal stres ve iktisadi faaliyet. Central Bank Review. 10, pp.1-8.
ESTRELLA, A., HARDOUVELIS, G. (1991). The term structure as a predictor of real economic activity. Journal of Finance. 46, 555-576.
ESTRELLA, A., MISHKIN, F. (1998). Predicting U.S. recessions: financial variables as leading indicators. Review of Economics and Statistics. 80, pp.45-61.
FREEDMAN, C. (1994). The use of indicators and of the monetary conditions index in Canada. in T.J.T. BALINO and C. COTTARELLI (eds). Frameworks for monetary stability: policy issues and country experiences, 458-476, IMF, Washington, D.C. FRIEDMAN, B., KUTTNER, K. (1992). Why does the paper-bill spread predict real
economic activity?. in Business cycles, indicators and forecasting. J. STOCK and M. WATSON (eds.). Chicago: University of Chicago Press.
GUICHARD, S., TURNER, D. (2009). Quantifying the effect of financial conditions in the Euro area, Japan, United Kingdom and United States. OECD Economics Department Working Papers, 677.
HARVEY, C. (1988). The real term structure of and consumption growth. Journal of Financial Economics. 22, 305-333.
HAKKIO, C.S., KEETON W.R. (2009). Financial stress: what is it, how can it be measured, and why does it matter?. Federal Reserve Bank of Kansas City Economic Review.
HATZIUS, J., HOOPER, P., MISHKIN, F.S., SCHOENHOLTZ K.L., WATSON, M.W. (2010). Financial conditions indexes: a fresh look after the financial crisis. NBER Working Paper. 16150.
HOOPER, P., MAYER, T., SLOK, T., (2007). Financial conditions: central banks still ahead of markets. Deutsche Bank. Global Economic Perspectives. 11.
HOOPER, P., SLOK, T., DOBRIDGE C. (2010). Improving financial conditions bode well for growth. Deutsche Bank. Global Economic Perspectives.
KAYA, V., YILMAZ, Ö. (2007). Para krizleri öngörüsünde logit model ve sinyal yaklaşımının değeri: Türkiye tecrübesi. Turkish Economic Association Working Papers. 2007/1.
KİBRİTÇİOĞLU, B., KÖSE, B., UĞUR, G. (1999). A leading indicators approach to the predictability of currency crises: the case of Turkey. Hazine Dergisi, Working Paper No. 1998/12.
OET, M., V., EIBEN, R., BIANCO, T., GRAMLICH, D., ONG, S.J. (2011). The financial stress index: identification of systemic risk conditions. Working papers of the Federal Reserve Bank of Cleveland, 11-30.
PLOSSER, C.I., ROUWENHORST, G.K. (1994). International term structures and real economic growth. Journal of Monetary Economics. 33. 133-155.
ROSENBERG, M. (2009). Financial conditions watch. Bloomberg. December 3.
STOCK, J., WATSON, M. (1989). New indexes of coincident and leading Economic. NBER Macroeconomics Annual. The University of Chicago Press.
TOSUNER, A. (2005). Finansal krizler ve kırılganlık: Türkiye için bir erken uyarı sistemi önerisi. İktisat, İşletme ve Finans, 20, 235.
UYGUR, E. (2001). Krizden krize Türkiye: 2000 kasım ve 2001 şubat krizleri. Türkiye Ekonomi Kurumu, Tartışma Metni.
ZARNOWITZ, V. (1992). Business cycles: theory, history, indicators and forecasting. University of Chicago Press, 316-356.
Appendix: The Sub-Indexes Used in the Study
-3 -2 -1 0 1 2 3 4 5 2002 2003 2004 2005 2006 2007 2008 2009 2010 2011 2012 Banking Sector(I) (II) (III) (IV) (V) (VI)
-3 -2 -1 0 1 2 3 4 5 2002 2003 2004 2005 2006 2007 2008 2009 2010 2011 2012 Public Sector
-3 -2 -1 0 1 2 3 4 5 2002 2003 2004 2005 2006 2007 2008 2009 2010 2011 2012 Stock Market
(I) (II) (III) (IV) (V) (VI)
-3 -2 -1 0 1 2 3 4 5 2002 2003 2004 2005 2006 2007 2008 2009 2010 2011 2012 Foreign-Exchange Market