www.betam.bahcesehir.edu.tr
1
DOMESTIC DEMAND CONTINUES TO DECLINE
Seyfettin Gürsel•, Zümrüt İmamoğlu‡ ve Barış Soybilgen†
Executive Summary
According to data released by Turkstat, Turkey’s real GDP increased at an annual rate of 2.9 percent in the second quarter of 2012 from the same quarter of the previous year. In the last quarter of 2011, the year on year (YoY) growth had fallen to 5.2 percent from 8.4 percent and in the first quarter, the YoY growth was 3.2 percent. In the second quarter, the YoY growth rate slowed down further falling below 3 percent. Growth rate in the first half of 2012 ended up as a mere 3.1 percent.
While slowing down continues YoY, quarter on quarter (QoQ) growth increased pace in the second quarter. Turkstat announced that the seasonally adjusted real GDP increased by 1.8 percent from the first quarter of 2012. In the first quarter, the real GDP had contracted was -0.1 (revised from -0.4 initially). Therefore, Turkish economy compensated the loss of the last quarter. In spite of the high growth rate, domestic demand continued to decline. Unlike TUIK, Betam seasonally adjusts each GDP component separately. According to Betam’s analysis, QoQ the changes in private investment and private consumption are negative in the second quarter. The main source of the economic growth was again the increase in net exports.
•
Prof. Dr. Seyfettin Gürsel, Betam, Director [email protected]
‡
Zumrut Imamoglu, Betam, Research Associate zumrut.ı[email protected]
†
Baris Soybilgen, Betam, Research Assistant [email protected]
Following the slowdown in the economy, current account deficit is declining. The 12-month current account deficit was realized as 8.2 percent at the end of the second quarter, down from 9.3 at the end of the first quarter.
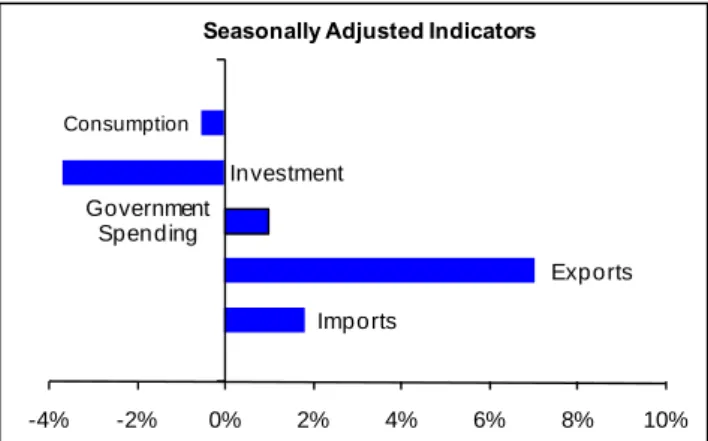
Figure 1: Change in GDP components in 2012-Q2 from the previous quarter
Source: Turkstat, Betam. Quarterly indicators are seasonally adjusted and calendar day corrected.
Figure 2: Contributions of GDP components to 2012-2Q GDP growth
Source: Turkstat, Betam. Quarterly indicators are seasonally adjusted and calendar day corrected.
Imports Exports Government Spending Investment Consumption -4% -2% 0% 2% 4% 6% 8% 10%
Seasonally Adjusted Indicators
Imports Exports Inventory Investment Government Spending Investment Consumption -1.5% -1.0% -0.5% 0.0% 0.5% 1.0% 1.5% 2.0% 2.5%
Seasonally Adjusted Indicators
Total Growth: 1.9%
Growth Review: 2012, 2
nd
Quarter
www.betam.bahcesehir.edu.tr
2
Decline in domestic demand continuesTo analyze the contributions of GDP components to the growth, Betam seasonally adjusts and calendar day corrects each component of GDP separately. Figure 1 and Figure 2 show the change in GDP components and their contributions to growth in the 2nd quarter from the previous quarter. According to Betam calculations, the real GDP increased by 1.9 percent (Turkstat announced 1.8 percent QoQ GDP growth)1 in the second quarter from the first quarter. This high growth rate compensated the 0.1 percent contraction in the first quarter.2 On the other hand, private investment and consumption expenditures continued to decline. Public expenditures increased slightly. Overall, domestic demand contracted. The main source of growth was the increase in net exports, as it also has been in the last two quarters.
The contribution of net exports is high
Net exports increased mainly due to the high increase in exports. Exports increased by 7.1 percent in the second quarter from the first quarter and contributed 1.8 percentage points to the real GDP growth. Imports, on the other hand, increased by 1.8 percent and subtracted 0.5 percentage points from growth. Therefore, net exports contribution to growth was 1.3 percentage points. As exports increased more than imports, current account deficit to GDP ratio declined from 9.3 percent at the end of the first quarter to 8.2 percent at the end of the second quarter.
Consumption expenditures decrease
According to Betam’s calculations, real private consumption expenditure has been decreasing since the last quarter of 2011. In the second quarter of 2012, private consumption expenditure declined by
1
Methodological differences between Turkstat and Betam in seasonally adjusting the real GDP are explained in Box1.
2
Revised down from -0.4 initially.
0.5 percent and subtracted 0.4 percentage points from the real GDP growth rate. However, there was a large increase in inventory investment. Since production of consumption goods has been increasing during this period, we conclude that the increase in the production and the decline in the consumption caused inventory investment to increase. Inventory investment contributed 1.6 percent points to the real GDP growth, the second highest contribution following exports. Industrial production index in July continued to increase. If private consumption doesn’t experience a revival soon, it will cause inventory investment to increase more and eventually lead to a slowdown in industrial production. The government’s objective of 4 percent real GDP growth rate, stated in the Medium Term Program, is jeopardized by the ongoing decline in private consumption expenditure which is the largest expenditure component of the GDP.
Investments decline
The weakness in private investment expenditure continues. In the second quarter of 2012, private investment expenditure fell by 3.7 percent and it subtracted 0.8 percent point from the quarterly real GDP growth. In the first quarter it had increased by only 0.2 percent, adding 0.1 percentage points to growth. The deterioration in investment environment does not indicate a positive picture for the second half of 2012 and it is still early for the stimulus package, announced in the first quarter of 2012, to show any effect.
Fiscal policy is still tight
From the first quarter of 2012 to the second quarter of 2012, government expenditures increased by a mere 1 percent and contributed 0.1 percentage points to the GDP growth. The small contribution from government expenditures in the second quarter indicates that the government still pursues a tight
www.betam.bahcesehir.edu.tr
3
fiscal policy to meet its budget target. But, if growth rate remains low in the coming quarters, government may be forced to implement expansionary policies.
Growth perspective for the rest of 2012
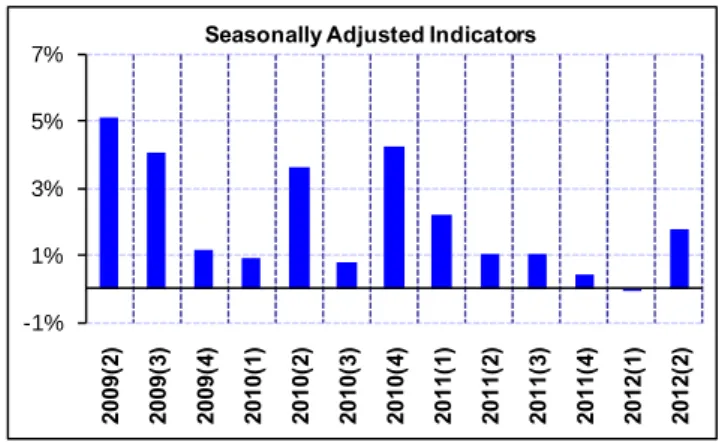
Since the second half of the last year, growth rate of the GDP has been declining in line with the slowdown in the domestic demand. In the first half of 2012, the annual GDP growth rate was 3.1 percent (Table 3). In the second half of 2011, the annual GDP growth rate was 6.8. The main reason for the decline in the GDP growth is the fall in private consumption and investment expenditures. National accounts data show that the slowdown in domestic demand has turned into a contraction. The positive GDP growth rate is only stemmed from the positive contributions of net exports. However, net exports contributions may not be enough to reach the 4 percent growth target at the end of the year. In fact, it seems implausible to reach the target without a revival in domestic demand. Quarterly growth rate of 1 percent for the rest of year will lead to a 3 percent annual GDP growth rate. To reach the 4 percent annual growth rate, the economy must grow by at least 2 percent, quarterly. The government seems determined to keep the fiscal stance tight, so pressure on the Central Bank of Turkey may rise for further ease in monetary policy.
Figure 3: Quarter-on-quarter real GDP growth rate
Source: Turkstat.
Table 1. Changes in and contributions of GDP components for 1Q2012 and 2Q2012, compared to the previous quarters
2012 – 2Q Change (%) Contribution (pp) Consumption -0.5 -0.4 Investment -3.7 -0.8 Government exp. 1.0 0.1 Inventory Inv. ---- 1.6 Exports 7.1 1.8 Imports 1.8 -0.5 2011 – 1Q Change (%) Contribution (pp) Consumption -0.8 -0.6 Investment 0.2 0.1 Government exp. 2.8 0.4 Inventory Inv. ---- -0.1 Exports 3.5 0.8 Imports 1.5 -0.4
Source: Turkstat, Betam.
Table 2. Changes in and contributions of GDP components in 1Q2012 and 2Q2012, compared to the same quarter of the previous year
2012 – 2Q Change (%) Contribution (pp) Consumption -0.5 -0.3 Investment -7.9 -1.9 Government exp. 2.1 0.3 Inventory Inv. ---- -0.8 Exports 19.8 4.6 Imports -3.6 1.1 2011 – 1Q Change (%) Contribution (pp) Consumption 0.2 0.1 Investment 1.4 0.3 Government exp. 4.7 0.6 Inventory Inv. ---- -2.3 Exports 11.9 2.7 Imports -6.0 1.9
Source: Turkstat, Betam.
-1% 1% 3% 5% 7% 2009( 2) 2009( 3) 2009( 4) 2010( 1) 2010( 2) 2010( 3) 2010( 4) 2011( 1) 2011( 2) 2011( 3) 2011( 4) 2012( 1) 2012( 2)
www.betam.bahcesehir.edu.tr
4
Table 3. Change and contributions of GDPcomponents in 1st half of 2012 and 2nd half of 2011 compared to the same half of the previous year
2012 – 1st Half Change (%) Contribution (pp) Consumption -0.2 -0.1 Investment -3.5 -0.8 Government exp. 3.3 0.4 Inventory Inv. ---- -1.6 Exports 16.0 3.7 Imports 4.8 1.5
2011 – 2nd Half Change (%) Contribution (pp)
Consumption 5.6 3.8 Investment 10.4 2.1 Government exp. -0.3 0.0 Inventory Inv. ---- -0.9 Exports 8.4 2.0 Imports 0.6 -0.2
www.betam.bahcesehir.edu.tr
5
Box 1: Calculation of quarterly GDP growth andcontributions.
Sub-components of GDP are grouped into 3 cate-gories:
1. Final domestic demand consist of final consump-tion expenditure of resident households (Con-sumption), sum of government final consumption and investment expenditure (Government ex-penditure), investment expenditure of private sector (Investment)
2. Net foreign demand for goods and services rep-resents the difference between exports and imports of goods and services.
3. Change in inventories (stocks) shows how stocks changes with compared to previous quarter (for details look Box 2)
In order to find quarterly GDP growth, the following formulation is used for all sub components of GDP separately:
Since X represents 'Change in GDP component' Contribution of X to growth can be calculated as follows:
= (Xt – Xt-1) / GDPt-1
Differences between the methodologies used by Betam and TurkStat in seasonally adjusting the real GDP
Box 2: Change in inventories (stocks) and its contribution to growth
'Stock change' shows that how stocks change compared to previous period
Stock change t = Stock t – Stock t-1
Therefore increase (decrease) in inventories is caused by increase (decrease) in the difference between two period rather than increase (decrease) in stocks. However, TurkStat estimates the change in stocks is as residual between production and expenditure accounts. Moreover this sub-component also includes statistical discrepancy.
Let's say the difference between production and
expenditure account εt-1, 'stock change' in time t is as
follows:
Stock changet = Stock t – Stock t-1 + εt-1
Finally, contribution of change in 'Stock change' can be found as follows:
Contribution of 'Stock change t
= (Stock t – Stock t-1) / GDP t-1
or
Contribution of 'Stock change t
= ((Stock t – Stock t-1 + εt )