INVESTIGATION OF REAL GDP PER CAPITA CONVERGENCE
IN REGIONAL ECONOMIC INTEGRATIONS
Selin Erdoğan 113622001
ISTANBUL BİLGİ UNIVERSITY
A Dissertation Proposed in Partial Fulfillment of the Requirements for the Degree of Master of Science in Economics
Supervised by
Yrd. Doç. Dr. Fatma Didin Sönmez
Istanbul, Turkey April, 2016
ABSTRACT
The regionalism phenomenon has received a lot of interest from economics literature. On the one hand, some of the scholars argued that regional integration agreements are beneficial in leading trade creation effect, increased market size, increased investment by attracting foreign direct investment, reforms in domestic policy etc. On the other hand, some of the scholars took opposing position by pointing out potential results of trade diversion, less sovereignty, employment shift etc. This study aims to investigate whether being a member of regional economic integration agreement foster per-capita income convergence among the participant countries. 23 multilateral regional economic integration agreements (RIAs) which are notified to World Trade Organization (WTO) and more than 100 countries that joined to these agreements are studied. In order to examine the potential effect of regional integration agreements on per capita income convergence among member countries, the series of deviations of each country from regional integration agreement average are constructed out of real GDP per capita in 2005 USD figures, which are obtained from World Bank and United Nations Statistics Division. The period of study spans from the establishment year of RIA to 2013. Any change in membership status of the RIA considered is taken account by performing separate tests on the members of the RIA before and after the change. By applying first and second generation panel unit root tests on each deviation series from RIA average, the existence of convergence in country per capita income is judged and the following conclusions are reached: There is significant evidence in favor of convergence for Caribbean Community, Economic Cooperation Organization, Economic Community of West African States, European Free Trade Association, Gulf Cooperation Council, Central European Free Trade Agreement, Euroasian Economic Community, Latin American Integration Association, South African Development Community, and West African Economic and Monetary Union .
ÖZET
Bölgeselleşme olgusu ekonomi literatüründe oldukça ilgi çekmiştir. Bazı ekonomistler bir yandan bölgesel bütünleşme anlaşmalarının ticareti ve doğrudan yabancı yatırımları arttırıcı, pazar genişletici, yerel politikaları iyileştirici olumlu etkilerine işaret ederken bazı ekonomistler de öte yandan ticareti saptırıcı, istihdamı ve egemenliği azaltıcı gibi olumsuz sonuçları vurgulamaktadır. Bu çalışmanın amacı bölgesel ekonomik entegrasyon anlaşmalarının üye ülkeler arasında kişi başı gelir bazında bir yakınsamaya yol açıp açmadığını incelemektir. Diğer bir deyişle, “Bölgesel ekonomik işbirliği anlaşmalarına müdahil kişi başı milli gelir bazında başlangıçta görece fakir olan ülkeler aynı entegrasyon anlaşmasında yer alan zengin ülkelerin kişi başı milli gelirlerine yaklaşmış mıdır?” sorusuna yanıt aranmaktadır. Bu amaçla Dünya Ticaret Örgütü’ne (WTO) bildirilmiş 23 çok uluslu bölgesel ekonomik işbirliği anlaşması ve bu anlaşmalara dahil olan 100’den fazla ülkeye ait -2005 yılı sabit USD fiyatlarıyla- reel kişi başı milli gelir değerleri Dünya Bankası ve Birleşmiş Milletler İstatistik Bölümü’nden elde edilmiştir. Çalışma süresi bölgesel ekonomik işbirliği anlaşmasının kuruluş yılından 2013 yılına kadar olan süreyi kapsamaktadır. Ülkelerin bölgesel ekonomik işbirliği anlaşmasına üyelik durumu değiştiğinde bu durum değişimden önce ve değişimden sonra olmak üzere çalışmada göz önünde bulundurulmuştur. Bölgesel anlaşma içindeki her ülke kişi başı milli gelirinin bölgesel anlaşma ortalamalarından farkı alınarak fark serisi oluşturulmuş ve bu fark serisine uygun birinci ve ikinci nesil panel birim kök testleri uygulanarak şu sonuçlar elde edilmiştir: Yakınsamanın lehine anlamlı bulgular Karayip Topluluğu, Batı Afrika Devletleri Ekonomik Topluluğu, Körfez İşbirliği Konseyi, Orta Avrupa Serbest Ticaret Anlaşması, Avrupa Serbest Ticaret Birliği, Avrasya Ekonomik Topluluğu, Latin Amerika Entegrasyon Birliği, Güney Afrika Kalkınma Topluluğu, Ekonomik İşbirliği Organizasyonu ve Batı Afrika Ekonomik ve Parasal Birliği için bulunmuştur.
ACKNOWLEDGEMENTS
I owe my appreciation to all those people who have made this thesis possible. Among them, I would like to thank my research supervisors Dr. Fatma Didin Sönmez and Dr. Serda Selin Öztürk for their patience and great support. Special thanks goes to Dr. Thanasis Stengos who accepted to participate in my defense.
I am also grateful to Gizem Turna, and Deniz Nebioğlu Kasapoğlu for all help and motivation and, Sedef Şen for all contributions, Dr. Kazım Baycar, Ecem İnceoğlu, Özdemir Teke, and Alaaddin Tok for their useful comments and patience over the last year.
I would like to send a special thanks to TUBITAK BİDEB for financial support within the 2210 Graduate Scholarship Program.
Most importantly, none of this accomplishment would be possible without love, dedication and unfailing support of my husband Onur Erdoğan, and my parents Neslihan and Timur Altay to whom this thesis is dedicated.
Finally, I express my sincere thanks to those who directly and indirectly contributed to this work.
TABLE OF CONTENTS
TABLE OF CONTENTS ... IV LIST OF TABLES ... VI LIST OF FIGURES ... VIII LIST OF ABBREVIATIONS ... XI
1.INTRODUCTION ... 1
2. LITERATURE REVIEW ... 4
2.1. The Convergence Concept ... 4
2.1.1. Unconditional Convergence and Conditional Convergence ... 4
2.1.2 σ - Convergence ... 8
2.1.3. Time Series Approach to the Concept of Convergence ... 9
2.2. The Notion of Convergence in a Regional Integration Agreement Setting ... 11
2.2.1. Empirical Studies on Convergence within a Regional Integration ... 11
2.2.2. Panel Unit Root Approach to Convergence Concept within a Regional Integration ... 15
3. DATA and METHODOLOGY ... 18
3.1. Data ... 18
3.2. Methodology ... 19
3.2.1. First Generation Panel Unit Root Tests ... 20
3.2.1.1. Levin, Lin and Chu (2002) Panel Unit Root Test ... 21
3.2.1.2. Breitung (2000) Panel Unit Root Test ... 22
3.2.1.3 Harris and Tsavalis (1999) Panel Unit Root Test ... 23
3.2.1.4. Hadri (2000) LM Test ... 24
3.2.1.5. Im, Pesaran and Shin (2003) Panel Unit Root Test ... 25
3.2.1.6. Fisher ADF (Maddala and Wu, 1999) and Fisher Philips and Perron (Choi, 2001) Panel Unit Root Tests ... 26
3.2.2. Second Generation Panel Unit Root Tests ... 27
3.2.3 The Model for Testing ... 28
4. RESULTS ... 30
4.1. Graphical Examination ... 30
4.2. Cross-Sectional Dependence Test Results ... 30
4.3. First Generation Panel Unit Root Test Results ... 34
4.3.1 Test Results for Customs Union Agreements ... 34
4.3.1.1 Test Results for CARICOM2... 34
4.3.1.2 Test Results for CEMAC ... 37
4.3.1.3 Test Results for ECOWAS1 ... 39
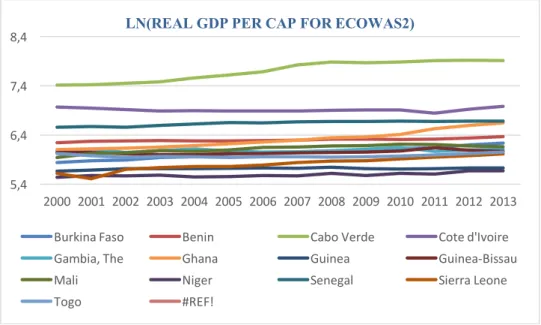
4.3.1.4 Test Results for ECOWAS2 ... 41
4.3.1.5 Test Results for EU1 ... 45
4.3.1.6. Test Results for EU3 ... 46
4.3.2. Test Results for Free Trade Agreements ... 49
4.3.2.1. Test Results for ASEAN1 ... 49
4.3.2.2. Test Results for ASEAN2 ... 51
4.3.2.3. Test Results for PAFTA... 53
4.3.3. Test Results for Partial Scope Agreements ... 56
4.3.3.1. Test Results for APTA ... 56
4.4.1. Test Results for Customs Union Agreements ... 58
4.4.1.1. Test Results for ANDEAN1 ... 58
4.4.1.2. Test Results for ANDEAN2 ... 59
4.4.1.3. Test Results for CACM ... 59
4.4.1.4. Test Results for CARICOM1... 60
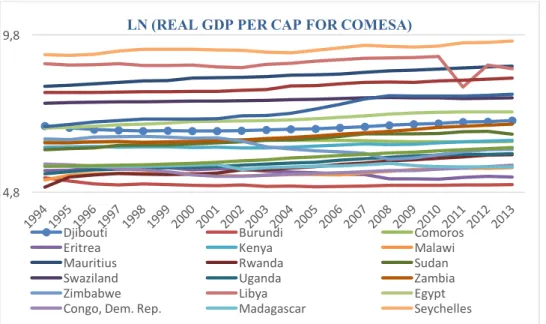
4.4.1.5. Test Results for COMESA... 61
4.4.1.6. Test Results for EAC ... 62
4.4.1.7. Test Results for EU2 ... 63
4.4.1.8. Test Results for EU4 ... 64
4.4.1.9. Test Results for GCC ... 64
4.4.1.10. Test Results for MERCOSUR ... 65
4.4.1.11. Test Results for SACU1... 66
4.4.1.12. Test Results for SACU2... 66
4.4.1.13. Test Results for WAEMU1 ... 67
4.4.1.14. Test Results for WAEMU2 ... 68
4.4.2. Test Results for Free Trade Agreements ... 70
4.4.2.1. Test Results for ASEAN3 ... 70
4.4.2.2. Test Results for CEFTA ... 70
4.4.2.3. Test Results for EAEC ... 71
4.4.2.4. Test Results for EFTA1 ... 72
4.4.2.5. Test Results for EFTA2 ... 73
4.4.2.6. Test Results for EFTA3 ... 74
4.4.2.7. Test Results for EFTA4 ... 75
4.4.2.9. Test Results for NAFTA ... 75
4.4.2.10. Test Results for PICTA ... 76
4.4.2.11. Test Results for SADC1... 77
4.4.2.12. Test Results for SADC2... 78
4.4.2.13. Test Results for SADC3... 79
4.4.3. Test Results for Partial Scope Agreements ... 79
4.4.3.1 Test Results for ECO1 ... 79
4.4.3.2 Test Results for ECO2 ... 80
4.4.3.3 Test Results for LAIA ... 81
4.4.4. Test Results for Regional Integration Agreements without Outlier Countries ... 82
4.4.4.1. Test Results for APTA without China ... 82
4.4.4.2 Test Results for ASEAN2 without Brunei Darussalam ... 83
4.4.4.3. Test Results for EU1 without Luxembourg ... 84
4.4.4.4. Test Results for EU3 without Luxembourg, Greece and Ireland ... 84
5. CONCLUSION ... 86
REFERENCES ... 89
LIST OF TABLES
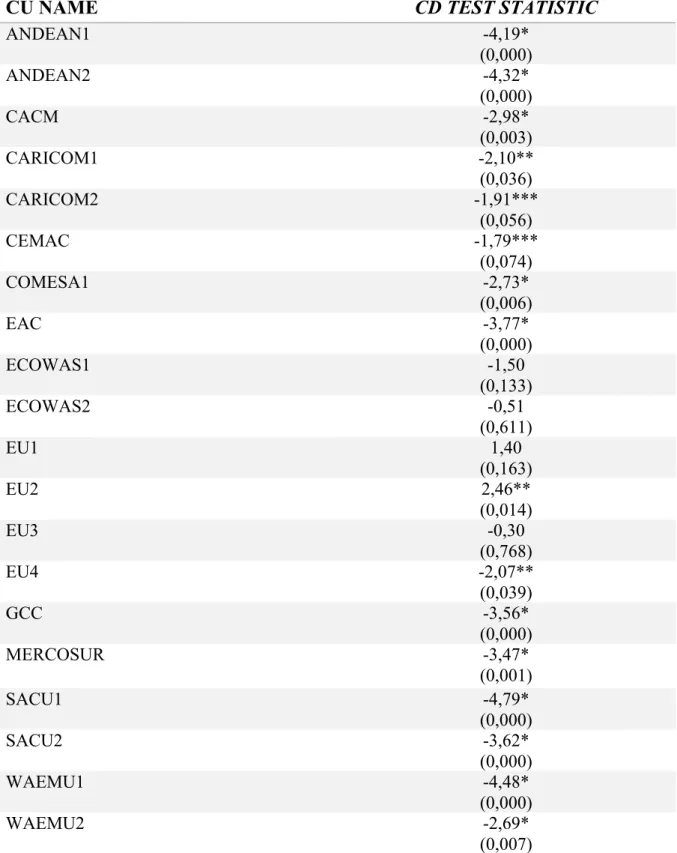
Table 1. Pesaran’s (2004) CD Test Results for Customs Unions
Table 2. Pesaran’s (2004) CD Test Results for Free Trade Agreements Table 3. Pesaran’s (2004) CD Test Results for Partial Scope Agreements Table 4. Panel Unit Root Test Results for Deviation Series of CARICOM2
Table 5. Panel Unit Root Test Results for Deviation Series of CARICOM2 without Trinidad
& Tobago and Antigua & Barbuda
Table 6. Panel Unit Root Test Results for Deviation Series of CEMAC Table 7. Panel Unit Root Test Results for Deviation Series of ECOWAS1 Table 8. Panel Unit Root Test Results for Deviation Series of ECOWAS2
Table 9. Panel Unit Root Test Results for Deviation Series of ECOWAS2 without Cabo Verde Table 10. Panel Unit Root Test Results for Deviation Series of EU1
Table 11. Panel Unit Root Test Results for Deviation Series of EU3 Table 12. Panel Unit Root Test Results for Deviation Series of ASEAN1
Table 13. Panel Unit Root Test Results for Deviation Series of ASEAN1 without Singapore Table 14. Panel Unit Root Test Results for Deviation Series of ASEAN2
Table 15. Panel Unit Root Test Results for Deviation Series of PAFTA
Table 16. Panel Unit Root Test Results for Deviation Series of PAFTA without United Arab
Emirates, Libya, Syrian Arab Republic, and Yemen
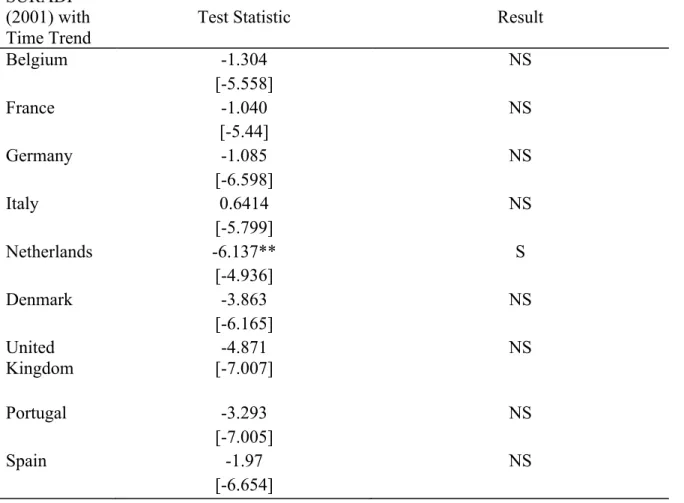
Table 17. Panel Unit Root Test Results for Deviation Series of APTA Table 18. SURADF (2001) Test Results for Deviation Series of ANDEAN1 Table 19. SURADF (2001) Test Results for Deviation Series of ANDEAN2 Table 20. SURADF (2001) Test Results for Deviation Series of CACM Table 21. SURADF (2001) Test Results for Deviation Series of CARICOM1 Table 22. PESCADF (2003) Test Results for Deviation Series of COMESA Table 23. SURADF (2001) Test Results for Deviation Series of EAC Table 24. SURADF (2001) Test Results for Deviation Series of EU2 Table 25. PESCADF (2003) Test Results for Deviation Series of EU4 Table 26. SURADF (2001) Test Results for Deviation Series of GCC
Table 27. PESCADF (2003) Test Results for Deviation Series of MERCOSUR Table 28. PESCADF (2003) Test Results for Deviation Series of SACU1
Table 29. SURADF (2001) Test Results for Deviation Series of SACU2 Table 30. SURADF (2001) Test Results for Deviation Series of WAEMU1 Table 31. SURADF (2001) Test Results for Deviation Series of WAEMU2 Table 32. SURADF (2001) Test Results for Deviation Series of ASEAN3 Table 33. SURADF (2001) Test Results for Deviation Series of CEFTA Table 34. SURADF (2001) Test Results for Deviation Series of EAEC Table 35. SURADF (2001) Test Results for Deviation Series of EFTA1 Table 36. SURADF (2001) Test Results for Deviation Series of EFTA2 Table 37. SURADF (2001) Test Results for Deviation Series of EFTA3 Table 38. SURADF (2001) Test Results for Deviation Series of EFTA4 Table 39. PESCADF (2003) Test Results for Deviation Series of NAFTA Table 40. PESCADF (2003) Test Results for Deviation Series of PICTA Table 41. SURADF (2001) Test Results for Deviation Series of SADC1 Table 42. SURADF (2001) Test Results for Deviation Series of SADC2 Table 43. PESCADF (2003) Test Results for Deviation Series of SADC3 Table 44. PESCADF (2003) Test Results for Deviation Series of ECO1 Table 45. SURADF (2001) Test Results for Deviation Series of ECO2 Table 46. SURADF (2001) Test Results for Deviation Series of LAIA
Table 47. SURADF (2001) Test Results for Deviation Series of APTA without China
Table 48. SURADF (2001) Test Results for Deviation Series of ASEAN2 without Brunei
Darussalam
Table 49. SURADF (2001) Test Results for Deviation Series of EU1 without Luxembourg Table 50. SURADF (2001) Test Results for Deviation Series of EU3 without Luxembourg,
LIST OF FIGURES
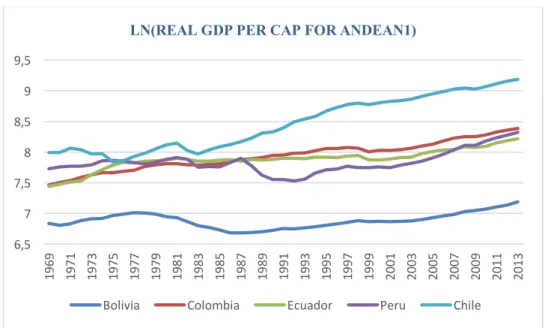
Figure 1. Evolution of natural logarithm (LN) of real GDP per capita in constant 2005 USD
for ANDEAN1 countries.
Figure 2. Evolution of natural logarithm (LN) of real GDP per capita in constant 2005 USD
for ANDEAN2 countries.
Figure 3. Evolution of natural logarithm (LN) of real GDP per capita in constant 2005 USD
for CARICOM1 countries.
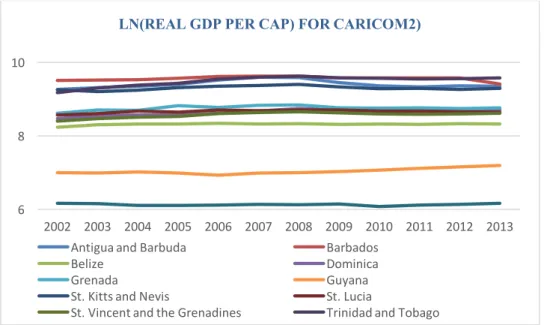
Figure 4. Evolution of natural logarithm (LN) of real GDP per capita in constant 2005 USD
for CARICOM2 countries.
Figure 5. Evolution of natural logarithm (LN) of real GDP per capita in constant 2005 USD
for CACM countries.
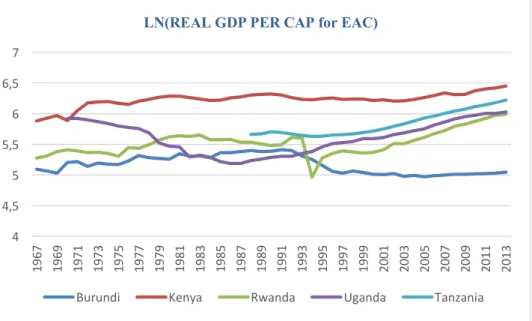
Figure 6. Evolution of natural logarithm (LN) of real GDP per capita in constant 2005 USD
for EAC countries.
Figure 7. Evolution of natural logarithm (LN) of real GDP per capita in constant 2005 USD
for COMESA countries.
Figure 8. Evolution of natural logarithm (LN) of real GDP per capita in constant 2005 USD
for CEMAC countries.
Figure 9. Evolution of natural logarithm (LN) of real GDP per capita in constant 2005 USD
for ECOWAS1 countries
Figure 10. Evolution of natural logarithm (LN) of real GDP per capita in constant 2005 USD
for ECOWAS2 countries
Figure 11. Evolution of natural logarithm (LN) of real GDP per capita in constant 2005 USD
for MERCOSUR countries.
Figure 12. Evolution of natural logarithm (LN) of real GDP per capita in constant 2005 USD
for WAEMU1 countries.
Figure 13. Evolution of natural logarithm (LN) of real GDP per capita in constant 2005 USD
for WAEMU2 countries.
Figure 14. Evolution of natural logarithm (LN) of real GDP per capita in constant 2005 USD
for SACU1 countries.
Figure 15. Evolution of natural logarithm (LN) of real GDP per capita in constant 2005 USD
Figure 16. Evolution of natural logarithm (LN) of real GDP per capita in constant 2005 USD
for GCC countries.
Figure 17. Evolution of natural logarithm (LN) of real GDP per capita in constant 2005 USD
for EU1 countries.
Figure 18. Evolution of natural logarithm (LN) of real GDP per capita in constant 2005 USD
for EU2 countries.
Figure 19. Evolution of natural logarithm (LN) of real GDP per capita in constant 2005 USD
for EU3 countries.
Figure 20. Evolution of natural logarithm (LN) of real GDP per capita in constant 2005 USD
for EU4 countries.
Figure 21. Evolution of natural logarithm (LN) of real GDP per capita in constant 2005 USD
for CEFTA countries.
Figure 22. Evolution of natural logarithm (LN) of real GDP per capita in constant 2005 USD
for EAEC countries.
Figure 23. Evolution of natural logarithm (LN) of real GDP per capita in constant 2005 USD
for NAFTA countries.
Figure 24. Evolution of natural logarithm (LN) of real GDP per capita in constant 2005 USD
for PICTA countries.
Figure 25. Evolution of natural logarithm (LN) of real GDP per capita in constant 2005 USD
for PAFTA countries.
Figure 26. Evolution of natural logarithm (LN) of real GDP per capita in constant 2005 USD
for ASEAN1 countries.
Figure 27. Evolution of natural logarithm (LN) of real GDP per capita in constant 2005 USD
for ASEAN2 countries.
Figure 28. Evolution of natural logarithm (LN) of real GDP per capita in constant 2005 USD
for ASEAN3 countries.
Figure 29. Evolution of natural logarithm (LN) of real GDP per capita in constant 2005 USD
for SADC1 countries.
Figure 30. Evolution of natural logarithm (LN) of real GDP per capita in constant 2005 USD
for SADC2 countries.
Figure 31. Evolution of natural logarithm (LN) of real GDP per capita in constant 2005 USD
for SADC3 countries.
Figure 32. Evolution of natural logarithm (LN) of real GDP per capita in constant 2005 USD
Figure 33. Evolution of natural logarithm (LN) of real GDP per capita in constant 2005 USD
for EFTA2 countries.
Figure 34. Evolution of natural logarithm (LN) of real GDP per capita in constant 2005 USD
for EFTA3 countries.
Figure 35. Evolution of natural logarithm (LN) of real GDP per capita in constant 2005 USD
for EFTA4 countries.
Figure 36. Evolution of natural logarithm (LN) of real GDP per capita in constant 2005 USD
for LAIA countries.
Figure 37. Evolution of natural logarithm (LN) of real GDP per capita in constant 2005 USD
for APTA countries.
Figure 38. Evolution of natural logarithm (LN) of real GDP per capita in constant 2005 USD
for ECO1 countries.
Figure 39. Evolution of natural logarithm (LN) of real GDP per capita in constant 2005 USD
LIST OF ABBREVIATIONS
ANDEAN: Customs Union comprising of South American countries of Bolivia, Colombia, Ecuador and Peru
APTA: Asia – Pacific Trade Agreement
ASEAN: Association of Southeast Asian Nations CACM: Central American Common Market
CARICOM: Caribbean Community and Common Market CEFTA: Central European Free Trade Agreement
CEMAC: Monetary and Economic Community of Central Africa COMESA: Common Market for Eastern and Southern Africa EAC: East African Community
EAEC: Eurasian Economic Community ECO: Economic Cooperation Organization
ECOWAS: Economic Community of West African States EFTA: European Free Trade Association
EU: European Union
GCC: Gulf Cooperation Council
LAIA: Latin American Integration Association MERCOSUR: Southern Common Market
NAFTA: North American Free Trade Agreement PAFTA: Pan – Arab Free Trade Agreement
PICTA: Pacific Island Countries Trade Agreements SACU: Southern African Customs Union
WAEMU: West African Economic and Monetary Union
LLC: Levin, Lin, Chu (2002) Panel Unit Root Test IPS: Im, Pesaran, Shin (2003) Panel Unit Root Test HT: Harris Tsavalis (1999) Panel Unit Root Test
SURADF: Seemingly Unrelated Augmented Dickey Fuller (2001) Panel Unit Root Test RIA: Regional Integration Agreement
FTA: Free Trade Agreement CU: Customs Union
PSA: Partial Scope Agreement WTO: World Trade Organization CET: Common External Tariff
1.INTRODUCTION
Since 1990s regional economic integration agreements have become more and more intensified across the world - from North America to Latin America, from Europe to Asia and in Africa. Not only a large number of developing countries are part of one or more than one agreements, but also most of developed countries are part of such agreements. Due to the prevalence of them, regional economic integrations between countries and their economic impacts have been receiving a lot of interest from various academics. Existence of convergence in per capita incomes of countries taking part in regional economic integration agreements is one of the most questioned subjects in economics literature. Not surprisingly, empirical evidence is conflicted. While some of the empirical studies find evidence for convergence: Ben David (1993), Karras (1997), Holmes (2005), Cuaresma, Grünwald, Silgoner (2008), Hammouda, Karingi, Njuguna, and Jallab (2009), Carmignani (2007); some of the empirical studies report the opposite: Karras (1997), Cuestas, Monfort, Ordóñez (2012), Slaughter (1998). Balassa (1961) identifies regional economic integration stages as Free Trade Agreements, Customs Unions, Common Markets, Economic Unions, and Total Integration. In this process, barriers to trade between countries diminishes and integration deepens from Free Trade Agreements to Total Integration. Free Trade Agreements abolish tariffs and quotas between participant countries, yet each participant impose their own tariff towards third party countries. Customs Unions impose common external tariff (CET) towards third party countries in addition to abolition of tariffs and quotas between members. Common Markets allow free movement of factors of production alongside the properties of customs unions. Economic Unions aim to synchronize economic policies (it mostly refers to monetary policy and fiscal policy) of joint countries besides the properties of common markets. Finally, Total Integration refers to the unification of monetary, fiscal and social policies between member countries.
In this study, existence of convergence in per capita incomes of participant countries in 23 regional economic integration agreements is evaluated via applying Panel Unit Root Test technique on the series of deviations of each country’s real GDP per capita in 2005 USD figures from regional integration agreement average. Based on Balassa’s (1961) typology of regional integration agreements, this paper dwells on WTO classification such that: Partial Scope Agreements, Free Trade Agreements and Customs Unions. First Generation Panel Unit Root Tests yield that convergence performances of Caribbean Community (CARICOM) for the period of 2002-2013 to which Haiti joined, and Economic Community of West African States (ECOWAS) for the period of 2000-2013, from which Mauritania left and Cabo Verde - which is the extreme country in terms of per capita income- was dropped were significant. Furthermore, Second Generation Panel Unit Root Tests lead that real GDP per capita series of the following countries do revert to RIA average Oman among Gulf Cooperation Council (GCC); Poland and Czech Republic among Central European Free Trade Agreement (CEFTA); Russia and Tajikistan among Euroasian Economic Community (EAEC); Denmark and United Kingdom among European Free Trade Agreement (EFTA) for the period of 1960-2013 before which Iceland joins and Denmark and UK leave; Austria among EFTA for the period of 1986-2013 during which Finland joins; Uruguay and Panama among Latin American Integration Association (LAIA); Malawi among South African Development Community (SADC) for the period of 1990-2013 during which Namibia joins; Turkey and Uzbekistan among Economic Cooperation Organization (ECO) for the period of 1992-2013 during which Afghanistan, Azerbaijan, Kazakhstan, Kyrgyz Republic, Pakistan, Tajikistan, Turkmenistan and Uzbekistan join; Guinea Bissau among West African Economic and Monetary Union for the period of 1997-2013 during which Mali and Guinea Bissau join.
In addition to the evaluation of real income per capita convergence among member countries in various multilateral regional integration agreements, regional integration
agreements in which divergence is found are re-analyzed by excluding the deviation series related to countries behaving extremely with respect to the rest over the period of study. These countries are: China in APTA; Cabo Verde in ECOWAS2; Luxembourg in EU1; Greece, Ireland and Luxembourg in EU3; Singapore in ASEAN1; Brunei Darussalam in ASEAN2; Trinidad & Tobago and Antigua & Barbuda in CARICOM2; and United Arab Emirates, Syrian Arab Republic, Libya and Yemen in PAFTA. The repetition of analysis by excluding outlier countries from the RIAs has led to the outcome that there is significant evidence in favor of convergence among ECOWAS2 member countries when Cabo Verde is not included, and among EU3 member countries when Greece, Ireland and Luxembourg are not considered.
This study aims to contribute to the literature in two ways. Firstly, it updates the information related to test of convergence hypothesis in regional integration agreement setting by panel unit root testing technique. Secondly, a wide range of panel unit root tests are considered and the most appropriate ones are employed in this study which is unique in terms of this property.
The remainder of this paper is organized as follows: The next section reviews the literature about concepts of convergence, and it is considered in a regional integration agreement setting in the same section. Data and Methodology is explained in Section 3. Main results and Conclusion are presented in Section 4 and Section 5, respectively.
2. LITERATURE REVIEW
2.1. The Convergence Concept
The concept of convergence is the central issue in this study. For this reason, it is important to have primary knowledge about initial classical studies and the ramifications which represent slightly different approach on it. In the following subsections, the initial understandings of convergence concept by scholars is firstly introduced, then alternative approaches to the concept is presented.
2.1.1. Unconditional Convergence and Conditional Convergence
The notion of unconditional (absolute) convergence is about faster growing of poor countries with respect to richer ones. In empirical literature, it is put forth in the form of the relationship between average income growth rate and initial income per capita regressions Baumol (1986), Kormendi and Meguire (1985), Barro and Sala-i-Martin (1992), Mankiw, Romer and Weil (1992), Sala-i-Martin (1996). Because the existence (or absence) of convergence is concluded based on the sign and significance of the coefficient of initial income per capita variable (β), the name β - convergence is coined to the literature. If β is estimated as significantly negative in average income growth rate – initial income per capita regression then existence of convergence is reached.
At this point, an important distinction between unconditional β - convergence and conditional β - convergence should be stated. It can be easily derived from Solow model. Assume a Cobb-Douglas labor augmenting production function at time t:
𝑌" = 𝐾" &(𝐴
(where Y represents output, K represents capital, L represents labor which is assumed to coincide with population, A represents technology roughly, α represents the capital share in total output and 0<α<1) Assuming that δ is the constant depreciation rate of physical capital, s is the saving rate which is a constant fraction of income in every period t, and n and g are the constant growth rates of population and technology respectively, the physical capital per effective worker is given by 𝑘 = .
/0 and the output per effective worker is given by 𝑦 = 2 /0 . Accordingly, physical capital per effective worker evolves as follows:
∆𝑘"= 𝑠𝑦"− (𝑛 + 𝑔 + 𝛿)𝑘" ∆𝑘"= 𝑠𝑘"& − (𝑛 + 𝑔 + 𝛿)𝑘
"
Steady-state value of physical capital per effective worker (k*) is given by:
𝑘∗ = [ 𝑠 𝑛 + 𝑔 + 𝛿]
+ +,&
It implies that steady-state value of physical capital per effective worker is positively affected by saving rate and negatively affected by population growth, depreciation and rate of technology growth.
Steady-state value of income per effective worker (y*) is given by:
𝑦∗ = 𝐴 =𝑒?"[ 𝑠 𝑛 + 𝑔 + 𝛿] & +,&
Steady-state value of income per effective worker is affected by saving rate, initial technology level, technology growth rate, population growth, depreciation rate and share of capital in output.
Based on the above theoretical specification, the difference between unconditional β - convergence and conditional β - convergence can be understood. Unconditional β - convergence implies all the variables that determine steady-state value of per capita income are the same for all countries considered. This implication feeds the average income growth rate – initial income per capita regression in terms of significant negative estimate of β even no other explanatory variable is controlled for. In contrast, conditional β - convergence implies that saving rate, , initial technology level, technology growth rate, population growth, depreciation rate and share of capital in output are country-specific variables so that addition of them are required as explanatory variables besides initial income variable in the right hand side of the regression. In this case if estimated β is significantly negative then the existence of conditional convergence is concluded. Mankiw et al. (1992) is the initial empirical study that is derived from above theoretical framework. In this influential study, using natural logarithm of per capita income between 1960-1985 the authors firstly test for unconditional convergence in a sample of non-oil countries, in another sample of excluding small countries (intermediate countries) and in another sample of OECD countries. According to the first test, the results confirm significant evidence for unconditional convergence for OECD countries whereas there is no significant evidence for unconditional convergence among the former two samples of countries.
Having the first results implied by unconditional convergence test, the results for the tests of conditional convergence is also reported in Mankiw et al. (1992). The addition of natural logarithm of investment to GDP ratio and natural logarithm of sum of population growth, technology growth and depreciation rate yield significant negative estimates of β which leads to the inference of existence of conditional convergence among three samples of
countries. In the final step, in addition to initial income per capita variable, natural logarithm of investment to GDP ratio and natural logarithm of sum of population growth, technology growth and depreciation rate, the human capital variable which is proxied by percentage of working age population that is enrolled in secondary school is included. The results of final regression produced significant negative estimates of β which again leads to the inference of existence of conditional convergence among three samples of countries.
The work of Barro and Sala-i-Martin (1992) is another leading formal study on convergence regression. In this study the specification for convergence regression is based on theoretical framework of Cass (1965) and Koopmans (1965)’ household utility maximization version of neoclassical growth model. Utilizing from growth rate of real GDP per capita of 98 countries between 1960-1985 as dependent variable and logarithm of 1960 per capita GDP as independent variable in addition to the variables of primary and secondary school enrollment rates in 1960, the average ratio of government consumption spending, except defense and education, to GDP between 1970-1985, some variables that reflects political instability and average deviation from unity of the Summers-Heston (1988) PPP ratio for investment in 1960, they report evidence in favor of conditional convergence.
The contribution by Kormendi and Meguire (1985) differs from the above empirical studies in that while they search the relationship between average growth rate and initial income they consider some more determinants. For example, average population growth rate, standard deviation of real output growth, the standard deviation of money supply shocks, average money supply growth, average growth of government spending to income ratio, average growth of exports to income ratio, and average growth rate of inflation. 47 countries between 1950-1977 is the interest of the study and it is found that growth of population and standard deviation of real output growth positively affect average growth rate whereas initial real income per capita
and monetary variance negatively affect it. Therefore, it can be said that Kormendi and Meguire (1985) confirms the suggestions of neoclassical growth theory.
While estimating parameter β in average growth rate – initial income regression had received a lot of interest from scholars, Evans (1997) takes a prudential approach. In this work, he showed that judgment of convergence in accordance to β is valid under, in his terms,
incredible conditions. Such conditions are: “the dynamical structures of the economies have
identical first-order autoregressive representations; every economy affects every other economy completely symmetrically; and the vector of variables control for all permanent cross-economy differences.” (Evans and Karras 1996b, p.1)
2.1.2 σ - Convergence
The concept of σ - convergence appear in the literature as follows: If the dispersion of real per capita income of countries decline over time then these countries are said to converge in σ sense. Sala-i-Martin (1996) puts this phenomenon with mathematical terms in a sensible way: Let σt be the standard deviation of logarithm of incomes across countries at time t, if
σt+T < σt
then the interested countries are said to converge. That is if the measured standard deviation of logarithm of per capita incomes of countries at time t is greater than the measured standard deviation of logarithm of per capita incomes of countries after T period passes.
Some researchers in the literature put themselves against Barro (1991) regression, that is: cross-section regression tests of convergence hypothesis and judging the existence (or non-existence) of convergence according to sign and significance of β. Quah (1993a) is one of them
income growth rate – initial income per capita regression. Similarly, in a communication paper Friedman (1992) points the possibility of misinterpretation of β from such a regression due to possibility of having measurement error in regressors. By developing an analogy between Galton’s Fallacy of regression and growth rate – initial income level regressions, Quah (1993a) shows that a negative β reflects, in fact, the nonexistence of convergence. In his words: “…Widely used initial level regressions… shed no light on convergence in the sense of notion of poorer countries eventually catching up with richer countries.” (Quah 1993a, p.4)
Martin (1996) disagrees with what Quah (1993a) puts. According to Sala-i-Martin (1996) both concepts of σ - convergence and β - convergence deserves empirical investigation. Moreover he asserts that although the concepts of σ - convergence and β - convergence are not the same, they are related and he formally derives this relationship in his work.
2.1.3. Time Series Approach to the Concept of Convergence
The relationship between usual β - convergence and time series approach can be summarized as:
The equation of interest is the standard Dickey-Fuller regression with drift term and a linear trend.
𝑦"= 𝜇 − 𝛽𝑔𝑡 + 1 + 𝛽 𝑦",+ + 𝜀"
(where yt and yt-1 represent income per capita at time t and t-1 respectively, µ is the systematic
change in one period to another, t is the linear trend, and ε is the iid error term.) In this context, in order to say that convergence exists (1+β) must be less than one: that is β has to be negative. In other words, one is interested in testing whether the null hypothesis of (1+β) is equal to one.
If the null hypothesis can not be rejected, then this implies β=0 can not be rejected. This conclusion in turn implies one can not reject the hypothesis that there is no convergence.
Quah (1990) and Evans and Karras (1996) are the initial studies that utilized from time series analysis to test the existence of convergence across countries. Quah (1990) analyzed income per capita deviations from US for 114 countries between 1970-1985. Islam (2003) “Noting both large N and T, Quah develops and applies inference theory appropriate for ‘random field data’ and rejects the null of unit root” Quah (cited in Islam 2003)1. Regarding to this study, it is also mentioned in Islam (2003) that by including no country-specific intercept the null hypothesis of no unit root is rejected that is the conclusion of evidence for nonexistence of unconditional convergence across the countries. Evans and Karras (1996a) criticizes Quah (1990) in that the alternative hypothesis of his work is absolute convergence by proposing an evidence that if convergence exists then it is conditional. In addition to that, Evans and Karras (1996b) views the weakness of standard Dickey-Fuller test because of its limited power and poor size properties, and uses a modified version of the unit root test proposed by Levin and Lin (1993) together with a pooled data of US states including state specific intercept term. They conclude evidence in favor of conditional convergence since they reject the null hypothesis of unit root. Similar results are obtained in another study of Evans and Karras (1996a). By applying unit root test analysis to pooled deviations from the average, the authors examined the existence of convergence across 54 countries between 1950-1990, and reported strong evidence for the rejection of null hypothesis of unit root implying existence of conditional convergence across countries, which is in line with predictions of neoclassical growth model and therefore in contrast to endogenous growth models.
Bernard and Durlauf (1995) considers the concept of convergence in a dynamic and stochastic environment. Their work examined annual logarithm of real per capita income of 15 OECD countries between 1900-1987 by means of multivariate tests for convergence and cointegration developed by Philips and Ouliaris (1988) and Johansen (1988), and reported rejection of convergence. Although not converging, it is found that there is cointegration across those OECD countries over the period of study implying that the existence of common long-run elements that jointly determine income growth of the economies considered.
2.2. The Notion of Convergence in a Regional Integration Agreement Setting
So far, a strand of literature on convergence across countries has been presented in order to give the reader some prior knowledge about the issue. In the following section, the literature on convergence concept in a regional integration agreement setting with various methodologies, and in the one after, the same literature with Panel Unit Root methodology, which is also the focus of current study will be introduced.
2.2.1. Empirical Studies on Convergence within a Regional Integration
To our knowledge, Ben David (1993) is the first study which points out that most of the convergence confirmed by several studies has existed in post-war period which is also the period of growing trade liberalization. In this study, European Economic Community (EEC) countries are examined in order to see the link between freer trade and income disparity. By utilizing from standard deviations of member countries’ incomes and then with the help of unit root test, the author indicates emphatic evidence for the convergence of incomes among EEC during postwar period.
The second contribution to this branch of literature is by Karras (1997). The investigation of this study covers three regional integration experiences: Association of
Southeast Asian Nations (ASEAN), European Union (EU), and Latin American Free Trade Area (LAFTA, then named as LAIA). The conventional regression fit of average growth rate-initial income per capita for each regional grouping reveals that unconditional β - convergence is nonexistent in ASEAN over 1960-1990 period, and unconditional β - convergence exists for EU over 1950-1990 and mildly for LAFTA over 1950-1990 Karras (1997). In addition to estimation of β in an average growth rate – initial income regression, cross country income variances for each regional groupings over the period of study are examined. This examination is consistent with the results from conventional regression fit. In other words, the cross-country income variance in ASEAN has increased while it has decreased in EU and LAFTA over the period of study Karras (1997). Carmignani (2007) provides similar results related to ASEAN and LAIA by using panel unit root methodology. In contrast to findings of Karras (1997) and Carmignani (2007) related to ASEAN, Ismail (2008) finds that there is evidence of convergence after expansion from five to ten members. However, the results from Ismail (2008) are consistent with those of Karras (1997) only before the expansion of ASEAN, that is : there is neither β - convergence nor σ - convergence among five initial member countries.
Related to Latin American regional integration experiences, specifically Latin American Integration Association (LAIA) and Central American Common Market (CACM), Holmes (2005) is another study that questions whether income convergence is achieved among joining countries. This study covers sixteen Latin American countries over the period of 1960-2000, and uses principal components and cointegration analysis. It reports that there exists strong long-run convergence among CACM member countries over the period of 1960-2000, yet existence of convergence among LAIA member countries can be pronounced weakly over the period of 1981-2000 Holmes (2005). Furthermore, the latter finding from Holmes (2005) is consistent with the finding from Karras (1997) and Carmignani (2007) that is convergence weakly exists for LAIA countries.
Cuaresma, Grünwald, Silgoner (2011) is one of the recent studies focuses on the European Union experience, and it reports not only poor countries’ catching up with rich ones since 1960s but also growth enhancing effect of duration of membership in EU. The former finding of Cuaresma et al. (2011) corroborates the findings of Karras (1997) related to EU.
Cuestas, Monfort, Ordóñez (2012) is the next recent study related to EU. Unlike Karras (1997) and Cuaresma et al. (2008), Cuestas et al. (2012) asserts the existence of club convergence in EU, which is equivalent to income divergence. According to this study, there are two convergence clubs that have their own steady states. The first convergence club includes all Eastern European countries and Greece whereas Western countries minus Greece constitutes the second convergence club. Moreover, the cluster analysis yields the result of existence of two convergence clubs in Eastern European countries. The main factor which determines these clubs is whether or not belonging to euro zone Cuestas et al. (2012).
Venables (1999) is the next study, which considers the relationship between regional integration agreements and income convergence among member countries in a much broader view. The implications from this study are: Free Trade Agreements (FTAs) tend to lead to divergence if it is between low-income countries whereas they tend to lead to convergence if it is between high-income countries. Moreover, the results suggest that north-south FTAs are much better than south-south FTAs for developing countries because joining to an FTA that is between north-south countries is instrumental in increasing the possibility of convergence with high-income member countries in that FTA. The example RIAs for the above conclusion are also provided in the study, such that EU is an RIA between high and low-income countries and it seems that they experienced convergence. More specifically; Ireland, Spain and Portugal were stated to make a significant performance in closing the gap with high-income members of EU. The RIAs that were stated to experience divergence are East African Common Market (EAC), Central American Common Market (CACM) and the Economic Community of West
African States (ECOWAS). EAC is an interesting example among three RIAs and its story has an important connection with the main argument of this article. Uganda and Tanzania claimed that Kenya having all the benefits of East African Common Market since Kenya has become the major producer and exporter of the manufactures to two comparatively less developed partners. Not surprisingly, the common market collapsed in 1977. Based on this event and the fact that Kenya is the country whose comparative advantage is much closer to the world average among the other member countries, Venables (1999)2 argues that: “…countries with comparative advantage closer to the world average do better in an FTA than do countries with more extreme comparative advantage.” (Venables 1999, p.8)
The study of Hammouda, Karingi, Njuguna, and Jallab (2009) is the first study such that it is very much comprehensive in African experience of regional integration. Southern African Development Community (SADC), Common Market for Eastern and Southern Africa (COMESA), the Economic Community of West African States (ECOWAS), the Central African Monetary and Economic Community (CEMAC), and the West African Economic and Monetary Union (WAEMU or French abbreviation: UEMOA,) are the regional integration agreements considered in this work. For SADC, COMESA and the ECOWAS, the panel estimation of β indicates some evidence of income convergence while the β is not estimated for CEMAC and WAEMU due to lack of data. Besides, income disparity among member countries in each RIA, which is calculated as income deviation of each country from the RIA mean, implies that countries in SADC, COMESA and ECOWAS are not converging; that is income disparity among member countries are increasing over the period of study Hammouda et al. (2009). The finding of existence of convergence in β sense yet non-existence of it in σ
sense is consistent with theoretical expressions or is at least empirical justification of them that are in the work of Sala-i-Martin (1996). For CEMAC the calculated income disparity is decreasing while remaining quite high during the period study, and for WAEMU the income dispersion implies a strong propensity for income convergence Hammouda et al. (2009).
Slaughter (1998) is an exceptional study in the above ones and it provides contrary evidence that there is no link between trade liberalization and convergence. This study examines four trade liberalizations in the post-war period, specifically European Economic Community (EEC), European Free Trade Area (EFTA), liberalization between EEC and EFTA, and Kennedy Round of General Agreement on Tariffs and Trade (GATT). The difference in difference estimations methodology yields the conclusion that the only effect of trade liberalization is the income divergence among the liberalizers not the convergence Slaughter (1998).
2.2.2. Panel Unit Root Approach to Convergence Concept within a Regional Integration
There are several studies which investigated convergence hypothesis in a stochastic framework (Bernard and Durlauf (1995); Evans (1996); Evans and Karras (1996a); Evans and Karras (1996b); Hall, Robertson and Wickens (1997); Evans (1998); Montuenga – Gomez (2002)). Following the definition of convergence in such a framework Carmignani (2007); Guetat and Serranito (2007); and Charles, Darné and Hoarau (2012) applies panel unit root methodology in order to investigate the link between regional integration agreements and convergence hypothesis.
The alternative definition in Bernard and Durlauf (1995) establishes convergence in output as follows:
Given existing information, countries p=1…n converge if the long-term output expectations for all countries are the same at a fixed time t:
lim
H→J𝐸 𝑦+,"MH− 𝑦N,"MH Ω" = 0 ∀𝑝 ≠ 1
This definition requires testing whether 𝑦+,"MH− 𝑦N,"MH is a mean zero stationary process. The judgment of conditional convergence is done accordingly.
In this context, Evans and Karras (1996) and Evans (1998) proposed a new test which depends on panel unit root methodology in order to test for convergence hypothesis. Conditional convergence implies each economy converges to its own steady state, any deviation from steady state is transient. However, if deviations from steady state is persistent then economies are said to diverge. In view of Evans and Karras (1996) and Evans (1998), this requires the deviations of each economy from cross-country mean of 𝑦" to tend to constant values as k tends to infinity.
lim
H→J𝐸" 𝑦+,"MH − 𝑦N,"MH = 𝜇N
(where 𝜇N is the level of p’s economy parallel growth path) If (𝑦N,"MH− 𝑦"MH) are stationary then the above equation holds. Unconditional convergence is concluded if 𝜇N = 0 ∀𝑝 while 𝜇N ≠ 0 for some p implies conditional convergence that is each economy converges to its own parallel growth path. This argument is equivalent to test whether the value of parameter ρ is equal to zero in the following equation (Evans (1998), Evans and Karras (1996)):
∆ 𝑦N," − 𝑦" = 𝜇N+ 𝜌N 𝑦N,",+− 𝑦",+ + 𝜑NHΔ 𝑦N,",H− 𝑦",H + 𝑢N," .
HV+
(where p=1,…n and t=1,…T and up,t is assumed to be uncorrelated across economies and 𝜇N is the country specific fixed effect for country p.) If 𝜌N< 0 then 𝑦N,"− 𝑦" will be stationary and it will be nonstationary if 𝜌N=0. In stationarity case 𝑦N," reverts to a common trend which is stated to be well measured by 𝑦" Evans (1998).
Carmignani (2007) is a noteworthy advocate of above approach in examining the relationship between regional economic integration and income convergence. The examination covers twenty-eight regional integration initiatives and the period of study is determined according to the date of establishment of each regional integration agreement. By employing panel unit root tests proposed by Levin, Lin, and Chu (2002) and Im, Pesaran and Shin (2003) the following findings are reached: There is no conditional convergence among regional integration agreements of ANDEAN, ASEAN CEMAC, CIS, COMESA (before Swaziland joins), EAEC, LAIA, EEA, EU10, and EU12. In contrast, evidence is in favor of the following regional integration agreements: CACM, CARICOM, CBI, CEFTA, COMESA (after Swaziland joins), ECOWAS, MERCOSUR, SACU, SADC1, SADC2, WAEMU, UMA, APEC1, APEC2, NAFTA, EU15 Carmignani (2007).
The work by Charles, Darné and Hoarau (2012) is another contribution to this strand of literature. This study is specific to COMESA countries. Similar to Carmignani (2007), by utilizing from panel unit root testing techniques, no evidence was reported for the period of 1950-2003. The further application of economic development criterion reveals that there were two absolute convergence clubs among COMESA, that is one for the more developed countries and the other for the rest of less developed ones.
3. DATA and METHODOLOGY
3.1. Data
The data consists of GDP per capita figures in constant 2005 USD and it covers 23 regional integration agreements (RIAs) that are notified to World Trade Organization (WTO), and it is related to more than 100 countries that are involved in these agreements. Out of 23 regional integration agreements, 12 of them are customs unions (CUs), 8 of them are Free Trade Agreements (FTAs) and 3 of them are Partial Scope Agreements (PSAs). This classification is based on the definition by World Trade Organization and the study covers only multilateral regional integration agreements not the bilateral ones. Therefore, trade agreements between two countries are out of scope of this study.
The main source of data is the World Development Indicators of the World Bank, that keeps track of development indicators collected from officially recognized international sources. The United Nations Statistics Division is also utilized when encountered with missing data over the period of study.
In this study sample period spans from the founding year of each regional integration agreement to 2013. Following Carmignani (2007); when membership of an RIA changes over time, the tests are separately performed on the members of the RIA before and after the change. For example, Economic Cooperation Organization (ECO) was founded in 1985 by Iran, Pakistan and Turkey. In 1992; Afghanistan, Azerbaijan, Kazakhstan, Kyrgyz Republic, Tajikistan, Turkmenistan and Uzbekistan joined to ECO. Consequently, there are two sample periods considered for ECO: ECO-1 is for the period of 1985-2013 with initial countries and
ECO-2 is for period of 1992-2013 with initial countries plus new-joiners. Therefore, the
numbers after the abbreviations of regional integration agreements’ names stand for the changes in the membership of the RIA considered, sample period and member countries change
accordingly3. Furthermore, the RIAs that are held after 2004 is out of scope of this study, since this would be too short period of time to investigate convergence dynamics between countries.
3.2. Methodology
In previous sections the researches studying income per capita convergence in the context of regional integration agreements were presented. These researches in fact any research studying convergence hypothesis have many options in terms of methodology, and the results from different studies employing different methods are mostly inconclusive. In this study, following Carmignani (2007) panel unit root test methods employed in order to examine convergence dynamics among countries after they join to a regional integration agreement. By panel unit root method we will benefit from both time and cross-section dimension of data in testing and avoid poor size and power properties of time series unit root testing that are previously pointed by some studies4. In addition to avoidance of drawbacks of time series unit root testing, we will utilize from several types of unit root testing in a panel setting.
The first step in panel unit root testing is to determine whether the series of interest is cross-sectional dependent or not. Pesaran’s (2004) cross-sectional dependence (CD) test helps to determine cross-sectional dependence5. If the series is concluded to be cross-sectional
independent, then first generation panel unit root tests will be applicable. On the contrary, if the series is found to be cross-sectional dependent, then second generation panel unit root tests will be appropriate. First generation tests include Levin, Lin and Chu (2002); Im, Pesaran and Shin
3 See Part B in Appendix for a detailed information about membership in RIAs and period of
study.
4 Time series unit root testing is criticized because of power and size properties by Schwert
(1989), Agiakloghou and Newbold (1992), DeJong, Nankervis, Savin and Whiteman(1992a,1992b).
5 For a detailed information about Pesaran (2004) CD test: Pesaran, M.H. (2004) “General
(2003); Harris, Tzavalis (1999); Hadri (2000); Choi (2001) and Maddala and Wu (1999). Although it seems many, there are some key differences between these tests, and depending on the relative lengths of cross-section dimension and time dimension the choice of the test changes. Second Generation tests include Choi (2002); Philips and Sul (2002); Bai and Ng (2004); Moon and Perron (2004); Pesaran (2007) and SURADF test by Breuer, McNown, and Wallace (2001). Hence in this study while we proceed in panel unit root application, we will consider cross-sectional dependence (and independence) of the series and then based on the relative cross-section and time dimensions of each regional integration agreement group, we will choose the most appropriate test. Therefore, the contribution of this study to this branch of literature is two-fold. First, it provides recent information related to test of convergence hypothesis in the context of regional integration agreement by means of panel unit root testing. Second, a wide range of panel unit root tests are considered and employed in this study which is unique in terms of this property.
3.2.1. First Generation Panel Unit Root Tests
If a series is concluded to be cross-sectional independent based on the result of Pesaran’s (2004) CD test, then first generation panel unit root tests should be employed. Some of the first generation panel unit tests assume a common autoregressive parameter for all panels. Depending on this assumption first generation panel unit root tests can be classified in two groups: The first group of tests, which assume a common autoregressive parameter, are Levin, Lin and Chu (2002), Breitung (2000), Harris and Tsavalis (1999), and Hadri (2000). On the contrary, the second group of tests do not make an assumption of a common autoregressive parameter across panels. These include Im, Pesaran and Shin (2003), Fisher ADF (Maddala and Wu, 1999) and Fisher Philips and Perron (Choi, 2001). In the following subsections a brief
introduction about first generation unit root tests and key differences between them will be presented.6
3.2.1.1. Levin, Lin and Chu (2002) Panel Unit Root Test
Levin, Lin and Chu (LLC hereafter) (2002) assumes a common autoregressive parameter across panels. The model for LLC (2002) is as follows:
ΔYXY = ρYX,Y,++ αZXdZY+ ]\V+θX\∆YX,Y,\+ εXY m=1,2,3
(where dmt represents the vector of deterministic variables.) One is interested in testing the null hypothesis of each individual time series contains a unit root against the alternative that each time series is stationary. This is equivalent to the formulation of hypotheses of LLC (2002) as follows:
H0: ρi = ρ = 0
H1: ρi = ρ < 0
LLC (2002) calculates the adjusted t-statistic, which is shown to have normal distribution by means of Monte Carlo simulations:
tρ∗ =
tρ− NTSbσε,cσ(ρ)μZd∗ σZd∗
The conventional t-statistic, which has a standard normal distribution, is computed as:
6 The information related to the tests presented here is for the justification of use of them case
𝑡e = 𝜌 𝜎(𝜌)
LLC (2002) suggested the use of this test on panels of size with N between 10 and 250 and T between 25 and 250. Furthermore, LLC test without deterministic variables, which are panel specific intercepts or time trends, requires asymptotically 𝑁 𝑇 ⟶ 0, which is equivalent to say that time dimension of data set grows more slowly than the cross-sectional dimension. LLC (2002) remind that this is appropriate in datasets of microeconomic applications. If the model is supposed to have deterministic variables, then this requires asymptotically 𝑁 𝑇 → 0 in order adjusted t-statistic 𝑡e∗ to have standard normal distribution. This is equivalent to say that time dimension grows faster than the cross-sectional dimension. LLC (2002) state the last situation as more appropriate for datasets in macroeconomic applications. In the former case, LLC (2002) suggest using the conventional t-statistic whereas they suggest using the adjusted t-statistic for the latter case.
3.2.1.2. Breitung (2000) Panel Unit Root Test
The testing procedure of Breitung (2000) panel unit root test is similar to LLC (2002) except that not only deterministic term is not included but also that the data is adjusted before regression is fitted so that bias adjustment, which is claimed LLC’s adjusted t-statistic suffer from low power by Breitung (2000). Firstly, ΔYit is regressed on ΔYi,t-j (j=1,...,p) and residuals
are obtained: 𝑒j". Then, Yi,t-1 is runned on ΔYi,t-j (j=1,...,p) and residuals are obtained: 𝑣j,",+. These residuals are adjusted (like LLC) in order to correct for differences in variances across i such that:
𝑒j" = 𝑒j"
𝜎mn and 𝑣j" = 𝑣j,",+ 𝜎m
Thirdly, forward orthogonalization transformation is applied to the residuals such that obtain 𝑢j"∗. Finally, the following pooled regression is runned and test statistic is obtained, which has standard N(0,1) distribution in the limit. Asymptotically, it is required that T → ∞ followed by N → ∞.
𝑒j"∗ = 𝜌𝑣
j,",+∗ + 𝜀j"∗
Similar to LLC (2002), in Breitung (2000) test, one is interested in testing the null hypothesis of each individual time series contains a unit root against the alternative that each time series is stationary. This is equivalent to the formulation of hypotheses of Breitung (2000) as follows:
H0: ρi = ρ = 0
H1: ρi = ρ < 0 3.2.1.3 Harris and Tsavalis (1999) Panel Unit Root Test
Harris and Tsavalis (HT hereafter) (1999) showed that the assumption of time dimension tends to infinity much faster than cross-sectional dimension does leads to undersized and low power tests. Therefore, this test is designed for the situation that time dimension of panel data is small relatively to cross-section dimension. A common autoregressive parameter (like LLC and Breitung) is also assumed in this test.
The HT (1999) test statistic is derived from the following regression model:
(where dmt represents the vector of deterministic variables.) In HT (1999), it is assumed that disturbance term is independent and identically distributed (i.i.d.) and normal with homoscedastic variance across panels.
Similar to LLC (2002) and Breitung (2000), HT (1999) tests the null hypothesis of the null hypothesis of each individual time series contains a unit root against the alternative that each time series is stationary. Note that the test uses Yit instead of ΔYit, consequently this is
equivalent to the formulation of null hypothesis of HT (1999) as follows:
H0: ρi = ρ = 1 3.2.1.4. Hadri (2000) LM Test
Hadri (2000) LM Test differs from the previously discussed tests in its formulation of null and alternative hypotheses. In this test, one is interested in testing the null hypothesis of no unit root in any of the series in the panel against the alternative hypothesis that at least one panel contains unit root. Asymptotically, Hadri (2000) LM test requires T → ∞ followed by N → ∞.
The following two regression models are considered in Hadri (2000) test:
𝑌j" = 𝑟j"+ 𝜀j" i=1... N; t=1,…,T 𝑌j" = 𝑟j"+ 𝛽j𝑡 + 𝑢j" i=1...N; t=1,…,T
(where 𝑟j" = 𝑟j,",++ 𝑢j" is a random walk process. 𝜀j" and 𝑢j" are zero mean i.i.d. normally distributed errors: 𝜀j"~ 𝐼𝐼𝑁(0, 𝜎mc) and 𝑢
j"~ 𝐼𝐼𝑁 0, 𝜎tc ) If the variance of 𝑢j" were equal to zero, then 𝑟j" would be equal to a constant. This would imply that Yit were trend
stationary. Based on this argument, the null and alternative hypotheses of Hadri (2000) LM test can be stated as follows:
H0: 𝜆 =vw x
vyx = 0
H1: 𝜆 > 0
3.2.1.5. Im, Pesaran and Shin (2003) Panel Unit Root Test
Im, Pesaran and Shin (IPS hereafter) (2003) is one of first generation panel unit root tests which relaxes the assumption of common autoregressive parameter across panels. This test not only abandons common autoregressive parameters assumption, but it is also applicable to unbalanced panel data sets yet there can not be gaps within a panel.
IPS (2003) suggest a standardized t-bar test statistic which is produced from averaging Augmented Dickey-Fuller statistics across panels. Similar to LLC (2002), the regression model is as follows:
ΔYXY = 𝜌jYX,Y,++ αZXdZY+ ]\V+θX\∆YX,Y,\+ εXY m=1,2,3
In contrast to LLC (2002), 𝜌j is allowed to vary across panels. The null hypothesis is that each series in the panels contains unit root, and the alternative hypothesis is that some (but not all) of the individual series have unit root. Therefore, the hypotheses of IPS (2003) can be expressed as:
H0: ρi = 0 for all i
𝐻+: 𝜌𝜌j < 0 𝑓𝑜𝑟 𝑖 = 1,2, … , 𝑁+ j = 0 𝑓𝑜𝑟 𝑖 = 𝑁++ 1, … , 𝑁
The test statistic of IPS (2003) is defined as t-bar which is appropriate when cross-section and time dimensions are fixed. It is formulated as:
𝑡 = 1 𝑁 𝑡en
ƒ
jV!
3.2.1.6. Fisher ADF (Maddala and Wu, 1999) and Fisher Philips and Perron (Choi, 2001) Panel Unit Root Tests
Fisher type panel unit root tests combine p-values instead of t-statistics from separate unit root tests performed on each panel. Like IPS (2003), Fisher type panel unit root tests relax the assumption of common autoregressive parameter. The null hypothesis of Fisher type tests is that all panels contain a unit root. For a finite number of panels, the alternative hypothesis is given by at least one panel is stationary. Maddala and Wu (1999) and Choi (2001) proposed Fisher type test denoting pi as the p-value from the relevant test on ith panel. For a finite number
of panels as Ti → ∞, P statistic which is distributed by 𝒳c with 2N degrees of freedom is given
by:
𝑃 = −2 ln (𝑝j) ƒ
jV!
Other test statistics are suitable when number of panels are finite or infinite:
𝑍 = 1 𝑁 Φ ,+(𝑝 j ƒ jV+ )
(where Φ,+(. ) is the inverse standard normal cumulative distribution function.) Z-statistic is normally distributed with zero mean and variance of unity.
𝐿 = ln ( 𝑝j 1 − 𝑝j) ƒ
jV+
(where ln ( Nn
+,Nn) has logistic distribution with zero mean and variance of
ˆx ‰) Finally, 𝑃Š = − 1 𝑁 ln 𝑝j + 1 ƒ jV+
(where Pm is normally distributed with zero mean and variance of unity.)
3.2.2. Second Generation Panel Unit Root Tests
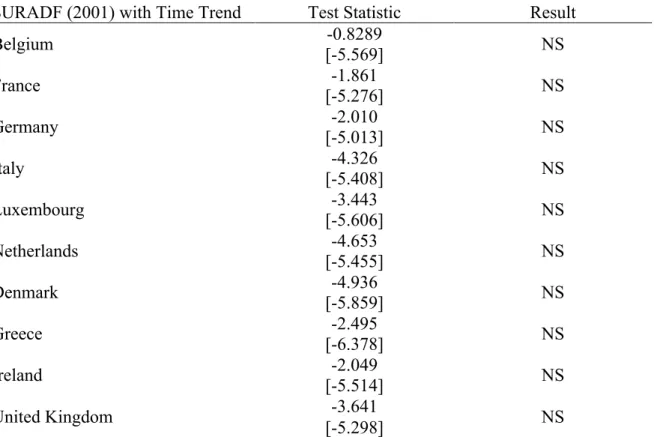
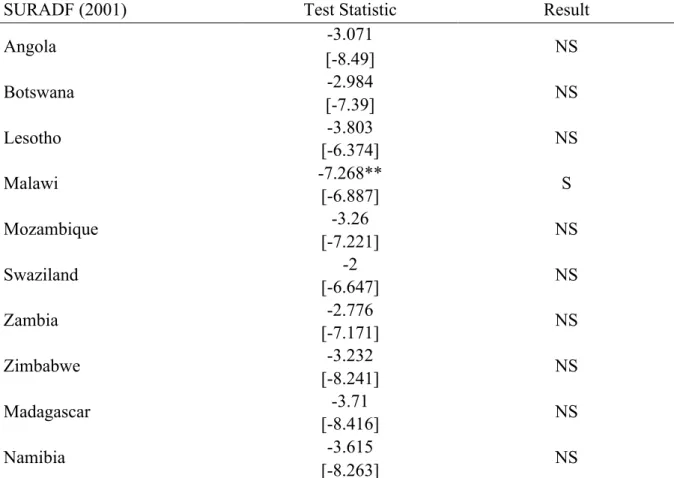
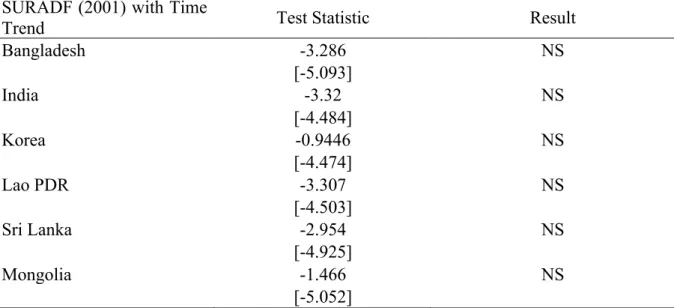
If a series is concluded to be cross-sectional dependent based on the result of Pesaran’s (2004) CD test, then second generation panel unit root tests should be employed. In this study, “seemingly unrelated regressions augmented Dickey-Fuller (SURADF hereafter)” panel unit root (second generation) test proposed by Breuer, McNown, and Wallace (2001) is primarily employed because of the following properties special to this test. First of all, SURADF (2001) test allows us to conclude which series is (or are) nonstationary specifically. This is done by testing separate null hypothesis of unit root against the alternative of stationarity for each panel member. Secondly, seemingly unrelated regression estimation is superior to single equation Dickey-Fuller tests due to that it accounts for the contemporaneous cross-correlation of error terms. Thirdly, like second type of first generation tests, SURADF test allows autoregressive coefficient to vary across panels.
The system of augmented Dickey-Fuller regressions to be estimated by seemingly unrelated regressions is given by:
∆𝑌+,"= 𝛼++ 𝜌+− 1 𝑌+,",++ 𝛿j∆𝑌+,",j+ 𝑢+," jV+ ∆𝑌c," = 𝛼c+ 𝜌c− 1 𝑌c,",++ 𝛿j∆𝑌c,",j+ 𝑢c," jV+ … ∆𝑌ƒ," = 𝛼ƒ+ 𝜌ƒ− 1 𝑌ƒ,",++ 𝛿j∆𝑌ƒ,",j + 𝑢ƒ," jV+
In the above system of equations 𝜌j stands for the autoregressive coefficient for ith series and it will be estimated by seemingly unrelated regression method. Then, the significance of (𝜌j − 1) will be tested through simulated critical values.
In addition to SURADF second generation panel unit root test proposed by Breuer, McNown, and Wallace (2001), Pesaran’s CADF (2003) second generation panel unit root test is employed in the cases where the country deviation series is cross-sectional dependent but the data matrix is not positive definite. Whenever the data matrix is not positive definite, SURADF (2001) test becomes inapplicable.
3.2.3 The Model for Testing
In order to examine convergence hypothesis in regional integration agreements, appropriate panel unit root tests are applied to the series of real GDP per capita deviations from regional integration agreement average following Carmignani (2007)7. Specifically, by letting natural logarithm of real GDP per capita in country i at some time t (let Yit represent this series)
7 Carmignani, F. (2007), “A Note on Income Convergence Effects in Regional Integration
Agreements”, Economics Letters, 94: 361-366. Convergence is defined as a situation where the series of deviations from regional integration agreement average evolves into a stationary process.