ISTANBUL BİLGİ UNIVERSITY INSTITUTE OF SOCIAL SCIENCES
INTERNATIONAL FINANCE MASTER’S DEGREE PROGRAM
AS A DIVIDEND YIELD INVESTMENT STRATEGY “DOGS OF DOW” IN ISTANBUL STOCK MARKET
Adnan YEREBAKAN 113665006
Prof. Dr. Cenktan Özyıldırım
İSTANBUL 2019
iii
ACKNOWLEDGEMENTS
I would like to present my special thanks to my dissertation advisor Prof. Dr. Cenktan Özyıldırım for all his support giving me strength during the research and his guidance. Also, I would like to express my thanks to Deniz İkizerli.
iv TABLE OF CONTENTS Page ACKNOWLEDEGMENTS………...iii ABBREVIATIONS………..vi LIST OF FIGURES……….vii
LIST OF TABLES………. viii
ABSTRACT………..ix
ÖZET……….x
1. INTRODUCTION ... 1
1.2 Brief About Borsa Istanbul (BIST)………...………….3
2. LITERATURE REVIEW………... 5
2.1 EFFICIENT MARKET HYPOTHESIS………....5
2.1.1. Forms of the Efficient Market Hypothesis ……... 6
2.1.2. Implications of the EMH……….. ….………...8
2.1.2.1. Technical Analysis….……….…...8
2.1.2.2. Fundamental Analysis... ….………... 9
2.1.2.3. Active versus Passive Portfolio………10
2.2 HOW TO INVEST BASED ON DIVIDEND YIELD STRATEGY………..…11
2.2.1. Dividend Irrelevance………...12
2.2.2. Dividend Relevance…..………...12
2.2.3. Strategies Derived from Dividend Yield Ratios……….…………....13
2.2.4. Dogs of Dow (DoD).………..14
2.2.5 Prior Researches on DoD…….………...16
v
2.3.1. Noise Trading……….….………22
2.4. EXAMPLES FOR CAUSE OF IRRATIONAL BEHAVIORS……….23
2.4.1. Over Confidence……….…….23
2.4.2. Representative Heuristic……….……….…23
2.4.3. Illusion of Control………..………..23
2.4.4. The Underreaction Effect……….………...24
3. DATA AND METHODOLOGY... 25
3.1 DATASET OF THE THESIS CONTENT………...………..26
3.2 HOW TO BUILD DOD PORTFOLIO………...………26
3.3. PORTFOLIO RETURN…...…………..………27 3.4. RISK ADJUSTMENTS……….29 3.4.1. Transaction Costs………...……….31 3.4.2. Taxes……...…...……….31 3.5 STATISTICAL TESTING……….32 4. RESULTS ... 33
4.1. TOP10 CONSTITUENTS YEAR BY YEAR ... 33
4.2. PORTFOLIO PERFORMANCE ... 36
4.3. RISK ADJUSTMENTS………37
4.3.1. Statistical Testing………..38
The Dow Dogs In Market Recession ... 37
5. CONCLUSIONS ... 40
vi
ABBREVIATIONS
BIST : Borsa İstanbul DoD : Dogs of Daw
EHM : Efficient Market Hypothesis ISE : Istanbul Stock Exchange P/E : Price to Earnings Ratio
vii
LIST OF FIGURES
Figure 4.1. The returns have been calculated using buy and hold returns of the market (BIST) and the TOP10 portfolio………... 37
viii
LIST OF TABLES
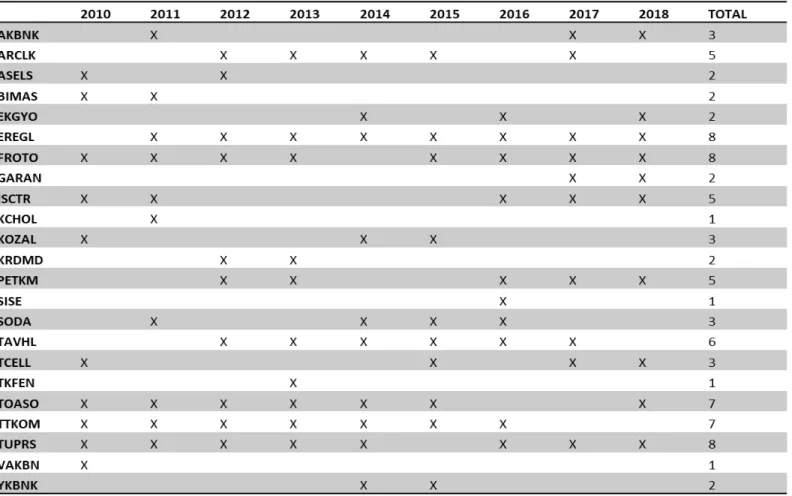
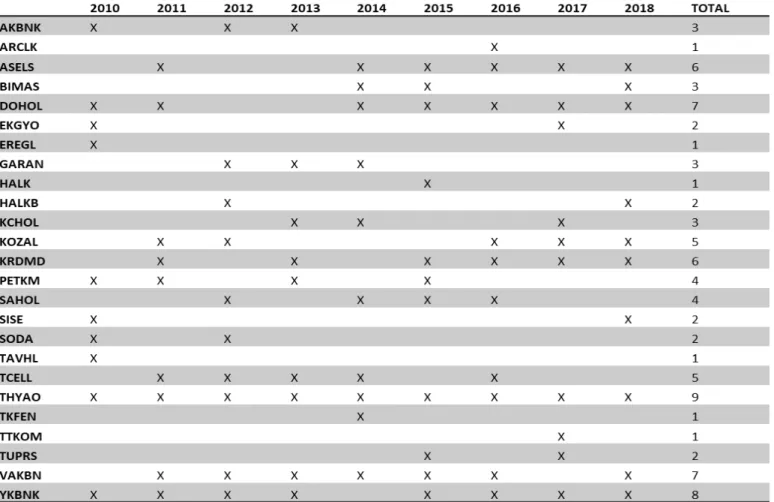
Table 4.1. Only firms who were component of the TOP10 portfolio for at least a year are listed in the associated list………34 Table 4.2. The constituent list shows the companies have 10 highest-yielding stocks consisting of ten stocks with the lowest dividend efficiency………...35 Table 4.3. Results of the cumulative raw returns of the BIST and the DoD………..36 Table 4.4. Shape ratios on BIST30 and DoD portfolios and their difference levels from 2011 to 2018……… 38 Table 4.5. Results of the Wilcoxon signed-rank tests. In Wilcoxon signed-Rank test if Wstat < Wcrit, we can reject null hypothesis at 5 percent significance level…………. 39
ix ABSTRACT
As a Dividend Yield Investment Strategy “Dogs Of Dow” in Istanbul Stock Market
This research examines the performance of the Dogs of Dow stock-picking strategy in Istanbul’s stock exchange (BİST) over the period from 2010 to 2018. Dogs of Dow stock-picking strategy uses dividend pay-out ratios to select stocks that are under their net worth. The idea behind this strategy opposes the efficient market hypothesis (EMH) suggested by Fama (1970). This research applies the original method founded by John Slatter. However, we have also applied Sharpe´s formula to make risk adjustment. In our research, we select İstanbul´s stock exchange due to the fact that no prior studies have been conducted on the BIST; additionally, there is no income tax and a very insignificant transaction cost which can be neglected.
The strategy´s performance is impressive when compared to the previous applications on other international stock exchanges. To conclude, our results have statistical significance and we reject the Null hypothesis of higher returns from the market.
x ÖZET
Temennü Verimliliğ Yatırım Stratejilerinden “Dogs of Dow” adlı stratejinin Borsa İstanbul Verileri Üzerinde Uygulanması
Bu araştırma 2010 ile 2018 yılları arasında temettü verimliliği bazlı Dogs of Dow stratejisinin Bist 30 endeksinde performansının incelenmesini içerir.Dogs of Dow bir endeks içerisindeki hisselerin temettü verimliliği oranlarının karşılaştırılması ve temettü verimliliği en çok olan on hissenin seçilerek bir portföy oluşturma stratejisidir. Bu strateji yaklaşım olarak Fama’nın önerdiği the efficient market hipotezine (EMH) karşında durur.
Bu araştırma John Slatterin bulduğu original Dogs of Dow metodunu esas alır. Buna ek olarak gerçek dünyada yatırımcıların maruz kaldığı risk, işlem maliyeti ve vergi etkilerini hesaba katar.Ulaştığımız sonuçlar stratejinin Borsa Istanbul endeksinde oldukça başarılı olduğunu ortaya koymuştur ve sonuçlarımız istatistiksel olarak desteklenmiştir
1
INTRODUCTION
Since the foundation of stock markets, beating the market has been a target for all investors. Many investing strategies have since been introduced to the general public with varying popularity. Different kinds of investing strategies have been applied in capital markets. Dividend-yield based strategies are much more popular than the other alternatives since they have been talked about a lot by financial press and academic society in recent years The “Dogs of the Dow” is accepted to be one of the most popular Dividend-based strategies that has received considerable interest from practitioners, academics and financial press. The most important side of this stock picking strategy is its simplicity, to apply this popular divided-based stock picking strategy, investors do not need to know any kind of valuation methods, fundamental or technical analysis. Additionally, we know that investors won’t have the ability to beat the market by using common trading strategies (value strategies and growth strategies) and it has been proved that the DoD strategy has not lost its ability to beat the market.
The Dogs of the Dow is the name of one of the most popular dividend-based stock picking strategies first introduced in an article of The Wall Street Journal in 1988. At that time, John Slatter, a financial analyst for Precott, Ball, and Turben of Cleveland beat the market by an annual return of %18.4 with his strategy, while Dow only recorded a 10.8 percent annual return during the period of 1972-1987. There are very important books that also confirm the successful performance of the Dogs of Dow strategy by O’Higgins & Downes (1991) and Knowles and Petty (1992) with longer sample periods. we can easily say that John Slatter´s DoD strategy gained the majority of its current popularity after the release of these books. Clearly this popular investing strategy’s successful results challenges Fama’s “efficient market hypothesis”(Fama,1970). The efficiency of Dogs of Dow strategy caused lasting debates in academic society and there are very important findings that explain the success of Slatter´s strategy. The Dogs of Dow’s aim is to select undervalued stocks by looking at the
2
stock’s dividend-yield ratios. With this perspective we can accept this stock picking strategy as a value stock strategy. Value stocks are specified by high dividend payout ratios, low price to book ratios and low price to earnings ratios.
The idea behind value stock investing is that most investors generally overreact to the good news or information’s. The Dogs of Dow strategy works by selecting the top 10 highest dividend-payout stocks on the DJIA index with equal equity at the last trading day of the calendar year. The portfolio should be held until the last trading day of the following calendar year, updated and rebalanced every year. Like any other active strategies, Dogs of Dow assumes that markets can be inefficient. These strategies challenge Fama’s EMH. In line with Fama’s EHM, all the information that can change the stock’s price is already available in the price, and only unexpected future news can create fluctuations on the stock price. The only way an investor can beat the market is by chance (Fama, 1970). If markets have efficiency, none of the active investment strategies would generate abnormal returns. In literature, there are very important papers which support market efficiency, since there are also very strong evidences against EMH. On the DoD side, there are also many explanations for abnormal returns of Slatter’s strategy. O’Higgins et al. (1991) stated that since the 1970’s, in capital markets, institutional investor´s quantity has increased dramatically, near the year or quarter ends to show their investment portfolios performance better than they are, these institutional investors could sell stock with worse performance at prices under their net worth.
This phenomenon is known as “window dressing”. In addition to, Domian, Louton and Mossman (1998) who justified the DoD phenomenon by “winner-loser” overreaction effect. Most of the financial economist and academics have accepted the phenomenon as an anomaly. Today both Dogs of Dow investing strategy and other alternative dividend yield strategies are very popular, however generally these strategies are applied to developed market. As we accept that this phenomenon can be seen by lack of market efficiency, we can observe this anomaly better in emerging market. When we compare developed markets and emerging markets, because of their popularity, most of the investors show interest on developed markets, and the investors in developed markets are more willing to spend their
3
money to find future and uncovered information, this competition makes developed markets more efficient.
1.1. BRIEF ABOUT BORSA ISTANBUL
The first examples of an organized securities market established in the second half of 1800’s in Turkey. Dersaadet Securities Exchange was founded in 1873 as the first organized securities market in the Ottoman Empire. Later than the foundation of the Turkish Republic, lawmakers decided to reorganize the current securities market and changed the name of Dersaadet Securities Exchange to Istanbul Securities and foreign exhange. After the great depression in 1929 and the World War II, Industrial developments gain rapid Acceleration, and this caused very high demand on capital. Most of the companies started using investors capital and with this, global markets started to grow. Most of institutional investors started managing their investments in global stock markets.In 1980’s Turkish capital markets reached very important progress in improving the legal framework and th institutions needed to create new background to enable to be in global markets. Within this target, Lawmakers legitimated “Capital Market law” in 1981. In addition to, the Capital Markets board was established the year after, main mission of this board was supervising and controlling of Turkish securities market. After many important regulations were completed and very important developments finally the Istanbul Stock Exchange was established in 1985.
Istanbul Stock Exchange continued its operations parallel with the Turkish economy’s growth. Additionally, financial environment was getting more complex and offered widely different investment product. After end of 2012 all Turkish equity market became compatible with both European union standards and global standards. Borsa Istanbul started a strategic partnership agreement with the NASDAQ, their target is to increase this visibility and increase its strength. Today Borsa Istanbul is one of the most important stock markets which can attract international individual and institutional investors.
4
The remainder of the paper proceeds as follows. Section 2 covers related literature on the Dogs of the Dow investment strategy. Section 3 defines the data and presents the method and models used to test the performance of the Dogs of the Dow strategy. Section 4 presents the results on the performance evaluation of the strategy on the Swedish stock market. The paper ends with concluding remarks in section 5.
5
2. LITERATURE REVIEW
In this section, an information given about the features of book-to-market and price-to-earning ratios as represent the basis of portfolio formation. Then, the characteristics of EMH introduced with anomalies and used financial variables given for BIST. Moreover, estimated limited factors and contained market conditions on DoD strategy comprehensively reviewed on Dow30.
2.1. EFFICIENT MARKET HYPOTHESIS
Efficient Market Hypothesis is developed by Fama (1970) stating that whole relevant data in the market can be reached by the all individuals so that, value of a certain product is secured in its intrinsic price. To explain this phenomena, suppose that an investor had found a definite way to predict the stock price changes, it would’ve been an infinite source of income. Because they would’ve been able to buy stocks that were about to increase in price, and they would’ve been able to sell stock before the prices were about to decrease, so in other words, they would’ve been able to predict all the necessary fluctuations in the stock market. This methodology would be extremely sought after because all investors want to be able to predict the rise and falls in stock prices.
All investors try to forecast future prices (rises and falls) by collecting all available information which effect the value of stocks, therefore the price that is provided to us at a certain time reflect all available information collected by all investors. Only new information will be able to change the value of stock prices, new information should be unpredictable because predictable information will be counted as current available information. The impact of the new information (unpredictable information) cannot be evaluated on stock price, therefore new prices cannot be predicted by investors. The “random walk” theory, which explains that all common stock price fluctuations should be random and unpredictable, revolves around this argument. It shouldn’t be considered that the random walk is a sign of
6
the existence of an irrational market because, if a price change is only caused by new information, it shows us that price changes occur rationally thus, a random walk would show us natural results of all current information available to us that reflects in the price. We can accept that if the price changes on stocks were predictable, that would be a sign of the existence of market inefficiency.
Because of the prediction on a probable fluctuation, which have been detected by an investor, price of a particular common stock would not contain the all-available information’s. The hypothesis states that all prices of stock include all available information about that stock is called the “efficient market hypothesis” (Fama,1970).
For all investors who are eager to consume their resources on picking new unexpected information, it would seem logical that they can find some overlooked information to generate higher investment profits. It wouldn’t be surprising to see that the degree of market efficiency is various in different markets and regions, for example, investors are more focused on analyzing developed markets like US markets than emerging markets like Turkish markets (etc. BIST30). Analyzer have a tendency to cover large stocks more than smaller ones, and this may cause the small stocks’ price’s to be less efficient. Since we cannot say that an individual investor can find new information before their rivals, we can accept that the probability to beat larger institutions at getting information is more challenging since they have more money and time to gather that information. We can also accept that highly paid and aggressive analyzers collect all the available information and they bring the price of stock to its fair value.
2.1.1 Forms of the efficient market hypothesis
The three forms of the EMH can easily be distinguished from each other because their main difference is in their concept of “all available information” (Fama, 1970). “The weak-form hypothesis” suggests that common stock prices already include the same data that could be extracted from examining market trading data, such as history of past prices movements. Technical analysis is said to be useless for this hypothesis since all past data are already
7
available, costless and easy to obtain. The weak-form hypothesis argues that if the available information were able to give reliable indications about the future of stock price fluctuations, then investors would use that information to their advantage, therefore the indications lose their value since all investors can have access to them, and that would result in the market losing its value; for example, a buy indication would cause a sudden rise in prices.
“The Semi Strong-form Hypothesis” (Fama,1970) suggests that common stock prices already include information available to the public. In addition to historic prices, this available information includes fundamental data of the firms, quality of management, balance sheet compositions, patents held, earning expectations, and accounting practices. Investors who follow semi strong-form hypothesis believe that information that is not publicly available yet, is the information that can help boost their returns to a level that is higher than the general market. If market is semi-strong efficient, none of investors can beat the market portfolio by making forecasts future returns since all available information is already included in common stock price.
“The Strong-form Hypothesis” (Fama,1970) suggests that stock prices reflect all relevant information, including information that are available to the public and those that are publicly unavailable, are reflected in the stock prices, and that there is no type of information that can give an investor an advantage over the market (Shleifer, 2000). It is commonly known that corporate officers can access relevant information much earlier than that information are released in the public, allowing the corporates to trade based on that information. Although there are rules in place to prevent insiders from releasing information to the public. Such as, rule 10b-5 of the security exchange act of 1934 puts requires corporate officers, directors, and substantial owners, to report their trades to the SEC. It is considered a violation of law if these insiders, their associates, and relatives’ trade based on the information provided by the insiders.
To remedy this phenomenon, there are three major contradictions to the sake of Efficient Market Hypothesis (EMH);
8
(1) all the investors are rational and hence value securities rationally. However, investor’s incentives emotions and biases could affect the decision-making process, but classical finance ignores how real people make decisions (Barberis and Thaler 2003; Shleifer, 2000).
(2) there are some irrational investors in the market, but their trades are random and therefore could cancel each other, so they do not affect prices. Behavioral finance explains the decision-making process by some heuristics and biases.
(3) If irrational investors act in similar ways, rational arbitrageurs could eliminate their influence on prices whereas, behavioral finance argues that rational arbitrageurs in the market are limited and insufficient to force prices to return their net worth.
2.1.2. Implications of the EMH 2.1.2.1. Technical Analysis
Technical analysis is a form of analysis in which analyzers try to find reoccurring and predictable patterns. Although technicians accept the fact that information regarding the future of markets are highly valuable, they believe that this information are not crucial in order to build a successful trading strategy. This is because, whatever effects the fluctuations in stock price, if the change happens slowly enough, and analysts will be able to find a pattern for the future price changes. The main variable in a successful technical analysis is a slow response from the stock price to the fundamental factors. In addition, technical analysis is completely against the notion of the efficient market.
Technical analysts are often referred to as chartists due to the fact that they examine charts and records from prior stocks, hoping to find a pattern they can use to make profit. Think of the relative strength approach as an example for technical analysis. The performance of stock over a recent period of time is compared to other stock or market performances in the same industry. In a simple form of relative strength, the ratio for the stock price is obtained and put in a market indicator (Ex: S&P 500 index). If, over time, the ratio is increased, it means that the stock is showing relative strength because its price performance is better than the
9
price performance of the broad market. This strength could offer profit opportunities if it continues for a long enough time.
“Resistance levels” or “Support Levels” two of the most commonly heard parts of technical analysis. These values are defined as price levels that is either difficult for the stock price to rise above, or for the stock price to fall below. These levels are believed to be determined by market psychology.
2.1.2.2. Fundamental Analysis
“Fundamental Analysis” determines proper stock prices by using earnings and dividend prospects of the firm, expectations of up-coming interest rates, and by evaluating risk of the firm. Eventually, a fundamental analysis attempts to figure out the current discounted worth of all the payments a stockholder will receive from each share of stock. If that value surpasses the stock price, fundamental analysts would advise you to buy that stock.
Initially, fundamental analysts generally conduct studies a company’s previous earnings and examinations of the company’s financial statements. They reinforce this analysis with more detailed economic analysis, an evaluation of the quality of the firm’s management, and the firm’s placement in its industry. The purpose of this analysis is to provide some insight and make predictions about the future performance of that firm.
According to the EMH, most fundamental analysis will fail. If an analyst depends on information that is publicly available to make evaluations and predictions, his or her evaluations are not going to be very different from that other competitors. There are a lot of well-operating firms conducting these sorts of research on a market, and in a competition such as this, it’s hard to find information that is unavailable to other analysts. The only analysts that will be rewarded are those with a different observation. There is more to fundamental analysis than finding a well-run firm. Identifying these firms won’t be beneficial for an investor because the rest of the market also knows about those good firms. An investor
10
will be obligated to pay a high price for those firms and won’t be able to generate a significant return.
The key component is finding firms that are better than what the public think they are, not just trying to identify good firms. Additionally, badly managed firms can be beneficial if they are not as bad as their demonstrated stock price. The reason why fundamental analysis is difficult, is that your analysis has to be better than your rivals because the stock price already shows all the information available to the public.
2.1.2.3. Active versus Passive Portfolio
It’s obvious that effortless attempts to pick stock are likely to fail. The rivalry between investors guarantees that any stock evaluation technique that is easy to use will be used commonly enough so that all the information that can be understood from it will be reflected in the stock prices. The differential insights that are necessary for making profit can only be obtained by thorough analysis and uncommon techniques.
Additionally, these techniques are economically possible only for managers of large portfolios. Let us suppose that you have only $100,000 to invest. This means that an annual %1 of improvement in performance only generates $1,000 per year, which is hardly enough to satisfy your efforts. However, the billion-dollar manager, with the same %1 percent profit, will generate $10 million.
So, what options do small investors have if they can’t compete the bigger investors? It’ll be in the small investors best interest if they invest in mutual funds. By gathering resources in this way, these small investors can profit from economies of scale. Although, there are still some questions that are left unanswered. How can investors be sure that that even large mutual funds are able to, or have the resources to reveal mispriced stocks? In addition, will any mispricing be large enough to pay back the costs demanded in active portfolio management?
11
Supporters of the EMH believe that efforts put on active management are wasted and are not very likely to justify the expenses incurred. Therefore, they suggest a passive investment strategy that doesn’t intend to beat the market. Instead, a passive strategy’s main objective is to establish portfolio with well diversification in securities without the intention of finding under or overvalued stock. Passive management is often characterized as a buy-and-hold strategy. Since the EMH indicates that stock prices are at fair level, having all the necessary information at your disposal, it doesn’t make any sense to buy and sell securities frequently, which generate brokerage fees without increasing the expected performance.
2.2 HOW TO INVEST BASED ON DIVIDEND YIELD STRATEGY
Can dividend pay-out ratios affect the value of a company?
Dividend policy has been considered one of the most debatable topics to investigate. One major question remains unanswered, whether different pay-out ratios would affect the value of a company, and whether shareholders can gain additional profit from higher pay-out dividend policies. Since dividend payments make shareholders satisfied, it can cause a decline in company equities which can affect future investments negatively. On this topic, financial economists are separated into two categories; one of the groups argues that dividend policies won’t affect the company’s value. Miller and Modigliani (1961) argue in their paper that a company’s value only depends on the earnings and investment policies of that company. The other group argues that pay-out ratios can affect the company’s value. This theory is supported by “The Bird in the Hand”, “The Agency Cost Model” and “The Signaling Cost Model”. In next section, these arguments will be briefly discussed.
12 2.2.1. Dividend Irrelevance
According to Miller and Modigliani, in a “perfect world” without any taxes or bankruptcy cost, the dividend policy is irrelevant. They suggested that the dividend policy of a company doesn’t have any effect on the stock price of the company or the company’s capital structure. This is because, to attract the investors, they increase current dividends by using future dividend stream. If the in current dividends increase, it will lead to a decrease in future dividends. “the wealth of existing shareholders is irrelevant to the firm’s pay-out policies” (Miller and Modigliani 1961). In other words, investors can re-invest in company, if the dividend they get is more than their expectations. If they get a lower dividend than they expected, then the investors can sell a part of their shares in company and can generate additional income. In both cases, the amount of profit investors make is irrelevant to the dividend since investors can manage their own cash flow.
What investors truly care about is high returns. They can have that either through re-investing or selling part of their shares. If the market conditions are perfect, then they won’t care if the returns are from dividends or stock price appreciation. They also argue that investment decisions are separated from dividend policies since companies always try to find the optimal investment policies.
2.2.2. Dividend Relevance
In literature, there are different kind of arguments which support the dividend relevance theory. One of these arguments is known as “The Bird in the Hand”. The bird in the hand theory (Myron Gordon and John Lintner) opposes Modigliani and Miller’s theory of dividend irrelevance. This argument suggests that investors prefer to receive a certain pay-out now rather than seeing their money in the company’s equities (Watson et al 2007). Lintner (1956), who provided empirical evidence in regard to the pay-out ratios effects on the company’s value. According to his survey with the corporate managers, pay-out ratios have become one of the most effective bases that the management uses to determine dividend pay-out policy. “The bird in the hand” is a theory that argues investors prefer dividends from stock rather
13
than potential capital gains, because of uncertainty in capital gains. To simplify, according to the bird in the hand theory, most investors are attracted to high dividend pay-out stocks.
The second argument is called “The Agency Cost” model. This argument argues that dividend pay-out is a solution. In big companies, the managers mostly spend the company’s money for they own benefit rather than the shareholder’s benefit; such as renting luxurious offices, buying expensive furniture and etc. the theory suggests that if companies increase their dividend pay-out ratios, it can force the managers to spend less money on unnecessary items.
The third argument that is known as the signaling model, it can be compared to the momentum theory, there is a common belief among investors that high pay-out ratios are a reliable indication of the company’s income generation and the future performance of the company. On the contrary, a decrease in the pay-out ratios can make investors doubt the future performance of the company. Additionally, in literature, there are different empirical findings that show that companies that have increasing trends of dividend payments show better stock performance in the market.
2.2.3 Strategies Derived From Dividend Yield Ratios
Dividend-yield strategies is a part of common group names is “Value investment” strategies. “Value investment” is an investment method with a goal to select under value common stocks by using their dividend yield ratios. Value investors believe that underprice stocks will return their net worth since we know that investors overreact to new information (unexpected) both good and bad and this cause a mispricing (both overpricing or underpricing),the effects of overreaction loses its symptom by the time and mispriced common stock value return to its intrinsic value.Investors can pick value stocks by looking dividend-yield ratios, price to earnings ratios and book to market ratios of common stocks.
In the literature, we can find many different researches which shows evidence supporting value investments strategies. (Fama, French 1988) in their research used dividend /price ratio,
14
namely dividend yield ratio to predict performance on the value and weighted-equally portfolios of New York Stock Exchange. Their research find evidence that common stocks performance can be predicted by looking their dividend ratios. With an interesting feature of their evidence instead of short horizon returns, in long horizon return, dividend yield ratios can explain more that 25 percent of variation of common stock’s return. On the other hand, for short term horizons of common stock returns, dividend yield ratios only can explain less than 5 percent of variance of returns.
On the contrary, there is different studies have evidences about value investment strategies cannot make significant abnormal returns. “It is not possible to demonstrate that the expected returns on high yield common stocks differ from the expected return on low yield common stocks either before or after taxes” (Black and Scholes 1974).To conclude, the financial literature has many well-developed studies about dividend yield strategies, and most of studies shows very strong evidences about dividend yield ratios have positive correlation with common stock expected returns.
2.2.4 Dogs of Dow (DoD)
The Dogs of the Dow is the name of one of the most popular dividend-based stock picking strategies first introduced in an article of The Wall Street Journal in 1988. At that time, John Slatter, a financial analyst for Precott, Ball, and Turben of Cleveland beat the market by an annual return of %18.4 with his strategy, while Dow only recorded a 10.8 percent annual return during the period of 1972-1987. There are very important books that also confirm the successful performance of the Dogs of Dow strategy by O’Higgins & Downes (1991) and Knowles and Petty (1992) with longer sample periods. we can easily say that John Slatter´s DoD strategy gained the majority of its current popularity after the release of these books. Clearly this popular investing strategy’s successful results challenges Fama’s efficient market hypothesis (Fama,1970). The efficiency of Dogs of Dow strategy caused lasting debates in academic society and there are very important findings that explain the success of Slatter´s strategy.
15
The Dogs of Dow’s aim is to select undervalued stocks by looking at the stock’s dividend-yield ratios. With this perspective we can accept this stock-picking strategy as a value stock strategy. Value stocks are specified by high dividend payout ratios, low price to book ratios and low price to earnings ratios. The idea behind value stock investing is that most investors generally overreact to the good news or information’s. The Dogs of Dow strategy works by selecting the top 10 highest dividend-payout stocks on the DJIA index with equal equity at the last trading day of the calendar year. The portfolio should be held until the last trading day of the following calendar year, updated and rebalanced every year. Like any other active strategies, Dogs of Dow assumes that markets can be inefficient. These strategies challenge Fama’s EMH.
In line with Fama’s EMH, all the information that can change the stock’s price is already available in the price, and only unexpected future news can create fluctuations on the stock price. The only way an investor can beat the market is by chance (Fama, 1970). If markets have efficiency, none of the active investment strategies would generate abnormal returns. In literature, there are very important papers which support market efficiency, since there are also very strong evidences against market efficiency theory. On the DoD side, there are also many explanations for abnormal returns of Slatter’s strategy. O’Higgins et al. (1991) stated that since the 1970’s, in capital markets, institutional investor´s quantity has increased dramatically, near the year or quarter ends to show their investment portfolios performance better than they are, these institutional investors could sell stock with worse performance at prices under their net worth. This phenomenon is known as “window dressing”. In addition to, Domian, Louton and Mossman (1998) who justified the DoD phenomenon by “winner-loser” overreaction effect.
Most of the financial economist and academics have accepted the phenomenon as an anomaly. Today both Dogs of Dow investing strategy and other alternative dividend yield strategies are very popular, however generally these strategies are applied to developed market. As we accept that this phenomenon can be seen by lack of market efficiency, we can observe this anomaly better in emerging market. When we compare developed markets and emerging markets, because of their popularity, most of the investors show interest on
16
developed markets, and the investors in developed markets are more willing to spend their money to find future and uncovered information, this competition makes developed markets more efficient.
2.2.5 Prior Researches on DoD
Dogs of Dow is an investing methodology that has recently become popular. John Slatter (1988) suggested an uncomplicated and innovative investing strategy. According to this strategy, investors are required to invest the same amounts of money in stocks with top ten highest dividend ratios in the Dow Jones Industrial Average (DJIA) and for one year, keeping these high-yielding stocks. The studies done on this strategy show is that this methodology beat the DJIA index by %7.6 each year for 15 years (from 1972 to 1987). The conducted research has some flaws however, because it puts all its focus on the absolute returns and pays no attention to the risk-adjusted returns. Additionally, it doesn’t put transaction costs and taxes into consideration while the actual gain of the methodology is being calculated.
The success of this strategy was later on proved by Knowles and Petty (1992). They released books, analyzing this methodology over an expanded span of time. What they discovered on this matter verified the performance of this methodology. During 1973-1991, O’Higgins at al finds an higher yearly return of %6.2 for the DoD methodology in contrast to the DJIA index. O’Higgins and Downes (1991) also claim that the two main reasons contributing to DoD’s superior performance are “window dressing” and an increase in institutional investors in the 1970s. To improve the looks of the performance portfolios that haven’t been sent to clients yet, institutional investors have the option to sell poorly performed stocks under their new worth value in good markets near the end of the year. DoD selects these undervalued stocks, because their value has a tendency to increase in good market conditions and return their net worth. The top ten highest dividend portfolio strategy reach yearly abnormal return of about %4 in contrast to the DJIA index from 1957 to 1990. In addition, they try a different method. In this method, instead of selecting 10 of the highest dividend yield stock, 5 are selected. This portfolio surpasses the traditional DoD portfolio by %1.2 (the new portfolio has a return of %15.4 while the traditional DoD portfolio has a return of %14.2).
17
Regardless of the reassuring outcomes provided by the first three studies, other researches showed unpredictable benefit when it comes to the DoD strategy. The first study about the DoD strategy published on a financial academic journal was written by McQueen, Shields, and Thorley (1997). The question the authors were trying to answer was if this methodology “beat the Dow statistically and economically”. They did this by comparing two portfolios. They compared the top ten highest dividend ratios portfolio with DJIA, and the outcome indicated that the Dogs of Dow portfolio beat the DJIA yearly by 3.06% over 50-year-period from 1946 to 1995. Although, it was indicated that the performance of Dogs of Dow showed outstanding additional returns after adjustments were made to higher risk, transaction cost and tax. Dogs of Dow portfolio has higher standard deviation when compared to the DJIA due to the fact that there are still some unsystematic risks remaining. McQueen et al. (1997) used Sharpe ratio to compares portfolio performances. After the adjustments of the risk, the abnormal returns between portfolios dropped from %3.06 to %1.52. In conclusion, half of the Dogs of Dow portfolios premium can be explained by risk alone.
Because of the transaction cost DoD portfolio affected by %0.57 percent, but the trading cost is for only %0.02 percent loss in the DJIA. After putting the transaction cost into consideration, the risk-adjusted premium of DoD continued to decrease by %0.57 (from 1.52% to only 0.95%). The higher taxes in the DoD strategy are a result of large amounts of returns are received from dividends and not capital gains. Taking the years 1987 to 1990 out of consideration, capital gains have received favorable tax treatments in the U.S tax system. McQueen et al. (1997) claimed that conducting a formal analysis on the tax advantages is impossible, because it depends on individual’s marginal tax rate and other factors. Therefore, after consider transaction costs and tax factors and risk adjustments, they stated in their conclusion that “the Dogs of Dow probably not beat the Dow-30 economically”.
Additionally, McQueen et al. (1997) took the performance of DoD in shorter time periods under examination. The entire 5 decades were divided into 1-decade-sub-periods. They found that, after taking account risk, transaction costs and taxes, the DoD dividend yield portfolio to outperform the market in only 2 time over 5 time periods. McQueen et al claimed that the
18
reason why the Dogs of Dow stock picking method was so successful was due to data mining, therefore there is a high probability that it would disappear if it’s well-known amongst investors. Let’s suppose that a high number of investors try to purchase 10 identical stock that are under the market value. This would result in an increase in the price of that stock, leading to the elimination if “the dividend anomaly”. McQueen et al’s argument were later confirmed by Keating (1998) who stated that “the Dogs have lost their abnormal returns since 1995”. According to him, the disappearance of the abnormal profits related to the Dogs is caused by more people learning about the strategy. There is an increased chance that capital flow will flow into these stocks if more people learn about this strategy, therefore, causing the abnormal profits to disappear. He displayed that the Dogs rose 22% when Dow gained %24.
From 1964-1997, Domian, Louton and Mossman (1998) were examining the links between past performance, dividend yields and future expectations. The authors compared the performance of a portfolio is similar to DoD portfolio that contains the top ten highest dividends yield common stocks in the Dow jones industrial average index with the S&P 500. This study had a various approach when we compared to previous ones as it conducted an investigation on the explanation of the DoD strategy. They tested if the abnormal performance of this portfolio with top ten highest dividend yield ratio, it can be caused by an overreaction effect. The idea behind this hypothesis suggest that investors have a tendency to overreact to new unexpected news and the first goal of their research is to find evidences about if top 10 high-yield stocks are following abnormal performance is “winner-loser” overreaction effect.
The second purpose of this study is to monitor the performance of the DoD portfolio over sub-period. The author split the entire sample period into two sub samples due to the stock market crash in 1987: 1964-1986 and 1989-1997. The research’s outcomes are similar with the overreaction hypothesis. The stocks with low dividend ratios beat the market by %7.81; the common stocks with high dividend ratios underperform the market by %3.67. This will cause a difference of %11.48 between the losers’ portfolio and winners’ portfolio. However, in the following 12 months, the stocks with higher dividend ratios outperformed the market
19
by %4.8 and the stocks with lower dividend ratios slightly underperformed the market. The first sub-period results (1964-1986) are parallel with the entire period (1964-1997). The DoD portfolio managed to slightly outperform the market during the latter sub period (1989-1997), but then it dropped down after 3 months. In conclusion, the authors said that the Dogs of Dow strategy may result of winner-loser effect and it will no longer be effective once it becomes widely known (period 1989-1997).
Prather and Webb (2002) however, approached this with a completely different perspective. They showed that neither data mining problems nor data errors are a reason why this strategy is effective. They don’t accept the “window dressing” phenomenon suggested by O’Higgins and Downes (1991). Prather et al. (2002) studies the DoD’s performance in U.S stock market during 1961-1998 and suggested that the portfolio beat DJIA by 4% every year after risks adjustments. Even the transaction costs and tax payments weren’t added to calculations, the performance of the Dogs of Dow is high enough that even after considering these factors (transaction costs and tax payment) DoD was still able to beat the market.
The DoD stock picking method was also investigated in global market. From March 1984 to February 1994, the performance of the DoD strategy in the British stock market was examined by Visscher and Sue (1997). It was shown by the results that method was ineffective. The DoD portfolio performance beat the market performance, with or without risk adjustments in only four years. The authors also mentioned that the reason why the strategy performed differently in U.S market when compared to the British market is due to the difference between DJIA and FTSE-100. Visscher and Filbeck (2003) investigate the DoD stock picking method in the Canadian stock exchange between 1988 and 1997. The outcome of their study showed that the DoD stock picking method reach an abnormal return of %6.6.
The most recent study conducted on DoD was done on the Finnish stock market by Rinne and Vähämaa, who provided verifiable evidence supporting their claims. They compared the portfolio performance of top 10 high dividend yield ratios (DoD) stocks from the OMXH25 with the Helsinki market index from 1988 to 2008. The outcome of this study indicate that
20
the DoD strategy beat the market index with an average yearly return of %4.5. However, the abnormal performance is not able to afford to transaction and tax expenses, which show that the using this method is not economically feasible. Furthermore, they focus on DoD during bear market periods. These periods include the bank crisis in the early 1990s, the technology bubble in the 2000s and the recent global financial crisis in 2008. They found that the abnormal performance of the DoD seems more powerful during bear market. This study also tries to investigate for the DoD’s abnormal returns. The authors examined if the winner-loser effect had an impact on the DoD’s outperformance. The results of this study were similar to Domian et al’s findings which mentioning that the stocks with high dividend yield ratio are losers and the stocks with low dividend yield ratios are winners. During this study period, the stocks with high dividend yield ratios beat both the market and the portfolio contains stocks with low dividend yield ratios. In conclusion, this study shows that the better performance of the DoD stock picking method is clearly an indication of the winner-loser effect
Even though the Dogs of Dow stock picking strategy has been investigated and tested in the most of developed markets, there is not enough studies in the emerging stock markets. In order to understand if DoD stock picking strategy is the effective in the Turkish stock market, an emerging market, we should first take a look at the noticeable studies applied in emerging markets. Da Silva (2001) in his study investigate the performance of DoD strategy in Latin American stock markets including Argentina, Chile, Colombia, Mexico, Peru, and Venezuela over the period from 1994 to 1999. He used the Sharpe index to see the strategy’s performance with risk adjusted basis. Additionally, the author also adds the transaction and tax expenses to his calculations of the abnormal return of the portfolio. His findings in this study shows that the DoD strategy reach abnormal returns with risk adjustments in all countries apart from Brazil, however, the results are not statistically approved.
The DoD strategy was analyzed in the Polish stock market by Brzeszczyński and Gajdka (2007). They started their studies since the Warsaw Stock Exchange opened in 1991 to 2004. The outcome provided by this study suggested that although the DoD portfolios managed to overcome the market during the complete study duration, their performances change over
21
time and the highest returns can be gained in the more recent years. An acceptable way to explain this phenomenon is that the institutional relative has gained importance to independent investors in the past few years. Furthermore, the size effect and the relative book value effect on the execution of the high-yield portfolios was tested on by researchers, who discovered that the dividend-yield strategy shows great success in small companies.
Wang et al (2011), using data from the Chinese stock market from 1994-2009, tested various types of DoD portfolio regarding the holding periods before rebalancing and the number of stocks. The results of this study indicated that the DoD portfolio managed to surpass the Chinese stock index even after adjustments were made for transaction costs, risk and tax. Furthermore, the researchers stated, “that the abnormal return of the DoD portfolio is in contrast with the number of the stocks in the portfolio and the frequency of rebalancing”. Additionally, a rise in the amount of stocks in a DoD portfolio and a fall in the rebalancing frequency has a chance to the risk-adjusted returns of the portfolio.
2.3. OVER REACTION
Overreaction is a non-rational reaction to new information’s which effects stock price. Overreaction caused a mispricing on stock values for a time until prices comes to stock’s substantial value. After overreaction we can observed that stock price can be oversold or overbought until it comes to its net worth value. Investors don’t behave rationally always; they are very keen to make some decisions with their emotions.De Bolt, Thaler (1985) say that the overreaction is the event when investor violate Bayes Rule and overreact to new news which effects the price of stock. Irrational investors observed the previous performance of past winners and loser stocks and they think that the momentum of the performance will exist in the future. As we know from Fama’s EMH, there is a random walk for stock price, but investors believe these irrational expectations. However, irrational investors continue to buy past gainer and sell past loser stocks, this cause the overreaction and mispricing on stock prices.
22 2.3.1 Noise Trading
“Efficient market hypothesis” (Fama,1970) assumes that all investors make decisions rationally and only respect unexpected (new information) while valuing all securities. Value of stock is evaluated by net present value of companies future cashflows. When rationally behaving investors get an unexpected (new information), they immediately re-evaluate the price under new information. By this perspective, all stocks reflect all available information.
However, a paper published by (Shleifer, Summers, 2000). is questioning rationality of investors behavior. Very well know saying “Buy the rumor sell the fact” is coming from this perspective. These investors are called as noise traders (Kyle,1985). Noise trader are not a passive trader since Fama’s EMH assumes that all investors should choose passive strategy, they listen and follow their financial experts and their advices, they are trying to forecast upcoming dividend stream of companies with the information or rumor coming from their advisors and they are very keen to follow popular trading ideas.
“Investors who trade on noise or on popular models are worse off than they would be if their expectations were rational (if welfare is computed with respect to the correct distribution of returns). They need not lose money on average, as the simplest logic might suggest. However, even if they earn higher average returns, it is because they bear more risk than they think. In addition, even if they get rich over time, it is only because they underestimate the risk and get lucky. If investors had perfect foresight and rationality, they would know that noise trading always hurts them.” (Shleifer, Summers, 1990).
2.4. EXAMPLES FOR CAUSE OF IRRATIONAL BEHAVIORS 2.4.1. Over Confidence
Most of investors is showing too high confidence on their in their investment decision. “80 percent of people think they are better than the average at doing same” (Kahneman,Riepe (1985).“Perhaps, the most robust finding in psychology of judgments is that people are overconfident”(De Bondt, Thaler,1995). There is to many different research’s in different
23
contexts, but it is not this thesis’ aim. “Overconfident means the investors who consider himself to be more capable of evaluating a stock than in reality is. Thus, this result for him in valuing his forecast error variation” Daniel et al (1985).
2.4.2. Representative Heuristic
Kahneman, Tvelsky (1974) argued that investor’s behavior is influenced by an effect called representative heuristic. Under this, “people have a tendency to categorize events as typical or representative of a well-known class, and then, in making probabilities, to overstress the importance of such a categorization, disregarding evidence about the underlying probabilities”. Shiller (1997), “Under representative heuristic, irrational investors look for patterns in stock prices that in reality follow a random walk” Barberis et al. (1998). Thus, as Shleifer (2000), Lakonishok et al. (1994) investors overreact to the coming of new information. They extrapolate the stock prices of companies with good (bad) prospects far away into the future. This results in the overvaluation (undervaluation) of past good (bad) firms.”
2.4.3. Illusion of Control
O’ Keeny, Soane (2000) “Under illusion of Control cognitive bias, investors try to change a situation where it would be appropriate to concentrate on it and get used to it. Additionally, investors when evaluating-judging risks, it is more likely to underestimate them. The possibility for them to think that they can control risks is very high. This argument is very close to the overconfidence and representative heuristic cognitive biases. Therefore, it is likely for irrational investors, to change or structure imaginary patterns that in reality do not exist”.
There behavioral findings create a strong contrast with the EHM, we can’t say that irrational investors’ decision are random and irrational, their behavior can be explained by phycological arguments. Therefore, noise traders called irrational investors will exist in the
24
market and effects prices by their behavioral motivations. There is some more sub-titles on overreaction can be studied in other researches.
2.4.4. The Underreaction Effect
Dogs of Dow stock picking strategy can be explained by the underreaction effect where investors are traditional, underweight previous good news and they are not willing to change their beliefs. The existing research implies a relationship between overreaction and underreaction. Behavioral models (Daniel et al. 1998, Barberis et al., 1998) try to give a unified theoretical background for the relationship of these effects. Returns of Dogs of Dow portfolios, underreaction bias continue to have a positive autocorrelation 3-12 months after the portfolio formation, whereas under the overreaction phenomenon, they present a negative autocorrelation 3-5 years after the portfolio formation.
25
3. DATA AND METHODOLOGY
The studies have been explained that the DoD investment strategies evidently have abnormal return. In addition to, our results after risk adjustment also have very strong proof that Dogs of Dog stock picking strategy is working in Borsa Istanbul. Hereby, we will firstly test the DoD’s performance Istanbul Stock Exchange in order to perform an exclusive example which hasn’t been done before. Turkish stock market has many parameters that is similar to the stock markets of the Asian whereas, there are characteristic features that turn into a particular stock market resulted from the very delicate fluctuations caused by the political and systematical influences. Normally, DoD strategy should provide increased tax payments and higher transaction costs as it is active strategy, but In Istanbul Stock Exchange tax rate is zero. In order to indicate if the DoD stock picking method is economically significant, we hereby outperform the related market return by concerning possible transaction costs and taxes payment.
Even though, this investment strategy is only tested and studied by academicians, therefore the only insight about the performance of the DoD is somehow limited. That is why, this chapter presents how we collect our data and our research method, along with a critical discussion around the choices we make on actual data. Aiming to achieve a high comparability with previous studies we try to deviate as little as possible in our method. We begin by presenting our data set and the method for constructing the Dow Dog portfolio. Having identified the portfolio constituents, we proceed with our performance measures of the portfolio. Lastly, we discuss the measuring of statistical significance and robustness testing of the research.
26 3.1. DATASET OF THE THESIS CONTENT
Analyzing the Dogs of the Dow provides an interesting perspective in the Borsa Istanbul (Istanbul stock exchange) whether the strategy is applicable to other markets (Asian, European and US markets). However, differences can be observed between the DJIA and BIST30 where the sample is extracted. This needs to be taken into consideration when interpreting the outcomes. Both indexes consist of 30 publicly traded companies. To be included in the BIST30, a company must be a large cap company and have high trading volume. The data range of previous Dow Dogs research that we discuss averages to about 15 years. As Istanbul Stock Exchange have not enough deepness before 2009, I select a period starting from 2010 till 2018.
The data of publicly traded Turkish firms are obtained from the Borsa Istanbul. Other data sources used in this study are obtained from the Matriks which a data provider is and IsYatırım. Dividend yields calculated by dividing of cash dividends to stock price in the last day of year. The calculated dividend yields are ranked from high to low. The ten highest yielding stocks are chosen on a yearly basis, forming what we refer to from this point and on as the “TOP10” portfolio. From a portfolio theory perspective, an investor ought to be compensated for any risk taken in excess of the risk-free rate. The 5-year government bond, one of the safest securities available to investors, represents the risk-free rate of return.
3.2 HOW TO BUILD TO DOD PORTFOLIO
In this study, we followed the standard and most common DoD portfolio, called “Dogs of Dow”(John Slatter,1988) that have been suggested by Slatter (1988). Here we successively pursue the following steps; (1) calculation of the dividend yields for all the stocks period from 2011 to 2018. The portfolio is formed with the combination of the ten topmost yield stocks (2) The portfolio is only valid for one-year time period. When the year has passed, new stocks are replaced after the previous portfolio is review by selling performance. (iii) The procedure is repeated on each year.
Time-bounded series are containing the monthly prices of the stock markets. Cash dividends are added to the common stock value at the end of each year due to evaluate the annual
27
returns of the portfolios. The Dow Dog strategy ought to be a low-cost investment and easily implemented by the average (uneducated) investor, which is why we chose to temporarily place any proceeds in the risk-free rate. Previous research does not specify how they deal with the situation where a company in the portfolio is delisted from the Stockholm Stock Exchange.
The Dogs of Dow’s aim is to select undervalued stocks by looking at the stock’s dividend-yield ratios. With this perspective we can accept this stock-picking strategy as a value stock strategy. Value stocks are specified by high dividend payout ratios, low price to book ratios and low price to earnings ratios.
The idea behind value stock investing is that most investors generally overreact to the good news or information’s. The Dogs of Dow strategy works by selecting the top 10 highest dividend-payout stocks on the DJIA index with equal equity at the last trading day of the calendar year. The portfolio should be held until the last trading day of the following calendar year, updated and rebalanced every year. Like any other active strategies, Dogs of Dow assumes that markets can be inefficient. These strategies challenge Fama’s EMH.
3.3 PORTFOLIO RETURN
To analyze the performance of the Dows of Dow portfolio, the returns of each individual common stock should be identified. While we are calculating the return of individual common stock, assuming that all cash dividends are re-invested in the same stock when they are retained.
As Hirschey (2000) point outs, previous studies are criticized for relying on the cumulative returns when sanctioning the success of the Dow Dog strategy. Barber and Lyon (1996) explains that the cumulative return (CR) is a biased predictor of returns for a longer period, since it does not take compounding into consideration.
Through their study they show that the differences of BHR and CR are predictable, where the CR tends to be biased upwards. If individual securities in the portfolio are more volatile than the market index, they show that the cumulative return is greater than the buy and hold
28
return of the portfolio if the buy and hold return is less equal to zero. As the buy and hold return increases however, the difference approach zero and eventually turns negative.
We choose a buy-and-hold return (BHR) measurement when calculating the portfolio performance. This is also in line with previous studies (see, for example, Rinne & Vähämaa, 2011). The BHR presents the compounded returns for the whole study period from 2010 through 2018. The usage of the BHR measurement should however be used with caution. The effect of compounding through extreme events could easily distort the results to appear larger than they really are (McLean, 2012).
The market-adjusted model is performed in this study in order to evaluate the abnormal returns. Such returns can be expressed as follows:
Eq. (1) T-statistics is performed to test relevance between the portfolio and market return. In this calculation step, 0.05 and 0.1 ratios are used as level of significance. According to the Modigliani and Modigliani (1997), we performed to calculate abnormal return initially. This method is also named as ‘Modigliani-squared’ calculation adjustment:
29
In order to test the risk-adjusted performance of the DoD strategy, Sharpe ratio and Treynor index are used. The Sharpe ratio formula is:
Eq. (3) Where:
𝑅𝑅p = 𝐸𝐸𝐸𝐸𝐸𝐸𝐸𝐸𝐸𝐸𝐸𝐸𝐸𝐸𝐸𝐸 𝐸𝐸𝑝𝑝𝑝𝑝𝐸𝐸𝑝𝑝𝑝𝑝𝑝𝑝𝑝𝑝𝑝𝑝 𝑝𝑝𝐸𝐸𝐸𝐸𝑟𝑟𝑝𝑝𝑟𝑟
𝑅𝑅f = 𝑅𝑅𝑝𝑝𝑅𝑅𝑅𝑅 𝑝𝑝𝑝𝑝𝐸𝐸𝐸𝐸 𝑝𝑝𝑟𝑟𝐸𝐸𝐸𝐸
𝜎𝜎p = 𝑃𝑃𝑝𝑝𝑝𝑝𝐸𝐸𝑝𝑝𝑝𝑝𝑝𝑝𝑝𝑝𝑝𝑝 𝑅𝑅𝐸𝐸𝑟𝑟𝑟𝑟𝐸𝐸𝑟𝑟𝑝𝑝𝐸𝐸 𝐸𝐸𝐸𝐸𝑑𝑑𝑝𝑝𝑟𝑟𝐸𝐸𝑝𝑝𝑝𝑝𝑟𝑟
However to test the excess return for each week, Treynor index is used for the evaluation of risk-adjusted performance.
3.4 RISK ADJUSTMENTS
Given the limitations of portfolio diversification by only holding 10 stocks, firm specific events have a significant effect on the portfolio return. It is also possible that there is a high correlation between the the companies in the Dow Dog portfolio. Assuming a risk averse investor, it becomes necessary to adjust the abnormal returns for the risk taken. Before applying risk adjustments to the Dow Dog portfolio, we estimate its volatility, which is measured by the variance
30 Where:
σ2p,t = Variance
wt,a = Portfolio weight (covers from the beginning of the year) σt,a = Standard deviation
rt,b = Gross return for stock b during year t rt,a = Gross return for stock a during year t cov(rt,b, rt,a) = Covariance between stock b and a
The standard deviation is simply the square root of the variance. We also measure the volatility of the BIST30 index during the holding period. The standard deviation represents the total risk, i.e. both systematic and unsystematic risk. There are however also drawbacks with the using standard deviation when measuring risk. The standard deviation is highly sensitive to outliers in the data set, which could significantly affect the value. Furthermore, measuring risk through standard deviation penalizes both positive and negative deviation of the returns, which might result in overestimating the risk. With a long-term perspective however, we argue that a higher standard deviation should be seen as a higher risk since returns should be distributed around the mean.
We use the standard deviation when calculating the Sharpe Ratio for both the market and TOP10 portfolio. The Sharpe ratio was introduced by William F. Sharpe (1994) and is often referred to as the reward-to-variability ratio. It measures the excess return after subtracting the risk-free rate for each unit of risk. Since the Sharpe ratio derives the risk measure from the standard deviation it is often preferred over the frequently used CAPM, which uses beta as a risk measure and only captures the systematic risk. Many of the prior studies use a risk measure based on the portfolio’s beta instead of the portfolio’s standard deviation (see Appendix II). This could potentially have affected their results by underestimating the portfolio’s risk. We calculate the Sharpe ratio for both the TOP10 and market portfolio on an annual basis.
31
The Sharpe ratio risk adjusted return is expressed in unit points and is defined as:
Eq. (5)
Where:
Sp= Sharpe ratio of the portfolio Rp=Return of the portfolio Rf=Risk-free rate
Σp=Standard deviation of the portfolio
3.4.1. Transaction Costs
When we compare with other global markets, in Borsa Istanbul, transaction cost can be eliminated. For individual investors common transaction cost is 0.07 percent which will accepted zero in this study.
3.4.2.Taxes
Investors who is investing Borsa Istanbul, do not face to face with a tax. After 2008 the tax rate of trading incomes decreased to zero percent, this means that none of investors both individual and institutional investors don’t pay any taxes from their profit on Borsa Istanbul. So, in my opinion, this is very important differences with other global markets and availability of non-tax trading cause that dividend yield strategies can be economically feasible.
32
3.7 STATISTICAL TESTING
Relying on only seven years’ annual returns for our analysis, a concern for the reliability of the results could be raised. Instead of resorting to conventional parametric techniques, such as t-tests, we choose to perform a nonparametric hypothesis test. The benefit of using a nonparametric test is that it does not assume a Gaussian distribution and mitigates problems stemming from small sample biases. To test whether our results are significant or not, we perform a Wilcoxon signed-rank test, often referred to as the Wilcoxon test. Frank Wilcoxon introduced the Wilcoxon test in 1945. It can be used to compare two related samples and whether their populations mean rank differ.
The test ranks each value in the samples relative to the other and thereby takes both the differences between the samples and the magnitude of them into account. It assumes that the data is paired and from the same population. The pairs must also be chosen randomly and independently. After calculating the annual differences in the two data sets, consisting of the TOP10 and market portfolio, we rank the differences in an ascending order. The negative and positive differences are then separated and summed, where the sum of the negative values provides us with the T-statistic:
Eq. (6) Where;
T = T-statistic
(T-) = Negative ranks
We test our hypothesis at the five percent significance level. This means that there is a five percent risk that we reject the null hypothesis even though the DoD portfolio do not yield abnormal returns.