CHARACTERIZATION OF CANCER STEM CELLS IN
HEPATOCELLULAR CARCINOMA
A THESIS SUBMITTED TO
THE DEPARTMENT OF MOLECULAR BIOLOGY AND GENETICS
AND THE GRADUATE SCHOOL OF ENGINEERING AND SCIENCE OF BILKENT UNIVERSITY
IN PARTIAL FULFILLMENT OF THE REQUIREMENTS FOR THE DEGREE OF
MASTER OF SCIENCE
BY
MERVE DENİZ ABDÜSSELAMOĞLU
JUNE 2014
ii ABSTRACT
CHARACTERIZATION OF CANCER STEM CELLS IN HEPATOCELLULAR CARCINOMA
Merve Deniz Abdüsselamoğlu M.Sc. in Molecular Biology and Genetics
Supervisor: Prof. Dr. İhsan Gürsel Co-Supervisor: Prof. Dr. Mehmet Öztürk
June 2014, 96 Pages
Hepatocellular carcinoma (HCC) is the third most common cause of death from cancer worldwide due to the challenges in both its diagnosis and treatment. According to recent studies, HCC tumors, like many other solid tumors are initiated and maintained by a subpopulation of cells called “cancer stem cells (CSCs)” or "tumor-initiating cells (TICs)". HCC stem cells can be identified by the expression of cardinal CD markers such as CD133 (Prominin-1) and epithelial cell adhesion molecule (EpCAM). This study primarily focuses on the investigation of mechanisms involved in the generation of HCC stem cell sub-population using a panel of 15 HCC cell lines. Preliminary data indicates that four cell lines (27%) display CD133+ stem cell populations at frequencies ranging from 8 to 90% when tested by flow cytometry. Among these CD133 positive cell lines, two isogenic cell line with different positivity levels prompted us to focus on two specific cell lines;, i) parental HepG2 cell line and its clone, which was transfected with four copies of hepatitis B virus (HBV), namely ii) HepG2-2215. With tumorigenicity assay induced in atymic nude mice, data revealed that HepG2-2215 that had higher CD133+ ratio, showed higher and rapid tumor formation than parental HepG2 that had much lower CD133+ sub-cellular proportion. Microarray analyses were performed to underpin the mechanisms of in CD133+ cell number variations of these two cell lines. Our initial findings suggested that FGFR signaling pathway might have played a role. To investigate these findings, FGFR signaling pathway was inhibited via potent inhibitor as well as knock down with siRNA. However, preliminary data did not indicate these presumptions and further studies are needed to clarify the relationship between FGFR signaling and CSC formation in HCC. Also, role of suppressive oligodeoxynucleotide (ODN) was studied to see the effects of suppression of DNA-driven immunostimulation. Findings showed that suppressive ODN decreased CD133 levels, which indicates the difference between these two cell lines may arise from the HBV transfection of HepG2-2215 cell line which can produce HBV particles. However, further investigation is needed to understand the relationship between HBV infection and CSC population in HCC.
Keywords: hepatocellular carcinoma, cancer stem cells, CD133, EpCAM, Wnt,
iii ÖZET
KARACİĞER KANSERİNDEKİ KANSER KÖK HÜCRELERİNİN BELİRLENMESİ
Merve Deniz Abdüsselamoğlu
Moleküler Biyoloji ve Genetik Yüksek Lisansı Danışman: Prof. Dr. İhsan Gürsel Eş Danışman: Prof. Dr. Mehmet Öztürk
Haziran 2014, 96 Sayfa
Hepatosellüler karsinom (HSK) teşhis ve tedavi sürecindeki sıkıntılardan dolayı, dünyada, kansere bağlı ölümlerde ilk üç sırada yer almaktadır. Yapılan son çalışmalara göre, HSK tümörleri, diğer birçok solid tümör gibi, “kanser kök hücreleri (KKH)” ya da “ kanser başlatan hücreler (KBH)” olarak adlandırılan hücreler tarafından başlatılır ve tümörün devamlılığı bu hücrelere bağlıdır. HSK kök hücreleri bazı CD markörlerinin ifadesi ile tanınabilir, CD133 (Prominin-1) ve EpCAM de bu markörlerden biridir. Bu çalışma genel olarak, HSK kök hücrelerinin oluşmasında yer alan mekanizmaları, 15 adet HSK hücre hattından oluşan bir panelde incelemeye odaklanmıştır. Ön çalışmalarımız, akış sitometresi deneylerinde, sadece dört hücre hattının (27%), 8-90% olarak değişen oranlarda CD133+
kök hücre topluluğuna sahip olduğunu göstermiştir. Bu CD133 pozitif hücre hatları arasında iki izojenik hücre hattı, farklı pozitivite seviyeleri nedeniyle odaklanılmıştır,, i) parental hücre hattı HepG2 ve hepatit B virüsünün (HBV) dört kopyasıyla transfekte edilmiş olan klonu, ii) HepG2-2215. Atymic çıplak farelerde yapılan tümör gelişimini deneyi ile yüksek CD133+ hücre oranına sahip HepG2-2215, daha az CD133+ hücre sayısına sahip HepG2’den daha hızlı ve çabuk tümör oluşumu göstermiştir. Mikro-dizi analizi yapılarak bu hücre hatlarının CD133 +
hücre sayıları farkı altında yatan mekanizmalarını keşfetmek amaçlanmıştır. İlk bulgularımız FGFR sinyal yolağının role sahip olabileceğini düşündürmektedir. Bu bulguları test etmek için FGFR yolağı güçlü bir inhibitör ve siRNA muamelesi ile susturulmuştur. Ancak, ilk veriler bu düşüncelerimizi desteklememiştir. Bu yüzden HSK'da FGRF yolağı ve KKH oluşumu arasındaki ilişkiyi netleştirmek için başka çalışmalara ihtiyaç vardır. Ayrıca, DNA güdümlü immün uyarıcı etkileri susturan, baskılayıcı oligodeoxynucleotide (ODN) rolü DNA çalışılmıştır. Bulgular baskılayıcı ODN muamelesinin CD133 oranlarını düşürdüğünü göstermiş. Sonuçlar, bu iki hücre hattının farklı CD133 positivite oranlarına sahip olmasının sebebinin HepG2-2215 hücre hattının HBV transfekte olup, HBV partikül oluşturmasından dolayı olabileceğine işaret etmiştir. Ancak, HSK’daki KKH nüfusu ile HBV ilişkisini anlamak için daha fazla araştırma gereklidir.
Anahtar sözcükler: hepatosellüler karsinom, kanser kök hücreleri, CD133, EpCAM, TGF-, FGFR
iv
TO MY FAMILY .
v
ACKNOWLEDGEMENTS
First of all, I would like to thank my former thesis supervisor Prof. Dr. Mehmet Öztürk for his supervision throughout this project. Then, I would like to thank my present thesis supervisor Prof. Dr. İhsan Gürsel. Without their help and understanding, I would not be able to finish this project. Prof. Dr. Mehmet Öztürk has an extensive knowledge in molecular biology, which encouraged me to ask new questions while Prof. Dr. Gürsel is an esteemed scientist with very high motivation and enthusiasm, and he always supported me to look in a new perspective. It was a privilege for me to work in their laboratories as a M.Sc. student, which made me a multidirectional in my studies.
Secondly, I would like to thank Yusuf İsmail Ertuna for his valuable support throughout this project. I would also like to thank Gökhan Yıldız and Tamer Kahraman for their crucial contributions to this work.
All the past and present members of Öztürk group, especially Dilek Çevik and Ayşegül Örs, Emre Yurdusev, Dr. Çiğdem Özen, Engin Demirdizen, Derya Soner and Umar Raza have been wonderful colleagues and friends during my M.Sc. study. Also, I would like to thank Gürsel group; especially Begüm Han Horuluoğlu, Gözde Güçlüler,Defne Bayık, Banu Bayyurt, Dr. Gizem Tinçer König, Dr, Fuat Cem Yağcı and Kübra Almacıoğlu for their support and their friendships.
I am also grateful to Merve Mutlu, Nilüfer Sayar, Deniz Cansen Yıldırım, Pelin Telkoparan, Dilan Çelebi, Gurbet Karahan, Sıla Özdemir, Verda Ceylan Bitirim, Seda Koyuncu, Erdem Murat Terzi, and Seçil Demirkol for their supports.
I would also like to thank Füsun Elvan, Bilge Kılıç, Sevim Baran, and Abdullah Ünnü in the Department of Molecular Biology and Genetics for their invaluable help. I would like to express my deepest love and thankfulness to my family, my mother Buket, my father Şükrü and my best friend, little sister Cemre for their invaluable and everlasting support. In addition, I would like to thank to my dearest friend, Erdem for his support and patience.
vi
Finally, I would like to thank The Scientific and Technological Research Council of Turkey (TÜBİTAK) for supporting me during my master study through BİDEB 2210 scholarship.
vii
TABLE OF CONTENTS
ABSTRACT ... ii
ÖZET... iii
TABLE OF CONTENTS ... vii
LIST OF TABLES ... xi
LIST OF FIGURES ... xii
INTRODUCTION ... 1
1.1 Hepatocellular Carcinoma ... 1
1.1.1 Epidemiology of Hepatocellular Carcinoma ... 1
1.1.2 Aetiologies and Risk Factors of Hepatocellular Carcinoma ... 2
1.1.3 Molecular Pathogenesis of Hepatocellular Carcinoma ... 5
1.1.4 Genetics of Hepatocellular Carcinoma ... 6
1.2 Cancer Stem Cells ... 7
1.2.1 Cancer Stem Cells in HCC and Possible CSC Markers ... 8
1.2.2 Prominin 1 (CD133) ... 10
1.2.3 EpCAM (CD326) ... 10
1.3 Signaling Pathways in CSCs ... 11
1.3.1 Wnt Pathway ... 11
1.3.2 Transforming Growth Factor (TGF)- Pathway ... 12
1.3.3 Fibroblast Growth Factor Receptor (FGFR) Signaling Pathway... 13
1.4 Suppressive Oligodeoxynucleotides (ODNs) ... 14
1.4 Aim of the Study ... 15
MATERIALS AND METHODS ... 16
viii
2.1.1 General Laboratory Reagents ... 16
2.1.2 Cell Culture Materials and Reagents ... 16
2.1.3 Spectrophotometry ... 17
2.1.4 Antibodies ... 17
2.1.5. Immunoperoxidase Staining Reagent ... 19
2.1.6. Suppressive Oligodeoxynucleotide and Control Oligodeoxynucleotide .. 19
2.2 SOLUTIONS AND MEDIA ... 20
2.2.1 General Solutions ... 20
2.2.2 Tissue Culture Solutions ... 20
2.2.3 Immunoperoxidase Solutions ... 22
2.2.4 Immunofluorescence Staining Solutions ... 22
2.2.5 Sodium Deodecyl Sulphate (SDS) – Polyacrylamide Gel Electrophoresis (PAGE) and Immunoblotting Solutions ... 23
2.2.6 Flow Cytometry Analysis Solutions ... 25
2.2.7 Single Cell Isolation from Xenograft Tumor Solutions... 25
2.3 METHODS ... 26
2.3.1 Tissue Culture Methods ... 26
2.3.2 Total RNA Extraction from Cultured Cells ... 29
2.3.3 Immunoperoxidase Staining Assay ... 29
2.3.4 Immunofluorescence Staining Assay... 29
2.3.6 Western Blotting ... 30
2.3.7 Flow Cytometry Analysis ... 31
2.3.8 Antibody Conjugation... 32
2.3.9 RNA Sample Preparation and Hybridization to Chip ... 32
ix
2.3.11 In vivo Tumorigenicity Assay ... 34
2.3.12 Single Cell Isolation from Xenograft Tumors ... 34
RESULTS ... 35
3.1 CD133 as a Cancer Stem Cell Marker in Hepatocellular Carcinoma ... 35
3.1.1 Screening of Hepatocellular Carcinoma Cell Lines for CD133 Positivity 35 3.1.2 Confirmation of Screening Results by Flow Cytometry Analysis ... 38
3.2 Effects of Different Signaling Pathways on CD133 Positive Population ... 40
3.3 Studies on HepG2 Parental Cell Line and Its Clone HepG2-2215 ... 41
3.3.1 Effects of Serum Starvation Model on HepG2 and HepG2-2215 Cell Lines ... 42
3.3.2 Efforts to delineate differential expression of CD133 between HepG2 and HepG2-2215... 45
3.3.3 Efforts to Understand the Relatedness of Oval Cells with CSCs ... 47
3.4 Effect of CD133+ Levels on Tumor Formation Ability ... 49
3.4.1 Flow Cytometry Analysis of Xenograft Tumor Tissues ... 53
3.5 Microarray Study between HepG2 and HepG2-2215 Cell Lines ... 56
3.5.3 FGFR Signaling Pathway ... 58
3.6 Effects of Suppressive ODN on CD133 Frequency of HepG2 and HepG2-2215 ... 65
DISCUSSION ... 68
4.1. Identification of Cancer Stem Cells in HCC-derived Cell Lines ... 68
4.2 Effects of Wnt Signaling Pathway on CD133+ Cell Population ... 69
4.3 Effects of TGF- Signaling Pathway on CD133+ Cell Population ... 70
4.4 Studies on HepG2 and HepG2-2215 Cell Lines ... 71
4.5 Microarray Study between HeppG2 and HepG2-2215 Cell Lines ... 73
x
REFERENCES ... 78
APPENDIX ... 85
APPENDIX A ... 85
Appendix A1. Negative Effects of Wnt Pathway Activation ... 85
Appendix A2. Negative Effects of TGF- Pathway Activation ... 88
Appendix A3. Flow Cytometry Analysis of Xenograft Tumor Tissues ... 91
Appendix A4. Gene Set Enrichment Analysis of Microarray Study ... 92
xi
LIST OF TABLES
Table 1.1: List of CSC markers in HCC and their possible functional roles. Adapted
from [36] ... 8
Table 2.1: Antibody list, catalog numbers and working dilutions ... 17
Table 2.2: List of ODNs used in this study. ... 19
Table 2.3: List of curated gene sets and their content. ... 33
Table 3.1: CD133 frequencies of 6 HCC-derived cell lines. ... 40
Table 3.3: List of gene numbers that were enriched in either HepG2 or HepG2-2215 in curated gene set lists. ... 57
Table 3.4: Differentially expressed FGFR signaling pathway. ... 58
Table A4.1: Differentially expressed gene sets belonging to development or differentiation category. ... 92
Table A4.2: Differentially expressed gene sets belonging to stem cells category. .. 92
Table A4.3: Differentially expressed gene sets belonging to signaling pathways category. ... 93
Table A4.4: Differentially expressed gene sets belonging to viral infection, HCC or cancer category... 95
xii
LIST OF FIGURES
Figure 1.1: Different targets of HBx protein. Adapted from [12]... 3 Figure 1.2: Key signal transduction pathways involved in pathogenesis of HCC. Adapted from [25]. ... 5 Figure 3.1: Immunoperoxidase staining of 17 HCC-derived cell lines with CD133 antibody; photomicrographs were taken under bright field microscope, 40X. Cell lines were ranked based on CD133 staining intensities. ... 38 Figure 3.2: Flow Cytometry analysis of 17 HCC cell lines with CD133-APC
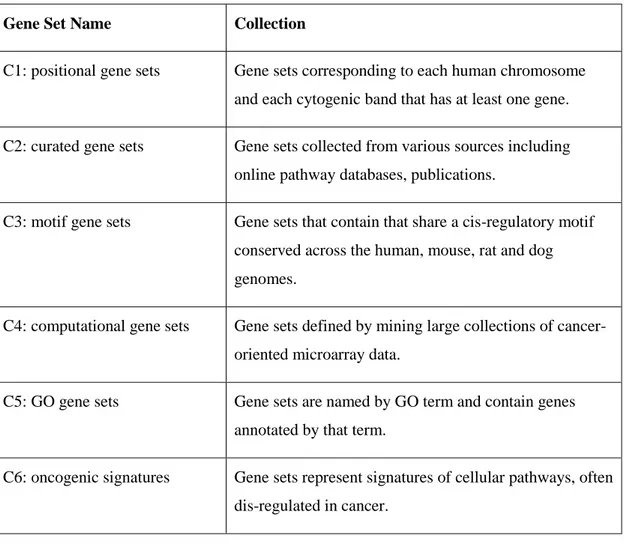
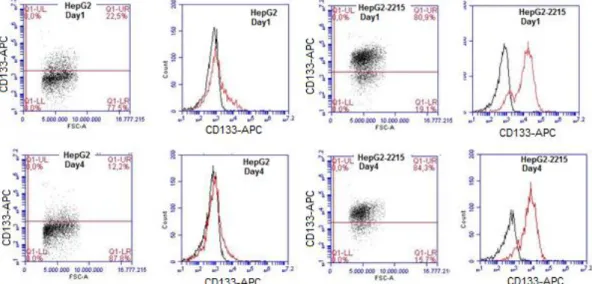
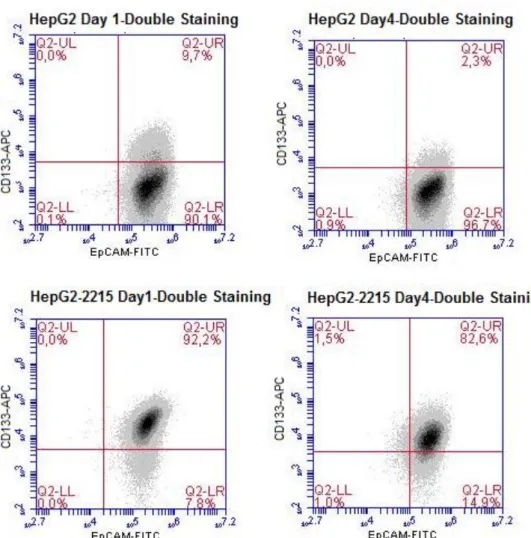
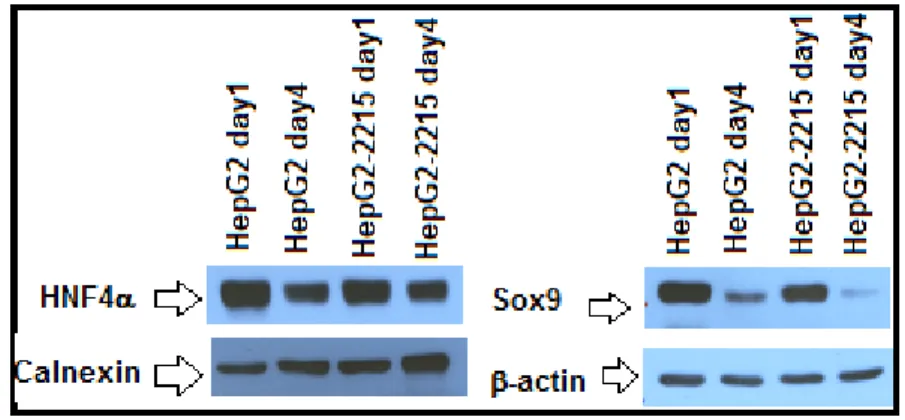
detection. Cell lines were ranked based on CD133 staining intensities. ... 40 Figure 3.3: Detection of CD133+ and/or EpCAM+ subpopulations in parental HepG2 and its derivative HepG2-2212 cell lines by flow cytometry analysis... 42 Figure 3.4: Effects of serum starvation model on CD133 levels of HepG2 and HepG2-2215 by flow cytometry analysis. ... 43 Figure 3.5: Effects of serum starvation procedure on CD133/EpCAM levels of HepG2 and HepG2-2215 by flow cytometry analysis. ... 44 Figure 3.6: Possible effects of soluble factors from HepG2 and HepG2-2215 media on CD133 levels in HepG2 by flow cytometry analysis. ... 46 Figure 3.7: Possible effects of soluble factors from HepG2 and HepG2-2215 media on CD133 levels in HepG2-2215 by flow cytometry analysis. ... 46 Figure 3.8: Expression levels of HNF4 and Sox9 in HepG2 and HepG2-2215 cell lines by Western blot. ... 47 Figure 3.9: Expression levels of HNF4 and Sox9 in HepG2 and HepG2-2215 cell lines by Immunofluorescence. Fluorescent microscopy, 40X. ... 48 Figure 3.10: A) Tumor growth kinetics of HepG2 and HepG2-2215 cell lines. (Bold lines, left side/HepG2; dashed lines, right side/HepG2-2215). B) Comparison of tumor volumes of HepG2 or HepG2-2215 derived tumors on day 23 and day 46. C) Average tumor weights of tumors derived from HepG2 or HepG2-2215. ... 50
xiii
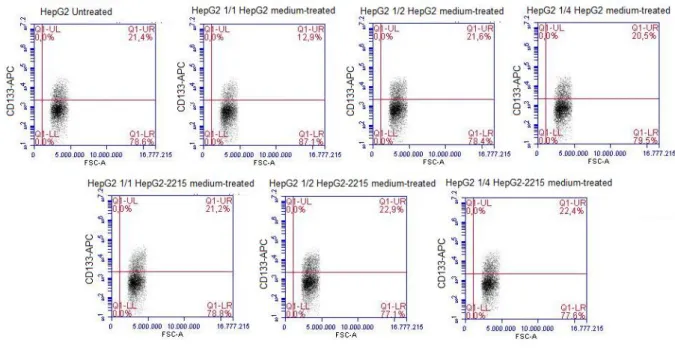
Figure 3.11: The representative photos of tumors that were collected from xenograft nude mice. ... 52 Figure 3.12: Differential CD133+ levels of HepG2- and HepG2-2215-derived tumors. ... 54 Figure 3.13: Differential CD133/EpCAM levels of HepG2- and HepG2-2215-derived tumors. ... 55 Figure 3.14: Representative heatmap of microarray analysis between HepG2 and HepG2-2215 cell lines... 56 Figure 3.15: Expression levels of P-FGFR in HepG2 and HepG2-2215 cell lines by Western blot analysis. ... 59 Figure 3.16: Expression levels of P-FGFR in HepG2 and HepG2-2215 cell lines by Western blot analysis. ... 59 Figure 3.17: Effects of inhibition of FGFR signaling pathway via SU5402 treatment for 48 hours on CD133/EpCAM levels in HepG2 by flow cytometry. ... 60 Figure 3.18: Effects of inhibition of FGFR signaling pathway via SU5402 treatment for 48 hours on CD133/EpCAM levels in HepG2-2215 by flow cytometry. ... 61 Figure 3.19: Effects of inhibition of FGFR signaling pathway via siRNA treatment against FGFR2 on for 72 hours CD133/EpCAM levels in HepG2 by flow cytometry. ... 63 Figure 3.20: Effects of inhibition of FGFR signaling pathway via siRNA treatment against FGFR2 for 72 hours on CD133/EpCAM levels in HepG2-2215 by flow cytometry... 64 Figure 3.21: Effects of suppressive ODN (A151) on CD133/EpCAM levels in HepG2. ... 66 Figure 3.22: Effects of suppressive ODN (A151) on CD133/EpCAM levels in HepG2-2215. ... 66 Figure A1.1: Differential Effect of Wnt-signaling pathway in response to activator or inhibitor treatment on CD133 expression levels of Huh7 via immunoperoxidase procedure. Bright field microscope, 40X. ... 86
xiv
Figure A1.2: Differential Effect of Wnt-signaling pathway in response to activator or inhibitor treatment on CD133 expression levels of Huh7 (p<0.05, NS=not
significant)... 87 Figure A2.3: Effects of TGF- signaling pathway in response to activator and inhibitor on CD133 levels of Hep3B and Hep3B-TR cell lines by immunoperoxidase. Bright field microscopy, 40X. ... 89 Figure A2.4: Effects of TGF-b signaling pathway on CD133+ cell frequency in Hep3B and Hep3B-TR cell lines by flow cytometry analysis in panel A. Data was statistically analyzed with Student’s t test, p<0.01, panel B. ... 89 Figure A3.5: Detection of M1/M2 macrophage levels of HepG2- and HepG2-2215-derived tumor samples by flow cytometry analysis. ... 91 Figure A5.6: Effects of suppressive ODN (A151) treatment on CD133/EpCAM levels of HepG2 and HepG2-2215 cell lines by flow cytometry analysis. ... 96
1
CHAPTER 1
INTRODUCTION
1.1 Hepatocellular Carcinoma
1.1.1 Epidemiology of Hepatocellular Carcinoma
Liver is the largest internal organ in the body and performs many essential roles in digestion, metabolism, immunity and so on [1]. Cancers originate in the liver are called liver cancer. Hepatocellular carcinoma (HCC) is the most common type of primary liver cancers with 80-90% of occurrence in all cases [2]. It is the sixth most commonly occurring cancer and ranked as the third leading cause of cancer-related deaths worldwide [3]. Unfortunately, there are limited treatment options, such as tumor resection, liver transplantation, radiofrequency ablation, and because of high number of patients diagnosed with the disease at advance stage, approximately one third of them are eligible for treatments with 14% overall 5-year survival rate [3, 4]. With age, occurrence rate of HCC increases greatly with the highest prevalence among the population over age of 65 [5]. In addition to the age, sex is a significant factor with a higher occurrence ratio in men.
2
1.1.2 Aetiologies and Risk Factors of Hepatocellular Carcinoma
Many intrinsic and extrinsic factors interact with each other at molecular level which causes hepatocarcinogenesis [4, 6]. Thus, aetiological factors leading to HCC are complex. Among them, infection with hepatitis B (HBV) and C virus (HCV) contributes to 70% of all cases [7]. Beside these factors, alcohol abuse, aflatoxin contaminated food consumption, immune related factors, metabolic diseases, such as diabetes and obesity, are also other risk factors of HCC [2]. Although all these factors are linked to the incidence of HCC, their efficacy and prevalence depend on the geographical conditions. While HBV infection is the major factor in most Asian and African countries, in Europe and United States, HCV infection is the primary reason for the incidence of HCC [8]. Also, while alcohol abuse is a more common factor in western countries, dietary aflatoxin consumption is more common in South China and Africa [7].
1.1.2.1 Viral Hepatocarcinogenesis
Chronic infection with hepatitis B virus (HBV) or hepatitis C virus (HCV) is the leading etiology for the HCC [9]. And the incidence of HCC parallels with the geographic distribution of these infections. 80-90% of HCC patients were infected with HBV and HCV that promote cirrhosis, initially [10]. HBV and HCV are two unrelated viruses that target liver and reside in hepatocytes [11]. HBV is a small DNA virus, that belongs to hepadnaviridae family and its transmission occurs via contaminated blood products or sexual contact [9]. The virus has 3.2 kb genome consisting of four overlapping open reading frames. Previous studies suggested that chronic HBV infection might increase the risk of HCC up to 100 fold [9, 10]. Integration of HBV DNA can induce chromosomal instability and it allows persistence of the virus [12]. Recent data suggested that HBV is targeting several gene families, such as the telomerase-encoding gene, genes involved in calcium homeostasis, and thus, the expression of some of these target genes are deregulated [12]. Hepatitis B virus X protein (HBx) is 154 amino acid viral protein that has vital
3
roles in HBV infection, replication and it is also linked to liver carcinogenesis (Fig. 1.1) [9]. The oncogenic potential of HBx can be categorized into four groups; trans-activation or repression of cell survival and proliferation genes, interaction with proteins that have roles in cellular response to oncogenic stress, activation of cell survival signaling pathways and epigenetic changes including DNA methylation, histone modification and microRNA expression [9, 12].
Figure 1.1: Different targets of HBx protein. Adapted from [12].
On the other hand, hepatitis C virus is a positive-sense, enveloped, single-stranded RNA virus, a member of the Hepacivirus genus of the Flaviviridae family [13]. Its genome is 9.6 kb in length and it is associated with a 15- to 20-fold increase in risk for HCC [10]. HCV infection induces several cellular responses, such as ER stress and UPR, autophagy, apoptosis, cell cycle arrest and DNA damage, mitogenic signaling, and PI3K pathway [13].
Thus, HBV and HCV infections together are the strongest risk factors for developing HCC by changing gene expression in liver [11]. These changes includes alterations in DNA methylation, changes in miRNA expression profiles and the constitutive activation of numerous signal transduction pathways [9].
1.1.2.2 Role of Alcohol in Hepatocarcinogenesis
Chronic heavy alcohol consumption is closely associated with hepatocarcinogenesis. Alcohol causes changes in liver structure, especially in hepatocytes [14]. In ethanol
4
metabolism in liver, ethanol is oxidized by cytochrome P450 2E1 (CYP2E1), generating reactive oxygen species (ROS) [15]. ROS are the most potent agents that can alter DNA methylation patterns in liver [15]. Also, ROS play major role in telomere shortening and favor mutations in oncogenes [2, 14]. Also, chronic alcohol ingestion is associated with enhanced inflammation causing activated monocytes which generates pro-inflammatory cytokines [14]. These cytokines activate Kupffer cells to produce chemokines that have opposite effects on hepatocyte survival [16].
1.1.2.3 Role of Aflatoxin in Hepatocarcinogenesis
Aflatoxins are major mycotoxins that are naturally occurring metabolic byproducts of Aspergillus flavus and Aspergillus parasiticus [17]. Aflatoxins can be found ubiquitously in staple foods, including maize, rice, and ground nuts [18]. Aflatoxin contamination of crops usually occurs in the regions where food drying and storage facilities are not in optimal conditions. They are the most common food-borne risk factor [17]. Exposure to aflatoxin B1 contamination of foods correlates well with the incidence of HCC. The effect of aflatoxin B1 on hepatocarcinogenesis is linked to the mutation caused by aflatoxin exposure in AGG to AGT transversion mutation at codon 249 of the p53 gene [19].
1.1.2.4 Other Factors Inducing Hepatocarcinogenesis
Other than these factors associated with HCC, there are other risk factors implemented to play a role in hepatocarcinogenesis. Diabetes is one of those factors that is thought to promote the onset of HCC with an effect of 2-3 fold increase [20]. Obesity is also a risk factor with diabetes and the reason for this predisposition is possibly caused by insulin resistance that is reduced insulin sensitivity and as a consequence, increased secretion; and accumulation of free fatty acids [21]. Thus, liver fibrosis develops through dysfunctional effects on liver homeostasis.
5
In addition to diabetes, non-alcoholic steatohepatitis and non-alcoholic fatty liver diseases are likely to promote hepatocarcinogenesis by contributing liver fibrosis and development of cirrhosis [22]. Also, hereditary heamochromatosis, a common genetic disorder, is linked to hepatocarcinogenesis because of excessive iron absorption in hepatocytes [23]. Another inherited genetic disorder which promotes HCC development is alpha1-antitrypsin deficiency. This disease causes antitrypsin polymers formation in liver and as a consequence hepatocyte fatality triggering cirrhosis [24].
1.1.3 Molecular Pathogenesis of Hepatocellular Carcinoma
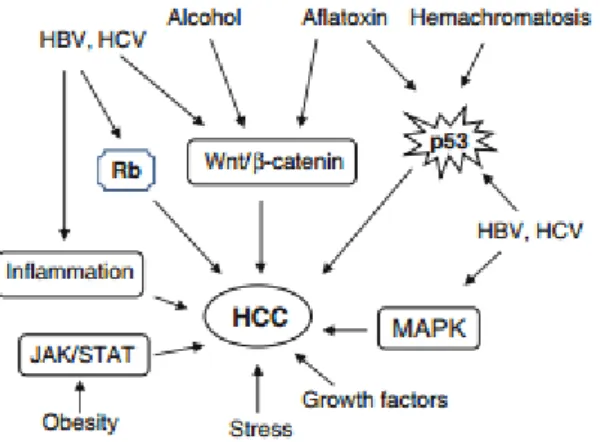
Molecular pathogenesis of HCC is rather complex including different risk factors and modulations, such as mutations, altered pathways, epigenetic changes, genetic changes and chromosomal aberrations (Fig. 1.2) [2]. Accumulation of these changes leads to neoplastic state in normal, non-cirrhotic and cirrhotic-livers. Actually basis of hepatocarcinogenesis is damaged hepatocytes that start proliferating and regenerating in high frequencies. This increased regeneration activity causes cirrhosis, and then dysplasia, and finally HCC [3].
Figure 1.2: Key signal transduction pathways involved in pathogenesis of HCC. Adapted from [25].
6
Transition from normal liver to HCC liver is a multistep process that starts from genetic changes in cirrhotic liver which proceeds into hepatocarcinogenic liver with accumulating changes in the liver [26]. These changes includes mutations that cause genetic alterations, aberrant expression of cellular proteins, overexpression of oncogenes, inhibition of tumor suppressors, and molecules such as microRNAs and various cellular proteins [27]. There are number of critical signaling pathways activated in HCC as well as mutations that inactivates tumor suppressors, such as p53, Rb1, CDKN2A, IGF2R, PTEN; and activates oncogenes like -catenin, Axin1, PI-3-kinase and K-ras [25]. In the initial steps of HCC, HBV/HCV infections, alcoholic liver cirrhosis, and amplified signaling pathways, such as transforming growth factor alpha and insulin-like growth factor 2, boosts hepatocyte proliferation. These initial steps cause oncogenic activation, instable chromosomes and DNA rearrangements [27]. Further DNA damages induced by oxidative stress and chronic inflammation occur in hepatocytes [25]. Activation of survival and proliferation pathways along with uncontrolled telomerase activity provides unlimited proliferative capacity for these transformed cells [26].
1.1.4 Genetics of Hepatocellular Carcinoma
Initial studies showed that HCC is highly associated with genetic aberrations, chromosomal abnormalities and chromosomal instability. Common alterations include chromosomes 1q, 5, 6p, 7, 8q, 17q and 20 with chromosomal gains whereas 1p, 4q, 6q, 8p, 13q, 16, 17p and 21 are deletion sites [28]. On the other hand, HBV infection often results in integration into host genome which may have cis and trans effects. It is observed that HBV genome integration generally take place within or upstream of TERT (telomerase reverse transcriptase) gene which is the most likely reason of increased telomerase activity [2]. There are a few somatic mutations that are associated with hepatocarcinogenesis. TP53 was the first mutated gene discovered in HCC [29]. TP53, CTNNB1 which encodes for -catenin and AXIN1 genes display small deletions or point mutation while CDNK2A gene exhibits homozygous deletions and epigenetic silencing [28].
7
1.2 Cancer Stem Cells
In the traditional way, cancer initiation and the progression was explained by the stepwise process of accumulation of genetic and epigenetic changes [30]. This way, cell enters a dedifferentiation state where it gains uncontrollable proliferative ability and tumor formation ability. Thus, this stochastic model suggests that once a random mutation and subsequent clonal selection have taken place, each cell would be equal in terms of forming a new tumor. However, findings in cellular hierarchy and tumor heterogeneity have led to a new model which proposes that only a subpopulation of cells have the ability to self-renew, differentiate and regenerate [31]. This model is the cancer stem cell (CSC) hypothesis which suggests that tumors are organized similarly to normal tissues [32]. Cancer stem cells have the similar capabilities as stem cells, such as self-renewal, giving rise to heterogeneous progeny and dividing in unlimited fashion [33]. CSC hypothesis has been recently validated with various experiments including identification of stem cell marker positivity with hierarchy, serial in vitro clonogenic growth, and in vivo tumorigenicity [33]. These experiments showed that tumor can be initiated from a single cell, cancer stem cell that is also names as tumor initiating cell (TIC) [30]. The first data demonstrating the existence of CSCs was obtained from acute myeloid leukemia (AML) [32]. Studies showed that leukemia stem cells from AML patients are both self-maintaining and can reconstitute all different phenotypes in consistence with CSC model. Meanwhile, similar observations were made in different types of cancers, including breast cancer and glioma [32].
8
1.2.1 Cancer Stem Cells in HCC and Possible CSC Markers
Like other solid tumors, HCC is thought to contain cancer stem cells (CSCs) as a distinct subpopulation of tumor cells that are capable of tumor relapse and metastasis due to the their abilities to self-renew, differentiate and give rise to a new tumor in local and distant sites [34]. CSCs are identified as tumor initiating properties which inoculations of these cells have continuous cell growth in serial transplantation [35]. These cells are very few in the tumors while the rest of the tumor bulk cannot initiate tumor growth, which are considered to be non-tumorigenic [35].
The first treatment option for HCC is either liver transplantation or surgical resection. However, most HCC patients are at advanced stages which make them inoperable [36]. Other treatment option is chemotherapy but HCC remains largely incurable because of late presentation and tumor recurrence [37]. Also, HCC has chemotherapy-resistant nature with high recurrence rate. The current existing therapies against HCC are generally targeting tumor bulk rather than CSCs [36]. Thus, remaining CSCs lead to re-growth of the tumor. So, isolating and targeting CSCs is very important for better treatment options. A number of molecular markers have been identified for CSCs in HCC, including CD133, epithelial cell adhesion molecule (EpCAM), CD90, CD44, CD13, CD24, OV6, granulin-epithelin precursor (GEP), and Delta-like 1 homolog (DLK1) [36].
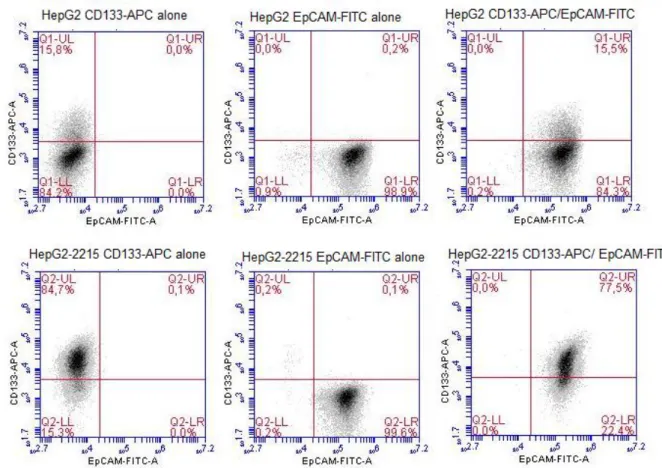
Table 1.1: List of CSC markers in HCC and their possible functional roles. Adapted from [36]
Marker Possible Functional Role
CD133 Self-renewal, tumorigenicity, chemo-resistance and invasiveness
EpCAM Invasiveness, self-renewal, and tumor formation
9
CD44 Tumor formation, chemo-resistance and metastasis CD13 Self-renewal, cell proliferation, and tumor formation CD24 Tumor formation, self-renewal, chemo-resistance, and
metastasis
OV6 -
GEP Self-renewal, chemo-resistance, tumor growth DLK1 Cell proliferation, self-renewal, tumor formation and
tumor growth
CD90 (Thy-1) is 25-37 kDa glycosylphosphatidylinositol-anchored cell surface protein [34]. It has been considered as a marker for various stem cells including CSC in HCC and recent data suggests that there is a positive correlation between CD90 expression with self-renewal, tumorigenicity and metastasis [34, 36]. Meanwhile, CD44 has been associated with various cancer functions, especially metastasis [36]. It is a cell surface glycoprotein and it acts as a receptor for hyaluronic acid and CD44 is a marker in combinations with other CSC markers [34]. CD13 is a newly identified functional marker which can be used to identify dormant liver CSCs resistant to treatments [35]. CD24 is a mucin-like cell surface glycoprotein that has been linked to self-renewal and chemo-resistance [34]. OV6 is a marker for oval cells and it is used widely as hepatic stem cell marker [36]. GEP is a hepatic oncofetal protein that is expressed in fetal liver and associated with recurrence of HCC [36]. Finally, DLK1 is a hepatic stem cell marker that is also expressed in fetal liver.
10 1.2.2 Prominin 1 (CD133)
CD133 is a member of the prominin family of pentaspan transmembrane glycoprotein that is also known as Prominin 1 (PROM1) [38]. Even though its specific function and ligands are still unknown, CD133 is firstly found hematopoietic stem/progenitor cell marker [38]. CD133 is found in various cancer types, such as brain, prostate, pancreas, colon and liver as CSC marker [34]. Previously, it has been shown that during early liver regeneration, CD133 is up-regulated in liver tissue [36]. Functional studies with CD133+ cell fraction isolated from Huh7 cell line demonstrated that these cells have significantly greater tumorigenicity potential in vitro and in vivo, than CD133- cells [39]. It has been also found that CD133+ cells have higher colony-forming efficiency and proliferation ability [37, 38]. Further studies revealed that CD133+ cells are more chemo-resistant and radio-resistant because of preferential activation of certain survival pathways, such as AKT/PKB, BCL-2 and MAPK/PI3K pathways [36]. A recent study showed that when compared to its CD133- counterparts, CD133+ cells showed higher expression of stem cell associated genes ( Bmi-1, Notch, Sox2, Oct 4, Nanog, -catenin, Smo, Nestin, ABCG2 and ABCB1) as well as they have the ability to form undifferentiated tumor spheroids [38].
1.2.3 EpCAM (CD326)
Epithelial cell adhesion molecule EpCAM (murine CD326) is a type I transmembrane glycoprotein with a large extracellular, a single transmembrane and a short intracellular domain [40]. It is known to be expressed in almost all of carcinomas while it is also expressed in embryonic liver, bile duct epithelium and proliferating bile ductules in cirrhotic liver [34]. Recent findings suggest a role for EpCAM as an early biomarker for HCC because of its high expression in premalignant hepatic tissues [34]. EpCAM+ HCC cells have been shown to possess ability of self-renewal, differentiate and initiate tumors [36]. EpCAM plays a role in
11
cell proliferation, migration and mitogenic signal transduction. EpCAM also has been shown that it is a direct transcriptional target for Wnt/-catenin signaling pathway [39, 41]. Further studies with microarray analysis with primary HCC tissue demonstrated that EpCAM+ HCC was associated with gene signature and the molecular pathway of hepatic progenitor cells. Meanwhile EpCAM- HCC cells were linked to mature hepatocytes [37].
1.3 Signaling Pathways in CSCs
During hepatocarcinogenesis, two main pathogenic mechanisms are observed. First one is cirrhosis associated with hepatic regeneration after tissue damage caused by several reasons, such as exposure to toxins, viral infections or metabolic influences, while the other mechanism is the occurrence of mutations in single or multiple oncogene or tumor suppressors [42]. In HCC, many major signaling pathways implicated, including Wnt/-catenin, PI3K/AKT1/mTOR, RAF/MKK1/MAPK3, IGF-1, HGF/c-MET and TGF- [42]. Interestingly, many of these pathways are known to be involved in stem cell maintenance self-renewal and pluripotency, such as MET, Hedgehog, MYC, p53, EGF, Wnt/-catenin, TGF-, etc [41]. Many of these signaling pathways are also found in CSCs which also suggest that these pathways should be investigated in HCC CSCs.
1.3.1 Wnt Pathway
The Wnt pathway is a highly conserved signaling pathway whose first member was identified in fruit fly [43]. The Wnt family consists of 19 Wnt ligands identified and the intracellular signaling is maintained via two different pathways; “canonical” and “non-canonical” [43]. The canonical Wnt pathway is activated by the binding of Wnt ligands to the transmembrane Frizzled receptor and its co-receptor LRP 5 or 6, and then, scaffolding protein Dishevelled (Dvl) is recruited. This stabilizes destruction complex composed of APC, AXIN1, GSK3 and CSNK1A1 which normally
12
phosphorylates -catenin leading to its ubiquitination and degradation [32, 44]. Thus, stabilized b-catenin translocated to nucleus in order to regulate transcription with TCF/LEF complex [44]. Wnt signaling plays an important role in embryonic development, growth, survival, regeneration, and self-renewal as well as in tumor development. It has been shown that several Wnt ligands were expressed by various liver cells, and Wnt/-catenin pathway plays a crucial role in prenatal development, hepatic fate specification of stem cells and liver organogenesis [43]. Aberrant activation of Wnt pathway is a factor participating HCC development [45]. Disrupted Wnt pathway by mutational or non-mutational events is observed in one third of all HCCs [46]. Activation of canonical Wnt pathway drives tumor formation in liver stem cells and the higher -catenin expression was found in HCC than non-tumor tissues [47]. The Wnt pathway also plays a crucial role in regulating stem/progenitor cell expansion as well as the determination of self-renewal or differentiation [48]. The elevated expression of Wnt and its downstream mediators were found in CD133+ or EpCAM+ HCC cells which suggest that Wnt/-catenin signaling pathway is implicated in HCC CSCs [41].
1.3.2 Transforming Growth Factor (TGF)- Pathway
Transforming growth factor (TGF)- superfamily consists of TGF-s, activins, inhibins, Nodal, bone morphogenic proteins (BMPs) and anti-Müllerian hormone (AMH) and regulates many cellular functions, including cell growth, differentiation, apoptosis, extracellular matrix (ECM) production, immunity and embryonic
development [49]. Canonical TGF- pathway is activated via binding of TGF- ligand to the heteromeric receptor complex which phosphorylates receptor activated SMAD (R-SMAD) proteins. Activated R-SMADs together with SMAD4 translocates to nucleus to act as transcription factor complex [50]. TGF- signaling pathway has a role in cell cycle regulation, the immune system and apoptosis. In HCC, it plays a crucial role in inhibiting oncogenesis at an early stage by inducing apoptosis and activates autophagy in certain HCCs in order to suppress tumor formation [47]. On the other hand, dysregulation of TGF- signaling is associated with
13
hepatocarcinogenesis [51]. TGF- signaling pathway is involved in self-renewal, differentiation and carcinogenesis [52]. Also, TGF- co-operates with oncogenic RAS to activate nuclear -catenin, which causes neoplastic hepatocyte differentiation into immature progenitor cells and facilitates HCC recurrence [47]. Finally, TGF- plays a crucial role in maintenance of CSCs in HCC and it has been shown that lack of responsiveness to TGF- led to the generation of CSCs [41].
1.3.3 Fibroblast Growth Factor Receptor (FGFR) Signaling Pathway
Fibroblast growth factor (FGF) superfamily consists of structurally related polypeptides where most of them function through fibroblast growth factor receptors (FGFRs) [53]. In humans, FGFs are encoded by 22 genes which are divided into 7 subfamilies. FGFRs are transmembrane tyrosine kinase receptors and are activated by binding of FGF ligands [54]. Binding of FGFs to FGFRs activates downstream signaling, enabling trans-phosphorylation of tyrosines in the intracellular part of receptor and these phophorylated tyrosine residues act as docking sites for various adaptor proteins which promotes activation of different signaling pathways, including Ras/Raf/MAPK, PI3K signaling pathway [54]. Thus, FGFR signaling pathway promotes cell growth, epithelial-mesenchyme transition and survival [56]. FGFR2 isoform b (FGFR2-IIIb) is highly expressed in hepatocytes and plays a crucial role in liver homeostasis and regeneration [55]. Studies showed that alterations in FGFR signaling pathway could lead to cancer [54]. Some of the FGF ligands are up-regulated in HCC and have been shown to initiate autocrine growth stimulation, cell survival and neo-angiogenesis [57]. Moreover, some FGF ligands were associated with more aggressive behavior of malignant hepatocytes and this might involve Wnt signaling pathway as well [58].
14
1.4 Suppressive Oligodeoxynucleotides (ODNs)
Normally, DNA is isolated via nuclear or mitochondrial membrane in eukaryotes, or by the cell wall in bacteria or the envelope in viruses. However, following a microbial infection or tissue damage, DNA can be released [59]. In this case, due to its high unmethylated CpG motif frequency, bacterial DNA can be recognized as “non-self” via TLR9 and trigger an innate immunity response. This CpG-driven-immune activation can exacerbate inflammatory tissue damage, or increasing sensitivity to autoimmune diseases or toxic shock [60].
On the other hand, some immune responses are designed to protect the host. Previous studies suggested that some antagonistic elements are present in the host DNA possibly to suppress DNA-driven immunostimulation [61]. Thus, these neutralizing or suppressive motifs can block CpG-mediated immune system selectively [62]. These suppressive motifs are rich in poly-G or –GC sequences, and surprisingly, optimal motifs are identical to telomere motifs (with a repeat of TTAGGG) [63]. It has been shown that suppressive oligodeoxynucleotide (ODN) (A151) inhibits the production of several pro-inflammatory cytokines and chemokines induced by bacteria [63]. So, in different autoimmune and inflammatory diseases, the effects of suppressive ODN (A151) have been studied. Over the last few years, suppressive ODN (A151) has been studied in cancer types, especially in cancers that inflammation plays a crucial role. It has been shown that suppressive ODN can be used in inflammation associated oncogenesis [64]. This observation was supported with other studies showing that suppressive ODN can improve the anti-proliferative effects of anticancer drugs [65]. Meanwhile another study showed that suppressive ODNs actually repress fibrosis and down-regulates stemness (Aydin, M. et al., unpublished data).
15
1.4 Aim of the Study
Like other solid tumors, HCC has been shown to possess a small subpopulation of cancer stem cells that are responsible from initiation, maintenance and recurrence of tumor [36]. These cells also show the ability to self-renew, give rise to different phenotypes of cells which accomplish tumor heterogeneity and chemo- or radio-resistance. After the initial treatment, these CSCs are the ones who resisted the therapy and provided the re-growth of tumor. Thus, the idea of targeting these cells might be a better therapeutic approach along with traditional treatment methods in order to achieve better cure rate for the disease.
However, targeting these cells requires more knowledge on the characterization of cancer stem cells in HCC. Molecular mechanisms underlying the process of these transformed cells into cancer stem cells might be the direct targets of future treatment methods to reverse this transition or at least it might provide opportunity to make cancer stem cells more vulnerable to the current treatments. The outcomes of this study are expected to make contributions to the field of new therapeutic approaches for HCC.
16
CHAPTER 2
MATERIALS AND METHODS
2.1 MATERIALS
2.1.1 General Laboratory Reagents
Most of the reagents used in this research including Bradford reagent, haematoxylin, ethanol and methanol were purchased from Sigma-Aldrich (St. Louis, MO, USA) and Merck (Darmstadt, Germany). ECL+ blot detection kit and western blot membranes were purchased from Amersham Pharmacia Biotech Company. DMSO and Ponceau S were purchased from Applied Biochemia (Darmstadt, Germany). Fluorescent mounting medium was from Dako (Denmark). Nucleospin RNA II total RNA isolation kit and DNase I was from Macherey-Nagel (Duren, Germany). Collagenase type I was purchased from Sigma-Aldrich (C0130-500MG, St. Louis, MO, USA) and Fixative Medium A was bought from Invitrogen (GAS003, Carlsbad, CA, USA).
2.1.2 Cell Culture Materials and Reagents
Dulbecco’s modified Eagle’s medium (DMEM) and Roswell Park Memorial Institute (RPMI) 1640 medium and OptiMEM were purchased from GIBCO (Invitrogen, Carlsbad, CA, USA). Penicillin/streptomycin antibiotics, L-glutamine, trypsin-EDTA, fetal calf serum (FCS) was also from GIBCO. All plastic materials used in
17
cell culture, such as tissue culture flasks, petri dishes, plates, cryovials were purchased from Corning Life Sciences Inc. (USA). Serological pipettes were from Costar Corporation (Cambridge, UK). RNAi Max was purchased from Invitrogen.
2.1.3 Spectrophotometry
Bradford based protein concentration measurements were done using spectrophotometer Beckman Du640 from Beckman Instruments Inc. (CA, USA).
2.1.4 Antibodies
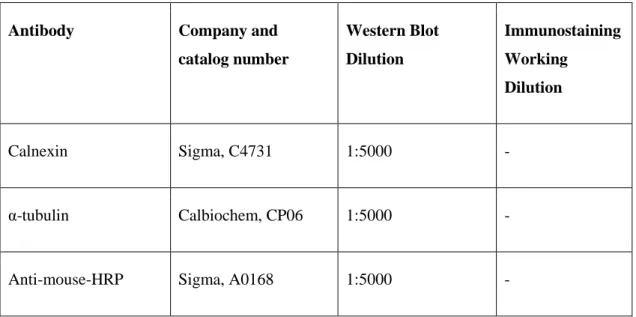
In this study, there are numerous primary and secondary antibodies from various sources. Antibodies, their catalog numbers, and working dilutions are given below in Table 2.1.
Table 2.1: Antibody list, catalog numbers and working dilutions
Antibody Company and catalog number Western Blot Dilution Immunostaining Working Dilution Calnexin Sigma, C4731 1:5000 - α-tubulin Calbiochem, CP06 1:5000 -
18
Anti-rabbit-HRP Sigma, 6154 1:5000 -
Anti-goat-HRP Abcam, ab6741 1:5000 -
Anti-mouse/rabbit-Alexa Fluor 488
Invitrogen, A11034 - 1:750 (IF)
Anti-mouse/rabbit-Alexa Fluor 568
Invitrogen, A11034 - 1:750 (IF)
-actin Sigma, A5441 1:10000 -
P-FGFR R&D Systems 8µg/mL -
Sox9 Millipore, AB5535 1:1000 1:1500 (IF)
HNF4 Santa Cruz
Biotechnologies, sc-6556
1:300 1:150 (IF)
Bek antibody Santa Cruz
Biotechnologies, sc-6930
- 1:30 (Flow Cytometry)
CD133 pure Miltenyi, 130-090-422 - 1:100 (IP, IF)
CD133-APC Miltenyi, 130-090-826 - 1:30 (Flow Cytometry)
EpCAM-FITC Miltenyi, 130-080-301 - 1:30 (Flow Cytometry)
19
Anti-acetylated- -tubulin
Abcam, ab24610 1:2000 -
Anti-Histone H3 Abcam, ab1791 1:5000 -
Anti-acetyl-H4 Millipore, 06-866 1:5000 -
2.1.4.1 Antibody Conjugation Kit
Lightning-Link Atto488 Conjugation kit (733-0010) was purchased from Innova Biosciences.
2.1.5. Immunoperoxidase Staining Reagent
In immunoperoxidase staining experiments; DAKO EnVision+ System was used, DAKO (Glostrup, Denmark).
2.1.6. Suppressive Oligodeoxynucleotide and Control Oligodeoxynucleotide
All oligodeoxynucleotide (ODN) types used in this study listed in Table 2.2 with their working concentrations.
Table 2.2: List of ODNs used in this study.
Name Concentration
20
D35 flip 0.5 - 3µM
Oligodeoxynucleotides (ODN) sequences given below were purchased from either Alpha DNA, (Canada) or NIH or USFDA CBER Core Facility (USA), or synthesized in the Biotherapeutic ODN Research Lab. Facility on a MerMade6 Oligonucleotide synthesizer machine:
A151 5’ TTAGGGTTAGGGTTAGGGTTAGGG 3’ D35 flip- 5’ ggTGCATGCATGCAGGGGgg 3’
2.2 SOLUTIONS AND MEDIA
2.2.1 General Solutions
10X Phosphate Buffered Saline (PBS) 80g NaCL, 2g KCl, 14.4g Na2HPO4, 2.4g
KH2PO4 in 1 litre ddH2O
Working dilution is 1X.
10X Tris buffered saline (TBS) 12.9g Trisma base, 87.76g NaCL, in 1 litre ddH2O, pH is adjusted to 8.0
Working dilution is 1X.
21
DMEM/RPMI media Complete medium contains 10% Fetal calf serum, 1% penicillin/streptomycin, 1% non-essential amino acids, stored at 4 C
Serum free DMEM/RPMI media 0.01% Fetal calf serum, 1% penicillin/streptomycin, 1% non-essential amino acids, 1mM Na2SeO3, stored at 4 C
10X Phosphate buffered saline (PBS) 80g NaCL, 2g KCl, 14.4g Na2HPO4, 2.4g
KH2PO4 in 1 litre ddH2O
Working dilution is 1X, stored at 4 C
2.2.2.1 Preparation of Wnt-3a and WIF1
Reconstitute Recombinant Human Wnt-3a (R&D Systems, 5036-WN/CF) at 200µg/mL in sterile 1X PBS. Working concentration is 250ng/mL. Reconstitute Recombinant Human WIF-1 (R&D Systems, 1341-WF/CF) at 200µg/mL in sterile 1X PBS. Working concentration is 250ng/mL.
2.2.2.2 Preparation of TGF-1 and anti-TGF1 antibody
Reconstitute TGF-1 (R&D Systems, 240-B) at concentration of no more than 10µg/mL in filter-sterilized 4mM HCl containing 1mg/mL bovine serum albumin to ensure complete recovery from glass surfaces. Working concentration is 5ng/mL. Reconstitute TGF-b1 antibody (monoclonal mouse IgG1, R&D Systems, Mab240) at 0.5mg/mL in sterile 1X PBS. Working concentration is 5µg/mL.
22 2.2.2.3 Preparation of SU5402
Reconstitute SU5402 (Santa Cruz Biotechnologies, sc-204308) at 1mM in sterile DMSO. Working concentrations between 2µM to 50µM were tired.
2.2.3 Immunoperoxidase Solutions
Acetone: methanol fixation reagent Acetone and methanol were mixed in 1:1 ratio and stored at -20 C
3% H2O2 solution Dilute 30% H2O2 with methanol and ddH2O.
(For example, 3mL H2O2, 10mL methanol,
and 17mL ddH2O)
Immunoperoxidase blocking solution 10% FCS in 0.3% TritonX-100 in 1X PBS
Washing solution 0.3% TritonX-100 in 1X PBS
Antibody dissolved in 10% FCS in 0.3% TritonX-100 in 1X PBS
DAB solution DAB chromogen and its substrate from Dako were used according to the manufacturer’s protocol
2.2.4 Immunofluorescence Staining Solutions
23
formaldehyde in 450ml ddH2O.
4% Paraformaldehyde Dissolve 4g paraformaldehyde in 100mL ddH2O, heat at 130 C for 1 hour, cool before
use
Immunofluorescence blocking solution 10% FCS in 0.2% PBS-Tween 20
Washing solution 0.2% PBS-Tween 20
Antibody dissolved in 10% FCS in 0.2% PBS-Tween 20
DAPI (4’,6-diamino-2-phenylindole) 0.1-1µg/ml working solution in PBS or ddH2O
2.2.5 Sodium Deodecyl Sulphate (SDS) – Polyacrylamide Gel Electrophoresis (PAGE) and Immunoblotting Solutions
In this study, tris-glycine gels and buffers were prepared manually according to a conventional protocol in our lab. To prepare 5% stacking gel, 30% acrylamide mix, 1.0M Tris-HCl pH 6.8, 10% SDS, 10% ammonium persulphate and ddH2O were mixed in appropriate amounts. For the resolving gels, same ingredients were mixed depending on the gel concentration changing between 8% to 12%, with the exception of using 1.5M Tris-HCl pH 8.8 this time. Wet transfers were done to either PVDF membrane or nitrocellulose. 10X transfer buffer for wet transfer, 5X sample loading buffer and 10X denaturing reagent (500mM DTT) were also purchased from Invitrogen.
10X SDS Running buffer 144g glycine and 30g Tris were dissolved in ddH2O, 50mL 10% SDS was added, and the
24
volume was completed to 1L. Working solution is 1X
10X Transfer buffer 72g glycine and 58g Tris were dissolved in ddH2O, 2mL 10% SDS was added, and the
volume was completed to 1L. Working solution is 1X containing 10-20% Methanol depending on protein size.
Blocking solution 5% (w/v) non-fat dry milk was dissolved in 0.2% TBS-Tween 20, or 5% (w/v) bovine serum albumin (BSA) was dissolved in 0.2% TBS-Tween 20
10X Tris buffered saline (TBS) 12.9g Trisma base, 87.76g NaCl in 1L of ddH2O, working dilution is 1X and pH 8
TBS-Tween 20 0.2% Tween 20 in 1X TBS
Ponceau S 0.1% (w/v) Ponceau S and 5% (v/v) acetic acid was dissolved in 0.2 % TBS-Tween 20
Coomassie brilliant blue solution 100mg coomassie brilliant blue G-250, 50ml 95% ethanol, 100ml 85% phosphoric acid. Filtered using whatman paper
NP-40 lysis buffer 50mM Tris HCl, 150mM NaCl, 1% NP-40, 0.1% SDS, 1X protease inhibitor cocktail
25 2.2.6 Flow Cytometry Analysis Solutions
Fixative Medium A Fix cells, Invitrogen, GAS003
Antibody dissolved in PBS-BSA-NaAzide, prepare by adding 500mg NaAzide and 10g BSA in 1L 1X PBS, store at +4 C
10X Phosphate Buffered Saline (PBS) 80g NaCL, 2g KCl, 14.4g Na2HPO4, 2.4g
KH2PO4 in 1L ddH2O
Working dilution is 1X.
2.2.7 Single Cell Isolation from Xenograft Tumor Solutions
Dissociation Buffer Prepare DMEM containing 10% FCS and dissolve 125U/mL Collagenase type I and 150U/mL DNase I in it, prepare fresh
26
2.3 METHODS
2.3.1 Tissue Culture Methods
2.3.1.1 Cell lines and growth condition of cells
Hepatocellular carcinoma cell lines used in this study were cultured in either DMEM or RPMI media supplemented with 10% fetal calf serum (FCS), 1% non-essential amino acids, 100mg/mL penicillin/streptomycin and 1% L-glutamine at 370C and 5% CO2. Cell lines Huh-7, Hep40, HepG2, HepG2-2215, Hep3B, Hep3B-TR, PLC, Mahlavu, Focus, FLC4, SK-HEP-1 cell lines were cultured in complete DMEM medium. Other HCC cell lines Snu-182, Snu-387, Snu-398, Snu-423, Snu-449, and Snu-475 were cultured in complete RPMI medium. Cells were passaged into new dishes or plates before they reached high confluency in the dish.
2.3.1.2 Passaging the Cells
To passage cells, firstly, the medium was aspirated using sterile glass pipettes and the cells were washed at least once with 1X PBS. Then, trypsin-EDTA was added in the plate or flask. The amount of trypsin-EDTA was between 0,5- 2ml, depending on the surface area of the flask or plate. Trypsinized cells were kept in the incubator for 1-2 minutes for the detachment of the cells from the surface. Then, detached cells were collected in a complete medium using serological pipettes. Cells were mixed by pipetting up and down. Desired portion of the collected cells were reseeded on plates or flasks depending on the requirements.
27 2.3.1.3 Thawing the Cells
One vial of stock cryovial of interest was taken either from nitrogen tank stocks or from – 80 °C freezer stocks and put on ice immediately. The vial was put in the 37 °C water bath in order to have cell suspension quickly. Cells were resuspended by pipetting up and down gently, and transferred into a 15mL falcon tube with several milliliters of complete medium. Cells were then centrifuged for 4 minutes at 1500 rpm. Supernatant containing DMSO was removed and cell pellet was resuspended in a complete medium and transferred into plate or flask. Flasks and plates were chosen depending on the amount of pellet, smaller flask or dish for less amount of cell pellet. Cells were distributed in the flask or dish evenly by moving the flask or the dish back-forth and right-left. Cells were kept in incubators, at 37 C and 5% carbon dioxide conditions. The day after, cells were washed and unattached cells were removed and the mediums were refreshed.
2.3.1.4 Cryopreservation of the Cells
Cell stocks were prepared from the cell in culture with around 60-75% confluency. These cells were washed with 1X PBS and trypsinized with appropriate amount of trypsin-EDTA. Then, cells were collected with complete medium afterwards in 15mL falcon tube. Cells were centrifuged for 4 minutes at 1500 rpm. Thereafter, freezing medium, containing 10% DMSO and 20% FCS in complete medium, was added for resuspending the cells and then, to transfer cell suspension into cryotubes. Cryotubes were first kept at -20 °C for about 1 hour. Afterwards, they were stored at – 80 °C overnight and transferred into nitrogen tanks.
28 2.3.1.5 Treatment of the Cells
Firstly, cells were seeded in appropriate dishes, flasks or plates according to the experiment type. One day after the seeding, the mediums were removed and cells were washed either with 1X PBS or serum free media which contains only 0.01% FCS depending on the experiment type. Some treatments were done in complete DMEM or RPMI mediums. Some treatments are done in serum free medium containing 1mM Na2SeO3. And one treatment way is to apply serum free medium containing 1mM Na2SeO3 to achieve serum starvation in the environment. Treatment mediums containing chemicals, such as Wnt3a or WIF1, etc. was prepared freshly. For the control samples, complete mediums containing same amount of solvents were prepared, such as water or DMSO. For ODN and microbial byproducts treatment, cells were seeded on the first day and on the second day, medium containing these elements were added onto the cells. Cells were incubated as long as desired.
2.2.1.6 Transient Transfection of Cells with RNAi Max
First of all, siRNA amount to be used should be decided. For this, a trial can take place to find the appropriate amount ranging from 10 to 100nM. To transfect the cells, HepG2 and HepG2-2215 cell lines can be reverse transfected where cells will be seeded while transfection was performed. To do so, in the plate (6-well plate), appropriate amount of siRNA is mixed with appropriate amount of RNAi Max in OptiMEM medium without any serum and media. Then, this should be incubated for 10-20 minutes. After that, trypsinized and counted cells were seeded onto the plate. Cell number should be about 30-40% confluency. After cell seeding, plate should be mixed very well. Depending on your purpose, cells can be examined in 24-72 hours.
29
2.3.2 Total RNA Extraction from Cultured Cells
For RNA extraction from the cultured cells, first of all, cells were collected by adding trypsin-EDTA and growth medium. Then, cells were centrifuged and the pellets were used for RNA extraction using NucleoSpin RNA II Kit (MN Macherey-Nagel, Duren, Germany) according to the manufacturer’s protocol.
2.3.3 Immunoperoxidase Staining Assay
For immunoperoxidae staining, first of all, cells or tissues were fixed with 1:1 acetone:methanol solution for 10 minutes at -20°C. After fixation, cells or tissues were washed with 1X PBS. To stop endogenous peroxidase activity, they were treated with 3%H2O2 for 10 minutes for cells and 30 minutes for tissues. Then, cells or tissues were blocked with 10% fetal calf serum and 0.3% TritonX-100 in PBS. They were incubated with primary antibodies for 1 hour in PBS containing 10% fetal calf serum and 0.3% TritonX-100 solution. After washing with 1X PBS containing 0.3% TritonX-100, cells or tissues were incubated for 1 hour with Cytomation Envision+Dual link system-HRP (Dako), and eventually the staining was performed with DAB detection solution (Dako). Cover slips were then rinsed with distilled water and counterstained with haematoxylin (Sigma) for 3-4 min, mounted on glass microscopic slides using 90% (v/v) glycerol and examined under light microscope.
2.3.4 Immunofluorescence Staining Assay
For immunofluorescence staining, first of all, cells were fixed with 4% formaldehyde for 10 minutes at room temperature, or tissues were fixed with 4% paraformaldehyde for 30 minutes at room temperature. After fixation, cell permeabilization was done using 0.5% saponin, 0.3% TritonX-100 in 1X PBS solution for 5 minutes, three times at room temperature. This step was not needed in immunofluorescence protocol for
30
tissues. Permeabilized cells or tissues were blocked with 10% fetal calf serum (FCS), and 0.3% TritonX-100 in 1X PBS for 1 hour at room temperature. After blocking, primary antibody incubation was done using a specific antibody prepared in 10% fetal calf serum and 0.3% TritonX-100 in 1X PBS for 1 hour at room temperature. Primary antibodies were removed and cells were washed with PBS-0.3% TritonX-100. Then, secondary fluorescent antibodies, anti-rabbit or anti-mouse or anti-goat Alexa Fluor 488 or Alexa Fluor 568 were used for the detection of the primary antibody. After secondary antibody incubation, cells or tissues were counter stained with DAPI (1:10000 dilution in ddH2O) for 1 minute. Finally, cover slips were mounted on slides using fluorescent mounting medium and visualized and photographed under fluorescence microscope.
2.3.6 Western Blotting
After quantification of the protein concentrations of the samples, equal amounts of proteins were used to prepare loading mixtures. 25 to 50µg of proteins were loaded into the gel according to the type of experiment. Loading samples were prepared by adding 5X Loading buffer, 20X denaturing agent (or 2M DTT), and ddH2O up to the final volume of 20 or 30µl per well. Then, prepared loading mixtures were heated at 100 °C for 10 minutes and chill on ice before loading into the gel.
In this study, gel concentrations and type of running buffers were chosen mainly according to size of the protein of interest. 8%, 10%, and 12% tris-glycine gels were the type of gels used. After running, proteins were transferred onto Amersham HyBond ECL nitrocellulose or PVDF membranes with wet transfer protocol. Transfer buffer was prepared 1X (from 10X stock) with 10% or 20% methanol in ddH2O. Before preparation of wet transfer sandwich, all of the materials were soaked into transfer buffer, and especially PVDF membranes were extra activated in absolute methanol before soaked into transfer buffer. Transfer was done for 90-120 minutes (longer for proteins with very high kDa) with 100 V voltage applied. During the transfer, western blot tank was either kept in cold room or covered with ice.
31
When the transfer was completed, the efficiency of transfer was tested by putting membrane into Ponceau S solution for 30 seconds. Then, Ponceau S solution was removed by washing membrane in ddH2O for a few minutes. Membranes were blocked with 5% non fat dry milk, or 5% BSA in 0.2% TBS-Tween for 1 hour. Short time blockings were done at room temperature, whereas over night blockings at +4 °C. After blocking, primary antibodies were prepared in non fat dry milk solution or BSA solutions and incubated for 1-2 hour(s) at room temperature or over night at +4°C. After primary antibody incubation, membranes were washed with 0.2% TBS-T five times for 5, 5, 10, 5, 5 minutes at room temperature. TBS-Then, horseradish peroxidase conjugated secondary antibodies; anti-mouse, anti-rabbit or anti-goat, were used as secondary antibodies according to the type of primary antibody used. Secondary antibody incubation was performed at room temperature for 1 hour. After this incubation, membranes were again washed five times for 5, 5, 10, 5, 5 minutes at room temperature on a shaker. Then, detections were done using chemiluminescent detection kit, ECL+ (Amersham, UK) according to the manufacturer’s protocols. Finally, X-ray films were exposed to the emitted chemiluminescent light from the reaction of horseradish peroxidase and developed in X-ray developer. Time of exposure was chosen depending on the detection reagent and the specific antibody used against the protein of interest.
2.3.7 Flow Cytometry Analysis
Firstly, treated or untreated cells were trypsinized and they were collected with appropriate amount of medium in 15mL falcon tubes. Cells were washed twice with 1X PBS and they were centrifuged at 1600 rpm for 5 minutes. Then, fixative reagent A was added to cell pellets while vortexing samples for 10 seconds. They were incubated at room temperature for 15 minutes. Cells were washed with 1X PBS containing BSA-NaAzide. Then, cells were incubated with primary antibodies that are conjugated with fluorescent dyes, which are diluted in PBS-BSA-NaAzide for 10 minutes at +4°C. Then, cells were washed twice with PBS-BSA-NaAzide. Finally
32
cells were resuspended in 1X PBS and analyzed using BD CSampler. Antibody positivity was assessed depending on the fluorescent intensity of the samples.
2.3.8 Antibody Conjugation
Antibody to be labeled with Atto488, should be 100-200µg in 40-100µL. For each 10µL of antibody to be labeled, 1-2µL of LL-Modifier reagent should be added, and mixed gently. This solution should be added directly onto the Lightning-Link mix vial and lyophilized mix should be resuspended with antibody solution. The mix should stand 3 hours to overnight incubation at room temperature. After incubation, 1µL of LL-quencher FD reagent should be added to mix for each 10µL of antibody. The conjugate can be used after 30 minutes. The conjugate will be Alexa488 labeled and it should be stored at 4°C.
2.3.9 RNA Sample Preparation and Hybridization to Chip
Total RNA isolation from triplicate samples of HepG2 and HepG2-2215 cell lines treated with 3 days of serum starvation was performed with Nucleospin RNA kit (MN, Düren, Germany) according to the manufacturer’s protocol. RNA quality was checked using Agilent Bioanalyzer 2100 kit and software (Agilent Technologies, Santa Clara, CA, USA) according to the manufacturer’s protocol. RNA isolates were hybridized to Affymetrix HG-U133_Plus2 chips, applying Affymetrix 3’ IVT hybridization protocol in Bilkent University Bilgen Affymetrix Center for microarray analysis.
2.3.10 Data Analysis of Microarray Samples
Microarray data normalization and class comparison analyzes was performed using BRB-Array Tools Version 4.2.1 [66]. Triplicate HEPG2 and HEPG2-2215 samples,
33
which passed the Affymetrix quality control test, were normalized using the RMA method. List of >2 fold differentially expressed genes between two classes in p<0.001 significance level were identified (2983 genes in total) using the class comparison tool of the program.
Gene set enrichment analyzes (GSEA) were performed using the GSEA desktop
program version 2.0, downloaded from
http://www.broadinstitute.org/gsea/downloads.jsp website. Six separate GSEA analyzes were performed using C1 to C6 curated gene set lists downloaded from molecular signature database (MsigDB) and gene expression data of the >2 fold differentially expressed genes of the microarray dataset. Enrichment results of each analysis were further studied.
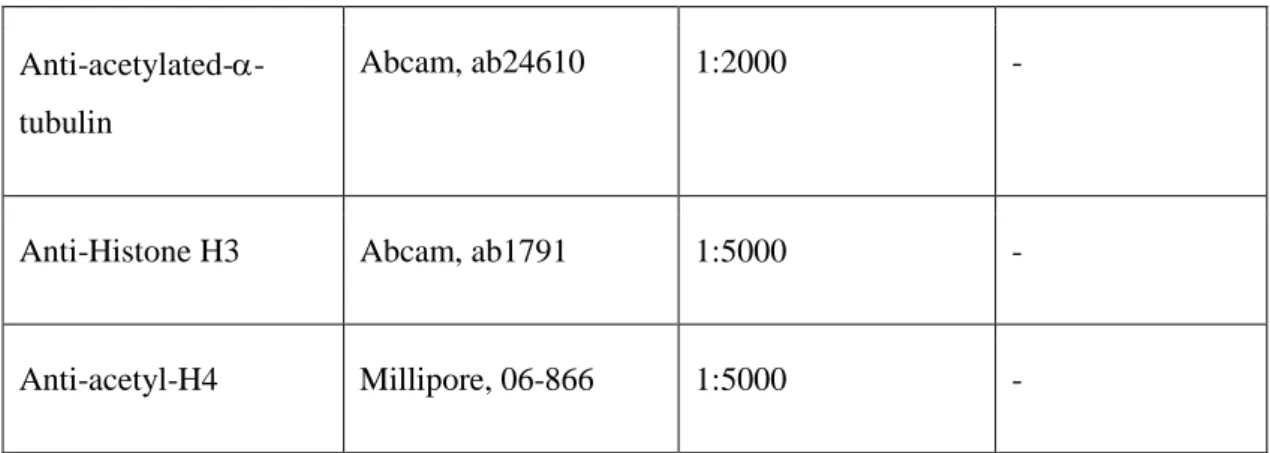
Table 2.3: List of curated gene sets and their content.
Gene Set Name Collection
C1: positional gene sets Gene sets corresponding to each human chromosome and each cytogenic band that has at least one gene. C2: curated gene sets Gene sets collected from various sources including
online pathway databases, publications.
C3: motif gene sets Gene sets that contain that share a cis-regulatory motif conserved across the human, mouse, rat and dog genomes.
C4: computational gene sets Gene sets defined by mining large collections of cancer-oriented microarray data.
C5: GO gene sets Gene sets are named by GO term and contain genes annotated by that term.
C6: oncogenic signatures Gene sets represent signatures of cellular pathways, often dis-regulated in cancer.
![Table 1.1: List of CSC markers in HCC and their possible functional roles. Adapted from [36]](https://thumb-eu.123doks.com/thumbv2/9libnet/5627241.111600/23.892.165.793.904.1125/table-list-csc-markers-possible-functional-roles-adapted.webp)