* Asst. Prof. Dr. Ihsan Doğramacı Bilkent University, Graduate School of Education, Ankara-Turkey, email: [email protected]
ISSN: 1309 - 6575
An Analysis of the Resilient Students’ Profile based on PISA
2012
Üstün Başarılı Öğrenci Profilinin PISA 2012’ye Dayalı olarak
Analizi
İlker KALENDER *
Abstract
The present study sought to define resilient students’ profile in comparison with low achieving/low SES students. To this end, several school- and teacher-related variables, taken from PISA 2012 student questionnaire, that were considered to be influential on students’ reading literacy were examined. A total number of 28 items from 5 dimensions were selected. They are: Student-Teacher Relations (5 items), Sense of Belonging (9 items), Attitude towards Learning at School (4 items), Attitude toward School (4 items), and Perceived Control (6 items). Using binary logistic regression, significant variables were defined explaining literacy differences between two groups of students. Then, profile of resilient students was defined. Results indicated that resilient students had more positive attitudes towards school and teachers compared with low achievers. The findings of the present may provide significant information as to increase rate of resilient students.
Key Words: resilient students, profiling, reading literacy, PISA 2012 Öz
Bu çalışmada düşük sosyoekonomik düzeye sahip olan üstün başarılı öğrencilerin profili, düşük başarılı/düşük sosyo-ekonomik düzeye sahip öğrenciler ile karşılaştırmalı olarak ortaya konulmaya çalışılmıştır. Bu amaçla bu iki öğrenci grubu arasındaki okuma becerisi farklılıklarını açıklayabileceği düşünülen ve PISA 2012 öğrenci anketlerinden seçilen okul ve öğretmen ile ilgili faktörler incelenmiştir. Toplam 5 boyuttan 28 madde analizlere dahil edilmiştir. Bu boyutlar ve madde sayıları: Öğrenci-Öğretmen İlişkileri (5 madde), Aidiyet Duygusu (9 madde), Okulda Öğrenmeye Karşı Tutum (4 madde), Okula Karşı Tutum (4 madde) ve Algılanan Denetim’tir (6 madde). Binary lojistik regresyon yöntemi ile başarı farklılıklarını açıklayan anlamlı değişkenler tespit edilmiştir. Ardından üstün başarılı öğrenciler için bir profil tanımlanmıştır. Sonuçlar sosyo-ekonomik yoksunluk çeken üstün başarılı öğrencilerin düşük başarılı öğrenciler ile karşılaştırıldıklarında okul ve öğretmene karşı olumlu tutumlara sahip olduğunu göstermiştir. Çalışmadan elde edilen bulguların düşük sosyoekonomik ortamdan gelen üstün başarılı öğrenci oranının artırılmasına yardımcı olacağı düşünülmektedir.
Anahtar Kelimeler: dezavantajli üstün başarılı öğrenciler, profil tanımlama, okuma becerisi, PISA 2012
INTRODUCTION
There may be lots of factors that can make a student “disadvantaged” such as the ones related to family (divorce, separation, remarriage, poverty, etc.), outside of family (neighbourhood, violence at school, etc.) or medical conditions (mental illness of a family member, death of parents and grandparents) (Benard, 1993; Lee & Madyun, 2009; Zolkoski & Bullock, 2012). It is well known that the disadvantages have, in most cases, negative impact on students’ school achievement. For instance, neighbourhood creates an influential adversity and therefore puts adolescents and children under the risk of underdevelopment and low achievement at school context (Lee & Madyun, 2009).
However, the most influential disadvantage on achievement among these factors is probably students’ low socioeconomic status (SES). In one of the earliest definition, Mueller and Parcel (1981) said that SES is an individual’s stratum according to which an individual can attain certain prosperities such as wealth, power, and social status. As to effect of SES on student achievement, Coleman et al. (1966) wrote a report entitled Equality of
Educational Opportunity, stating that low SES is an obstacle in front of school achievement.
Since then little has changed and SES background has still been positively correlated with academic performance (Caldas & Banskton, 1997, 2001; Kalender & Berberoglu, 2009; Organization for Economic Corporation and Development [OECD], 2011a; Schoon, et al., 2003).
Despite their SES disadvantages, some students may be able to develop individual coping mechanisms which help them accomplish to be academically successful. These students are able to overcome their SES-related disadvantages and achieve higher levels of achievement. They are called “academically resilient students”, who are able to break the odds of their lack of cultural capital or financial resources and attain high achievement at school despite those adversities in their lives (OECD, 2011b). Achievement levels of the resilient students are not only high when compared to their more advantaged peers in spite of their adversities, their achievement also achieve much higher levels above the their national averages (OECD, 2011b). Studies grouped the protective factors or coping mechanisms by three categories, which are personal characteristics they developed and/or have congenital (e.g. intelligence, temperament, internal locus of control, autonomy), family related factors (e.g. support from family members) and external support systems for wider social context (e.g. teacher support, school environment) (Beauvais & Oetting, 1999; Garmezy, 1991; Gore & Eckenrode, 1996; Greene & Conrad, 2002; Masten & Reed, 2002; Werner & Smith, 1992;). Furthermore, there are lots of studies which reported positive relationships between academic resiliency and school achievement (Finn & Rock, 1997; Martin, 2002; Rouse, 2001; Waxman & Huang, 1996).
Results from Programme for International Student Assessment (PISA) cycles provided significant information as to differences between resilient and SES-disadvantaged students. Approximately 6% of students across its member countries are defined as resilient by OECD. Preliminary results on PISA 2012 show that an increase of 38 points in reading could be achieved if students are from a more SES-advantaged background results (PISA 2012). Accordingly, OECD (2013) suggests that putting efforts to increase disadvantaged students’ performance through additional instruction should be a key priority for policy makers of the low SES countries.
Despite its low ranks in PISA, Turkey constitutes an exemplary county in resiliency with its increasing rate of resilient students based on the results between cycles of 2003 and 2012 (OECD, 2013). Mean rate of the resilient students in OECD countries was 6.1% in PISA 2003, which decreased to 4.8% in PISA 2012. On the other hand, rate of Turkish resilient students was found to be 40% among SES-disadvantaged students in PISA 2012 (OECD, 2013). Thus, Turkey was considered as a setting to study academic resiliency by the researchers of the present study.
Turkey’s special position in resiliency made the researcher think of the factors which can help increase achievement of low-achieving students from low-SES background to higher levels. That research focused on the problem of identification of these factors. The argument made by Wang, Haertel, and Walberg (1994), that the academic resilience could be developed through interventions which enhance learning, develop students’ talents and competencies, made researcher further investigate characteristics of resilient students and their differences from low-achiever students who are SES-advantaged in Turkey. The
___________________________________________________________________________________________________________________ rationale of the present study was also justified by Alva (1991) who stated that although it is really difficult to change the conditions that put the students at risk, it is crucial that the disadvantaged students learn to deal with their problems and improve their academic skills, and Martin (2002) who stated that they can be provided themselves with a good learning opportunity, which makes them academically resilient.
Additional findings from the literature provided further support for considering factors regarding teacher and school. For example, Ceylan and Berberoglu (2007) and Kalender and Berberoglu (2009) found that teacher is a dominant actor in student achievement and teacher-centred activities are positively correlated with student achievement. Similarly, the Varkey GEMS (George Educational Medical & Charitable Society) foundation’s global teacher status index (calculated based on attitudes to teachers around the world) showed that Turkey is one of the countries in which receive have high respect in the society (Dolton & Marcenaro-Gutierrez, 2013).
Purpose of the Study
The purpose of the present study was to define resilient students’ profile using several predictors selected from school- and teacher-related variables. Research problems of the study were stated as follows: (i) What are the teacher- and/or school-related factors which explain achievement differences between low-achievers and resilient students, both are low SES?, and (ii) What is the general profile of resilient students in terms of the items that significantly differed between two groups?
The findings of the research may shed light on increasing the ratio of resilient students in Turkey, a socio-economically diverse country. Also it is expected that results of the present study will be helpful for those who are related with policy-making in education as well as teachers who work with low SES students in their schools.
METHOD
In this study, reading literacy, as defined by OECD (2013), was used as performance indicator. Reading literacy is defined by OECD as follows:
“…understanding, using, reflecting on and engaging with written texts, in order to
achieve one’s goals, develop one’s knowledge and potential, and participate in society.” (OECD, 2013, p. 61)
The reason that reading literacy was selected was that it is an important skill especially in today’s world which includes printed material and, use of Internet has become so wide for gathering information and critical look at the information.
Sample
A total number of 4848 students were included in PISA 2012 in Turkey. These students were selected from 12 statistical regions and 13 school types based on stratified systematic sampling. SES-disadvantaged students were determined using Economic, Social and Cultural Status index (ESCS), developed by OECD using the variables parental occupation, the highest level of parental education, and an index of home possessions related to family wealth, home educational resources and possessions related to “classical” culture in the family home. OECD also defines resilient students as those who are at the bottom quarter of index of ESCS in a country and who scores at the top quarter across students from all countries after accounting for socio-economic background (OECD, 2013).
SES-disadvantaged students were chosen as all of 1200 students at the bottom quarter based on ESCS index of Turkey. Then, low-achievers and resilient students among disadvantaged ones were taken as those who were at the lowest (n=300, Mreading=342.737, SD=39.88, Proficiency Level=1a) and highest quartiles (n=300, Mreading=538.63, SD=38.40,
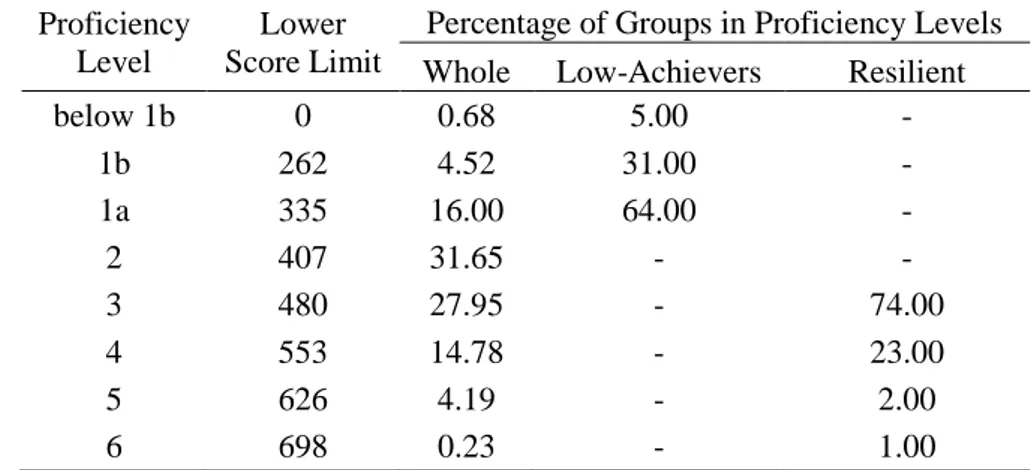
Proficiency Level=3) in reading literacy, respectively. Distribution of low-achievers, resilient and whole groups with respect to reading literacy proficiency levels in PISA 2012 can be seen in Table 1.
Table 1. Percentage Distribution of Low-achievers, Resilient and Whole Group with respect to Reading Proficiency Levels
Proficiency Level
Lower Score Limit
Percentage of Groups in Proficiency Levels Whole Low-Achievers Resilient
below 1b 0 0.68 5.00 - 1b 262 4.52 31.00 - 1a 335 16.00 64.00 - 2 407 31.65 - - 3 480 27.95 - 74.00 4 553 14.78 - 23.00 5 626 4.19 - 2.00 6 698 0.23 - 1.00
Independent-samples t-test showed that two groups of students (low-achievers and resilient) had statistically significant mean reading literacy scores than each other, t(598) = -61.360, p<.001. Furthermore, one-sample t-test results indicated that both low-achievers and resilient students had statistically significant mean differences than OECD mean (500) in reading literacy score, t(299) = -68.297, p < .01 for low-achievers and t(299) = 17.470, p < 0.01 for resilient students.
Data Collection Instruments
PISA conducted by OECD aims to assess literacy levels of 15-year-old students on reading, mathematics, science (with a focus on one of these domains in each cycle) with a special emphasize on how students can perform with what they learned at school on unorthodox grounds (OECD, 2011b). Besides the literacy tests, students also respond to several questionnaires which are used to obtain information about their backgrounds, experiences related to school and learning, etc. PISA results provide governments, educational scientists, and other stakeholders with invaluable information that could be used to develop educational policies, curriculums, etc.
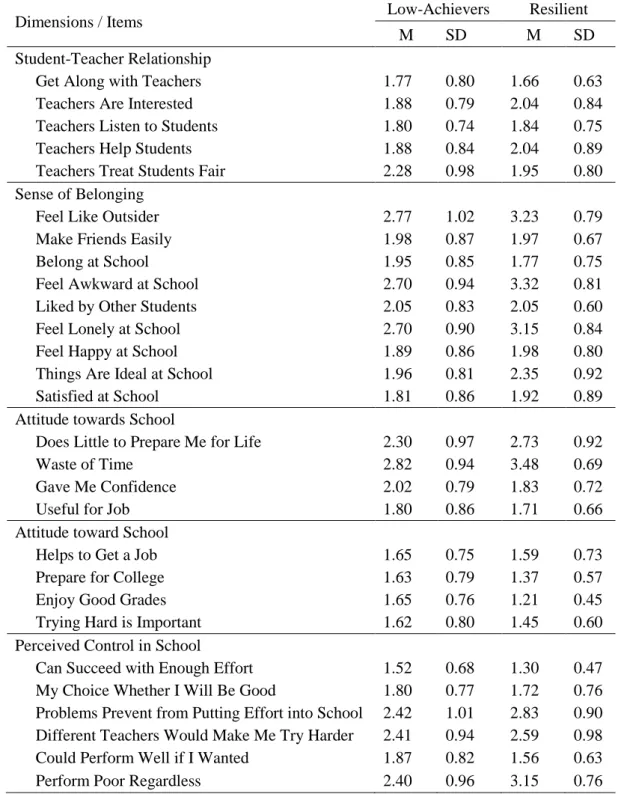
The teacher- and school-related variables selected for this study were given in Table 2. Items in the table were given in abbreviated forms, as appeared in original PISA data set. For full item stems, see Appendix. These items are coded as ST86, ST87, ST88, ST89 and ST91 for Student-Teacher Relations, Sense of Belonging, Attitude towards School, Attitude toward School, and Perceived Control, respectively, in the questionnaire. For all items, coding scheme was as follows: 1: Strongly agree, 2: Agree, 3: Disagree and 4: Strongly disagree. But before the analyses, items were recoded so that the highest agreement (Strongly agree) had a value of 4, while the lowest (Strongly disagree) 1. Dependent variable was Plausible Value in Reading 1 (PV1READ).
___________________________________________________________________________________________________________________
Table 2. Descriptives of Predictor Variables across Low-Achievers and Resilient Students
Dimensions / Items Low-Achievers Resilient
M SD M SD
Student-Teacher Relationship
Get Along with Teachers 1.77 0.80 1.66 0.63
Teachers Are Interested 1.88 0.79 2.04 0.84
Teachers Listen to Students 1.80 0.74 1.84 0.75
Teachers Help Students 1.88 0.84 2.04 0.89
Teachers Treat Students Fair 2.28 0.98 1.95 0.80 Sense of Belonging
Feel Like Outsider 2.77 1.02 3.23 0.79
Make Friends Easily 1.98 0.87 1.97 0.67
Belong at School 1.95 0.85 1.77 0.75
Feel Awkward at School 2.70 0.94 3.32 0.81
Liked by Other Students 2.05 0.83 2.05 0.60
Feel Lonely at School 2.70 0.90 3.15 0.84
Feel Happy at School 1.89 0.86 1.98 0.80
Things Are Ideal at School 1.96 0.81 2.35 0.92
Satisfied at School 1.81 0.86 1.92 0.89
Attitude towards School
Does Little to Prepare Me for Life 2.30 0.97 2.73 0.92
Waste of Time 2.82 0.94 3.48 0.69
Gave Me Confidence 2.02 0.79 1.83 0.72
Useful for Job 1.80 0.86 1.71 0.66
Attitude toward School
Helps to Get a Job 1.65 0.75 1.59 0.73
Prepare for College 1.63 0.79 1.37 0.57
Enjoy Good Grades 1.65 0.76 1.21 0.45
Trying Hard is Important 1.62 0.80 1.45 0.60
Perceived Control in School
Can Succeed with Enough Effort 1.52 0.68 1.30 0.47 My Choice Whether I Will Be Good 1.80 0.77 1.72 0.76 Problems Prevent from Putting Effort into School 2.42 1.01 2.83 0.90 Different Teachers Would Make Me Try Harder 2.41 0.94 2.59 0.98 Could Perform Well if I Wanted 1.87 0.82 1.56 0.63
Perform Poor Regardless 2.40 0.96 3.15 0.76
Data Analysis
A binary logistic regression analysis was conducted with 28 items as explanatory variables and group membership as the dependent variable (0: low-achievers, 1: resilient). Logistic regression models provide probabilistic classification and produce probabilistic values for dependent variables based on change in independent variables. The reason that logistic regression was preferred over other methods such as discriminant analysis is that logistic regression is not strict in terms of assumptions. First of all, logistic regression does not assume any linear relationship between independent variables and dependent variable since that method uses a non-linear transformation for predictions. Second, assumption of
multivariate normality for independent variables is not required. Furthermore, residuals are not expected to be normally distributed. Similarly, homoscedasticity, an assumption hard to satisfy, is not a requirement for logistic regression and scale of independent variables can be categorical as well as metric (Jaccard, 2001; Kleinbaum & Kline, 2002; O'Connell, 2006).
Results of the binary logistic regression were interpreted as the probability that a student will be in low-achievers or resilient group based on his/her responses to explanatory variables. In other words, regression model was used to find out, if there is any, association between a students’ group membership and teacher/school-related variables.
Secondly, using significant predictor variables defined as a result of the regression, a general profile of resilient students was depicted based in terms of their agreement/disagreement levels on the variables.
RESULTS
Results of omnibus tests of model coefficients (χ2=172.609, df=28, p<.001) revealed that explanatory variables included in binary logistic regression provided a significantly better fit than the model with the base model (with no variables). Thus it can be said that preliminary analyses indicated that the predictor variables (at least some of them) that were included in the regression model could successfully discriminate the probabilities of being a member in one of the learner groups. The logit model indicated that there is a strong relationship between the explanatory variables and the dependent variables (r=.718). The logit model explained 51.5% of the variance in the dependent variable (Nagelkerke R2=.515). However, the R2 values estimated at the end of the logistic regression should not be interpreted as they are ordinary regression model. This is why R2 estimates are called “pseudo” values in logistic models. The larger values should be considered better than the lower ones. Classifications made based on significant explanatory variables were able to put students at the correct category with a rate of 79.4%, indicating a high predictive power for the logit model. The correct classification rate for the base model was 54.4%. Thus explanatory variables included into the logit model provided a significant improvement in classifying students into two groups.
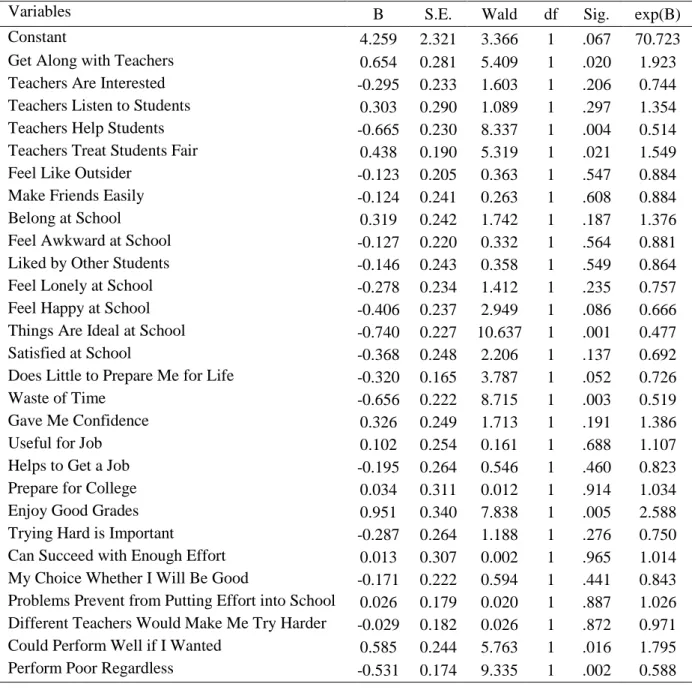
Table 3 presents the results of the binary logistic regression. Eight explanatory variables were identified as significant predictors discriminating between two learner groups. The logistic coefficients (B) have not the same interpretation as in the ordinary linear regression. B coefficients indicate how much a change will happen in the log of the odds based on one the change in a predictive variable. In general negative B values indicate that increase in an independent variable is associated with a likelihood of being a member of the first group. However, exponentials of B values (odds ratios), shown as exp(B), are commonly checked to investigate the change in odds. Any exp(B) value greater than 1 indicates the odds for being a member of resilient group increases, while values between 0 and 1 indicate an increasing odd in favor of low-achiever group. For example, the item Teachers Help Students has a exp(B) value of 0.514, indicating that one unit increase in this variables is associated with an decreases (increases) in odds for being a member of resilient (low-achievers) student group 0.514 times, after controlling for the other explanatory variables in the model. Similarly, exp(B) value of 1.549 (Teachers Treat Students Fair) means that the odds that being a member of resilient group increases 1.549 times, or likelihood that a student will be a member of low-achievers decreases.
___________________________________________________________________________________________________________________
Table 3. Results of Binary Logistic Regression
Variables B S.E. Wald df Sig. exp(B)
Constant 4.259 2.321 3.366 1 .067 70.723
Get Along with Teachers 0.654 0.281 5.409 1 .020 1.923
Teachers Are Interested -0.295 0.233 1.603 1 .206 0.744 Teachers Listen to Students 0.303 0.290 1.089 1 .297 1.354
Teachers Help Students -0.665 0.230 8.337 1 .004 0.514
Teachers Treat Students Fair 0.438 0.190 5.319 1 .021 1.549
Feel Like Outsider -0.123 0.205 0.363 1 .547 0.884
Make Friends Easily -0.124 0.241 0.263 1 .608 0.884
Belong at School 0.319 0.242 1.742 1 .187 1.376
Feel Awkward at School -0.127 0.220 0.332 1 .564 0.881
Liked by Other Students -0.146 0.243 0.358 1 .549 0.864
Feel Lonely at School -0.278 0.234 1.412 1 .235 0.757
Feel Happy at School -0.406 0.237 2.949 1 .086 0.666
Things Are Ideal at School -0.740 0.227 10.637 1 .001 0.477
Satisfied at School -0.368 0.248 2.206 1 .137 0.692
Does Little to Prepare Me for Life -0.320 0.165 3.787 1 .052 0.726
Waste of Time -0.656 0.222 8.715 1 .003 0.519
Gave Me Confidence 0.326 0.249 1.713 1 .191 1.386
Useful for Job 0.102 0.254 0.161 1 .688 1.107
Helps to Get a Job -0.195 0.264 0.546 1 .460 0.823
Prepare for College 0.034 0.311 0.012 1 .914 1.034
Enjoy Good Grades 0.951 0.340 7.838 1 .005 2.588
Trying Hard is Important -0.287 0.264 1.188 1 .276 0.750 Can Succeed with Enough Effort 0.013 0.307 0.002 1 .965 1.014 My Choice Whether I Will Be Good -0.171 0.222 0.594 1 .441 0.843 Problems Prevent from Putting Effort into School 0.026 0.179 0.020 1 .887 1.026 Different Teachers Would Make Me Try Harder -0.029 0.182 0.026 1 .872 0.971 Could Perform Well if I Wanted 0.585 0.244 5.763 1 .016 1.795 Perform Poor Regardless -0.531 0.174 9.335 1 .002 0.588
Thus, the highest likelihood of a being a resilient was observed due to the item Enjoy Good Grades. One unit increase in that variable increases the likelihood of being a resilient student 2.59 times. Similarly, Could Perform Well if I Wanted and Teachers Treat Students Fair also increases the odds of being a resilient 1.80 and 1.55 times, respectively. The rate of increasing the odds for all explanatory variables was found to be high. Even the lowest exp(B) value, 0.477 (Things are Ideal at School), increases the likelihood of being a low-achievers almost 50%.
Results indicated that the higher agreement levels (giving higher scores) for the following items increased the odds of having resilient students: Enjoy Good Grades, Get Along with Teachers, Could Perform Well if I Wanted, and Teachers Treat Students Fair. On the other hand, the items Perform Poor Regardless, Waste of Time, Teachers Help Students, and Things Are Ideal at School were the ones for which higher scores were associated with high likelihood of being a low-achievers.
After defining significant predictors differentiating between resilient and low-achiever students, data were further analyzed based on the results of the binary logistic
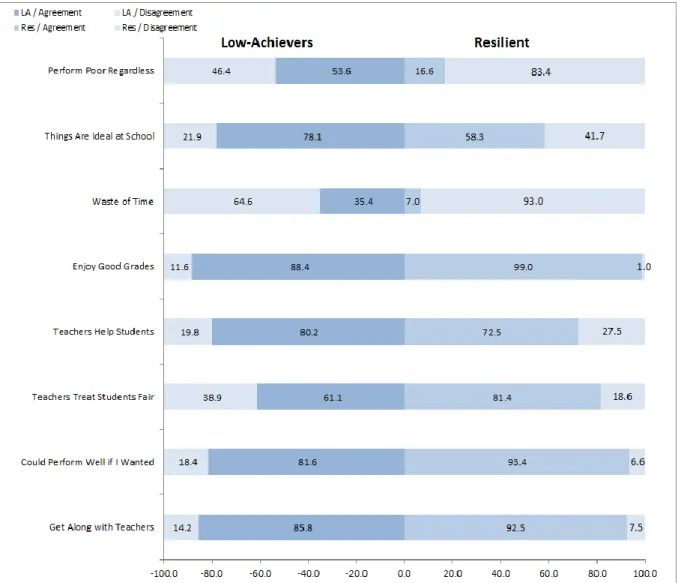
regression analysis to define profile of resilient and lower-achievers in terms of significant predictor variables. The Figure 1 presents agreement (sum of percentages of students who stated strongly agree and agree for the respective item) and disagreement scores (sum of percentages of students who stated strongly disagree and disagree for the respective item), for the low-achiever and resilient student groups. For example, for the item Perform Poor Regardless 53.6% of the low-achievers stated agreement while 83.4% of the resilient students selected strongly disagree or disagree options for that item.
Figure 1. Profile of Low-Achiever and Resilient Students
To investigate the differences in terms of agreement level between low-achievers and resilient students, χ2 for homogeneity tests were conducted. Results are given in Table 4. Only one item, Teachers Help Students was found to have similar agreement levels.
Table 4. Results of χ2 for Homogeneity Tests
Items χ2 df Sig.
Get Along with Teachers 7.839 3 .044 Teachers Help Students 3.564 3 .313 Teachers Treat Students Fair 19.897 3 .000 Things Are Ideal at School 18.966 3 .000
___________________________________________________________________________________________________________________
Waste of Time 56.720 3 .000
Enjoy Good Grades 46.510 3 .000
Could Perform Well if I Wanted 16.959 3 .001 Perform Poor Regardless 63.424 3 .000
Based on the response distributions in Figure 1 and significance in Table 4, resilient students could be defined as those who (i) mainly disagree (83.4%) that they perform poorly at school whether or not they study for their exams, (ii) equally think that things are not ideal at school (58.3%), (iii) do not think that school is waste of time for them (93.0%), (iv) almost completely enjoy receiving good grades (99.0%), (v) think that teachers treat students fair (81.4%), (vi) could perform well if they wanted (93.4%), (vii) mostly get along with their teachers (92.5%).
Low-achiever students seemed to have developed `more negative attitudes for teacher and school. For example, these students think that they have low performance in any case, teachers treat unfair, consider school as waste of time. Interestingly, low-achiever students had higher agreement levels than resilient students for Things are Ideal at School.
CONCLUSIONS AND DISCUSSION
The present study was conducted to draw a profile of resilient students using several school and teacher-related variables that could discriminate low-achieving SES-disadvantaged and high-able (resilient) socio-economically disadvantaged students. Results of the present study indicated that reading literacy differences between two groups of students could be explained by some of factors discussed above with a higher accuracy rate. After significant predictors were defined, a profile was described for resilient students.
Although today’s curriculum development philosophies put students on focus, the teacher seems to be the strongest predictor of student achievement in many countries including Turkey (Kalender & Berberoglu, 2009). The present study also provided evidence for teachers’ role in development of students’ positive attitudes toward school and teachers and overcoming the negative effects of being disadvantaged which are known as a variable having strong relationship with student achievement (OECD, 2011a).
In general, results revealed were consistent with the ones reported in the literature. Teacher and school-related factors have positive relationship with achievement for resilient students, as we all the general learner groups: teacher and student relationship (Klem & Connel, 2004; Roorda & Koomen, 2011), sense of belonging (Goodenow, 1991), attitude towards school (Ford & Harris, 1996; Williams & Downing, 1998).
When agreement scores were investigated, it can be concluded that it can be argued that resilient students have mostly positive attitudes towards school and teacher as compared to low-achiever students. Interestingly, for the following statement, Things are ideal in my school, rate of agreement was found to be higher for low-achievers.
The large difference between profiles of resilient and low-achiever students with low SES indicated that the latter group had higher degree of learned helplessness. Low-achievers think that they could not be successful even if they try.
Based on the findings, it can be concluded that teacher- and school-related factors could explain differences between low-achievers and resilient, at least to some degree. This highlights the importance of teachers a key actor to help student overcome their disadvantages, especially for countries like Turkey, which have large discrepancies in socio-economic status of students.
Results provided supporting evidence for the statements by Alva (1991), Wang, Haertel, and Walberg (1994), and Martin (2002). Although low-SES may be negatively
influential on achievement, academic low-achievement is not a permanent barrier for students. Constructive support from teacher may significantly increase achievement of students, as shown by the findings.
Some recommendations for future research were made based on the findings. In-depth knowledge may be sought in terms of interactions between the explanatory variables which were found significant to provide additional information as to differences between low-achiever with low SES and resilient students.
The results of the present study may provide practical implications for teachers who teach low-SES students. For example, teachers may try to have students develop positive attitudes toward school and their teachers. An effort to convince students that all students are being treated fair can increase achievement level. Similarly, it is an important factor that students think that school is not waste of time may, a conviction that can be made by teachers. Furthermore, low-achiever students may be given awareness that they can be successful if they wish.
REFERENCES
Alva, S.A. (1991). Academic invulnerability among Mexican-American students: The importance of protective resources and appraisals. Hispanic Journal of Behavioural Sciences, 13(1), 18-34. Beauvais, F. & Oetting, E.R. (1999). Drug use, resilience, and the myth of the golden child. In Glantz, M.D.
Johnson, J. L. (Eds.), Resilience and development: Positive life adaptations (pp. 101-107). New York: Kluwer Academic/Plenum Publishers.
Benard, B. (1993). Fostering resiliency in kids. Character Education,.51(3), 44-48.
Caldas, S. S., & Bankston, C. L. (1997). The effect of school population socio economic status on individual student academic achievement. Journal of Educational Research, 90(5), 269-277.
Ceylan, E. & Berberoglu, G. (2007). Factors related with students’ science achievement: A modeling study. Education and Science, 32, 36-48.
Coleman, J. S., Campbell, E. Q., Hobson, C. J., McPartland, F., Mood, A. M., Weinfeld, F. D. (1966). Equality of educational opportunity. Washington, DC: U.S. Government Printing Office.
Dolton, P. & Marcenaro-Gutierrez, O. (2013). Varkey GEMS foundation global teacher status index. Retrieved from
http://www.varkeygemsfoundation.org/sites/default/files/documents/2013GlobalTeacherStatusIndex.p df
Finn, J. D., & Rock, D. A. (1997). Academic success among students at risk for school failure. Journal of Applied Psychology, 82, 221-234.
Ford, D. Y., & Harris, J. J., III. (1999). Multicultural gifted education. New York: Teachers College Press.
Garmezy, N. (1996). Reflections and commentary on risk, resilience and development. In R. J. Haggerty, L. R. Sherrod, N. Garmezy, & M. Rutter (Eds.) Stress, risk, resilience in children and adolescents:
processes, mechanism and interventions (pp.1-18). New York: Cambridge University Press. Goodenow, C. (1991). The sense of belonging and its relationships to academic motivation among pre and
early adolescent students. Paper presented at the annual meeting of the American educational research Association. Chicago.
Gore, S. & Eckenrode, J. (1996). Context and process in research on risk and resilience. In R. J. Haggerty, L. R. Sherrod, N. Garmezy, & M. Rutter (Eds.) Stress, risk, resilience in children and adolescents: Processes, mechanism and interventions (pp.19-63). New York: Cambridge University Press. Greene, R. & Conrad, A.P. (2002). Basic assumptions and terms. In R. Greene (Ed.), Resiliency: An integral
approach to practice policy, and research (pp. 29-62). Washington, DC: NASW Press.
Jaccard, J. (2001). Interaction effects in logistic regression. Thousand Oaks, California: Sage Publications. Kalender, I. & Berberoglu, G. (2009). An assessment of factors related to science achievement of Turkish
students. International Journal of Science Education, 31(10), 1379-1394.
Kleinbaum, D.G., & Klein, M. (2002). Logistic regression: a self-learning text. (2nd ed.)New York: Springer. Klem, A. M., & Connell, J. P. (2004). Relationships matter: Linking teacher support to student engagement
___________________________________________________________________________________________________________________ Lee, M. & Madyun, N. (2009). The impact of neighborhood disadvantage on the black-white achievement gap.
Journal of Education for Students Placed at Risk, 14(2), 148-169.
Martin, A. (2002). Motivation and Academic Resilience: Developing a Model for Student Enhancement. Australian Journal of Education, 46(1), 34-49.
Masten, A. S. & Reed, M. J. (2002). Resilience in development. In C. R. Snyder & S. J. Lopez (Eds.), The handbook of positive psychology (pp. 74-88). Oxford University Press.
O’Connell, A. A. (2006). Logistic regression models for ordinal response variables. Thousand Oaks, California: Sage Publications.
Organisation for Economic Co-operation and Development [OECD]. (2011a). Against the odds: Disadvantaged students who succeed in school. OECD Publishing. Retrieved from:
http://dx.doi.org/10.1787/9789264090873-en
Organisation for Economic Co-operation and Development [OECD]. (2011b). Lessons from PISA for the United States, strong performers and successful reformers in education. OECD Publishing. Retrieved from http://dx.doi.org/10.1787/9789264096660-en
Organisation for Economic Co-operation and Development [OECD]. (2013). PISA 2012 results: Excellence through equity: giving every student the chance to succeed (Volume II). OECD Publishing. Retrieved from http://dx.doi.org/10.1787/9789264201132-en
Roorda, D. L., Koomen, H. M. Y., Spilt, J. L., & Oort, F. J. (2011). The influence of affective teacher-student relationships on students’ school engagement and achievement: A meta-analytic approach. Review of Educational Research, 81, 493–529.
Rouse, K.A. (2001). Resilient students' goals and motivation. Journal of Adolescence, 24, 461–472. Schoon, I., Sacker, A., & Bartley, M. (2003). Socio-economic adversity and psychosocial adjustment: a
developmental-contextual perspective. Social Science and Medicine, 57, 1001-1015
Wang, M. C., Haertel, G. D., & Walberg, H. J. (1994). Educational resilience in inner cities. In M. C. Wang & E. W. Gordon (Eds.), Educational resilience in inner-city America: Challenges and prospects (pp. 45-72). Hillsdale, NJ: Erlbaum.
Waxman, H. C., & Huang, S. L. (1996). Motivation and learning environment differences between resilient and nonresilient inner-city middle school students. Journal of Educational Research, 90, 93-102. Werner, E. E., & Smith, R. S. (1992). Overcoming the odds: High risk children from birth to adulthood. New
York: Cornell University Press.
Williams, L. J., & Downing. J. E. (1998). Membership and belonging in inclusive classrooms: What do middle school students have to say? Journal of the Association for Persons with Severe Handicaps, 23, 98-1 10.
Zolkoski, S. M. & Bullock, L. M. (2012). Resilience in children and youth: A review. Children and Youth Services Review, 34, 2295-2303.
GENİŞ ÖZET
Giriş
Öğrenci başarısını açıklayan çeşitli faktörler arasında en etkili olanlardan biri muhtemelen öğrencinin sosyo-ekonomik statüsüdür (SES). İlk yapılan tanımlardan birinde, Mueller ve Parcel (1981) SES’in bir bireyin elde edebileceği belirli refah, güç, sosyal statü katmanı olduğu belirtilmiştir. SES’in öğrenci başarısı üzerindeki etkisi konusunda ise, Coleman ve diğ. (1966) Eğitim Fırsatlarının Eşitliliği başlıklı bir rapor yazmışlar ve düşük SES’in okul başarısının önünde bir engel olduğunu belirtmişlerdir. O zamandan bu yana pek bir değişiklik olmamış ve öğrencilerin SES yapıları hala akademik performans ile pozitif ilişki içinde olmuştur (Caldas & Banskton, 1997, 2001; OECD, 2011a; Kalender & Berberoglu, 2009; Schoon, et al., 2003). SES ile ilgili dezavantajlarını yenen ve akademik olarak yüksek başarı düzeylerine erişen bir öğrenci grubu mevcuttur. Bu grup “akademik olarak üstün başarılı öğrenciler” olarak adlandırılır ve kültürel sermaye ya da finansal kaynak yoklukları konusundaki olumsuzlukları aşıp yaşamlarındaki tüm olumsuzluklara rağmen okulda üstün başarı gösterirler (OECD, 2011a). Öğrenci Başarısını Değerlendirme Programı (Programme for International Student Assessment [PISA]) uygulamalarından elde edilen sonuçlar üstün başarılı ve SES bakımından dezavantajlı öğrenciler konusunda önemli bilgiler sağlamaktadır. Üye ülkelerinde öğrencilerin yaklaşık %6’sı OECD tarafından üstün başarılı
olarak tanımlanmaktadır. PISA 2012’den gelen ilk bulgular, bir öğrenci SES bakımından avantajlı ise, okuma becerisinin 38 puanlık bir artış gösterdiğini işaret etmektedir (OECD, 2011a). Buna paralel olarak, OECD (2013) dezavantajlı öğrencileri performanslarının artırılması için çaba göstermenin düşük SES ülkelerinde politika yapıcıların temel önceliklerinden biri olmasını önermektedir. Üstün başarı konusunda, Türkiye PISA 2003 ve 2012 uygulamaları arasında artan üstün başarılı öğrenci oranı ile önemli bir örnek teşkil etmektedir (OECD, 2013). PISA 2003’te OECD ülkelerindeki üstün başarılı öğrenci oranı %6.1 iken, bu oran PISA 2012’de 4.8’e düşmüştür. Buna karşın, Türk üstün başarılı öğrencilerin oranı PISA 2012’de SES bakımından dezavantajlı öğrenciler arasında %40 olarak bulunmuştur.
Bu çalışmanın amacı SES bakımından dezavantajlı olup da üstün başarı gösteri öğrencilerin profilini ortata koymaktır. Bu bağlamda, düşük SES düzeyine sahip üstün başarılı ve düşük başarılı öğrenci grupları arasındaki okuma becerisi düzeyleri farklılıklarını açıklayan ve PISA 2012 öğrenci anketinden alınan öğretmen ve okul ile ilgili faktörler kullanılmıştır. İlk olarak, bu iki grup öğrenci arasındaki okuma becerisi farklılıklarını açıklayabilen değişkenleri bulmak için bir binary lojistik regresyon uygulanmıştır. Daha sonra, elde edilen değişkenler ve bu değişkenlere katılma/katılmama oranlarına bakılarak, üstün başarılı öğrencilerin profili tanımlanmaya çalışılmıştır. Bu çalışma bulgularının SES bakımından Türkiye’deki üstün başarılı öğrenci oranının artırılması konusuna ışık tutması beklenmektedir.
Yöntem
OECD tarafından uygulanan PISA 15 yaşındaki öğrencilerin okuma, matematik ve fen alanlarındaki okur-yazarlık düzeylerini, okulda öğrendiklerini günlük hayatlarında nasıl kullandıklarını dikkate alarak ölçmeyi hedeflemektedir. Bu çalışmada, yazılı metinleri anlama, kullanma, yansıtma şeklinde OECD (2013) tarafından tanımlandığı haliyle ile okuma becerisi dâhil edilmiştir.PISA 2012’ye toplam 4848 öğrenci katılmıştır. Bu öğrenciler 12 istatistiksel bölge ve 13 okul türünden katmanlı sistematik örnekleme ile seçilmişlerdir. Dezavantajlı öğrenciler OECD tarafından geliştirilen Ekonomik, Sosyal ve Kültürel Statü indeksi kullanılarak (Economic, Social and Cultural Status [ESCS]) belirlenmiştir. Bu indeksin geliştirilmesinde ebeveynlerin meslekleri, en yüksek ebeveyn eğitim düzeyi ile evdeki “klasik” kültürle ilgili olan aile refahı, evde sahip bulunulan eğitsel kaynaklar indeksi dikkate alınmıştır. OECD ayrıca üstün başarılı öğrencileri, ESCS indeksine göre ilgili ülkenin en alt çeyreğinde olup da, SES düzeyleri kontrol edildikten sonra tüm ülkeler içinde başarı puanı bakımından en üst çeyrekte olanlar tanımlamaktadır (OECD, 2013). Bu çalışmada da, SES olarak dezavantajlı olan öğrenciler ESCS indeksinin en alt çeyreğinde yer alanlar olarak tanımlanırken, üstün başarılı öğrenciler ise bu grup içinde başarı dağılımına göre en üst çeyrektekiler olarak alınmıştır.
Bu çalışmada, SES bakımından dezavantajlı öğrenciler OECD tarafından PISA için tanımlanmış olan Ekonnomik, Sosyal ve Kültürel Düzey (Economic, Social and Cultural Status, ESCS) indeksine göre en alt çeyrekteki 1200 kişinin tamamı olarak seçilmiştir. Daha sonra, düşük başarılı ve üstün başarılı öğrenciler okuma becerisi puanına göre en alt (n=300, Mokuma=342.737, SD=39.88, Yeterlilik Düzeyi = 1a) ve en üst (n=300, Mokuma=538.63, SD=38.40, Yeterlilik Düzeyi=3) çeyreklerdeki öğrenciler olacak şekilde çalışmaya dâhil edilmiştir.
Çalışmada toplam 5 boyuttan 28 madde lojistik regresyon analizine dahil edilmiştir. Bu maddeler PISA 2012 Öğrenci Anketinde ST86, ST87, ST88, ST89 ve ST91 kodlarına karşılık gelen Öğrenci-Öğretmen İlişkisi, Aidiyet Duygusu, Okulda Öğrenmeye Karşı
___________________________________________________________________________________________________________________ Tutum Okula Karşı Tutum ve Algılanan Denetim boyutlarındaki tüm soruları kapsamaktadır. Bağımlı değişken ise Okuma Değişkeni 1 (PV1READ) olarak alınmıştır. Sonuç ve Tartışma
28 gözlenen değişkenden, 8 tanesinin düşük ve üstün başarılı öğrenciler arasındaki okuma becerisi farkını açıkladığı görülmüştür. Bu değişkenler: Öğretmenler ile iyi anlaşırım, Öğretmenler Öğrencilere Yardımcı Olur, Öğretmenler Öğrencilere Adil Davranır, Okuldaki Her şey Benim için İdealdir, Okul Vakit Kaybıdır, Yüksek Notlar Almaktan Hoşlanırım, Eğer İstersem Daha Başarılı Olabilirim ve Ne Yaparsam Yapayım Başarılı Olamıyorum. Bu maddeler iki grup öğrenciyi yüksek bir sınıflandırma oranı ile ayırabilmiştir (79.4%).
Üstün başarılı öğrenci profile incelendiğinde, anlamlı bulunan değişkenler göre şöyle bir durum ortaya çıkmaktadır: üstün başarılı öğrenciler (i) ne yaparlarsa yapsınlar başarısız olacaklarına büyük oranda karşı çıkmakta (%83.4), (ii) okul ortamının kendileri için ideal olup olmadığı konusunda eşit kararsız kalmakta (%58.3), okulun kendileri için vakit kaybı olduğunu düşünmemekte (%93.0), (iv) yüksek notlar almaktan zevk almakta (%99.0), (v) çoğunlukla öğretmenlerinin kendileri yardım ettiğini düşünmekte (%72.5), (vi) öğretmenlerin öğrencilere adil davrandığı görüşünü onaylamakta (%81.4), (vii) istedikleri takdirden başarılı olabileceklerini düşünmekte (%93.4) ve öğretmenleri ile iyi geçinmektedirler (92.5%).
Buna göre, akademik üstün başarılı öğrencilerin düşük başarılı olan öğrenciler ile karşılaştırıldıklarında okul ve öğretmene karşı olumlu tutumlar gösterdikleri söylenebilir.
Günümüz öğretim programı geliştirme felsefeleri öğrenciyi odak noktasına koyuyor olsa da, öğretmen Türkiye de dâhil pek çok ülkede halen öğrenci başarısının önemli bir yordayıcısıdır (Kalender & Berberoglu, 2009). Bu çalışma da öğrencilerin okul ve öğretmene karşı olumlu tutum geliştirmesinde öğretmenin rolüne de dikkat çekmektedir (OECD, 2011a).
Çalışmada elde edilen bulgular literatür ile de uyuşmaktadır (Alva, 1991; Martin, 2002; Wang, Haertel, & Walberg, 1994). Düşük SES başarı üzerinde olumsuz bir etkiye sahip olsa da, düşük başarı kalıcı bir durum olmak zorunda değildir. Öğretmenin sağlayacağı yapıcı destek ile öğrenci başarısı artırılabilir.
APPENDIX
Abbreviated Item Stems and Their Corresponding Full Stems
Abbreviated Stem Full Stem
Student-Teacher Relations
Get Along with Teachers Students get along well with most teachers Teachers Are Interested Most teachers are interested in students’ well-being Teachers Listen to Students Most of my teachers really listen to what I have to say Teachers Help Students If I need extra help, I will receive it from my teachers Teachers Treat Students Fair Most of my teachers treat me fairly
Sense of Belonging
Feel Like Outsider I feel like an outsider at school Make Friends Easily I make friends easily at school Belong at School I feel like I belong at school
Feel Awkward at School I feel awkward and out of place in my school Liked by Other Students Other students seem to like me
Feel Lonely at School I feel lonely at school Feel Happy at School I feel happy at school Things Are Ideal at School Things are ideal in my school Satisfied at School I am satisfied with my school Attitude towards School
Does Little to Prepare Me for Life School has done little to prepare me for adult life when I leave school
Waste of Time School has been a waste of time
Gave Me Confidence School has helped give me confidence to make decisions
Useful for Job School has taught me things which could be useful in a job
Attitude towards School
Helps to Get a Job Trying hard at school will help me get a good job Prepare for College Trying hard at school will help me get into a good college Enjoy Good Grades I enjoy receiving good grades
___________________________________________________________________________________________________________________ Perceived Control in School
Can Succeed with Enough Effort If I put in enough effort, I can succeed in school
My Choice Whether I Will Be Good It is completely my choice whether or not I do well at school
Problems Prevent from Putting Effort into School
Family demands or other problems prevent me from putting a lot of time into my school work
Different Teachers Would Make Me Try
Harder If I had different teachers, I would try harder at school Could Perform Well if I Wanted If I wanted to, I could perform well at school
Perform Poor Regardless I perform poorly at school whether or not I study for my exams