Role of red cell distribution width in
assessing response to treatment and
prognosis in community‑acquired
pneumonia: A prospective study
Halit Çınarka, Aziz Gümüş1, Songül Özyurt1, Mevlüt Karataş1, Derya Gıakoup1, Medine Cumhur Cüre1, Servet Kayhan2, Deniz Dogan3, Ünal Şahin1
ORCID:
Halit Çınarka: https://orcid.org/0000-0002-4910-149X Aziz Gümüş: https://orcid.org/0000-0001-5396-5402 Songül Özyurt: https://orcid.org/0000-0002-9768-1425 Mevlüt Karataş: https://orcid.org/0000-0003-2524-9964 Derya Gıakoup: https://orcid.org/0000-0002-6897-4421 Medine Cumhur Cüre: https://orcid.org/0000-0001-9253-6459 Servet Kayhan: https://orcid.org/0000-0003-4226-2781 Deniz Dogan: https://orcid.org/0000-0003-2596-3113 Ünal Şahin: https://orcid.org/0000-0003-1836-6193 Abstract:
BACKGROUND AND AIM: Red blood cell distribution width (RDW) elevation occurs in various inflammatory/infectious conditions. RDW levels during monitoring have not been investigated prospectively in community‑acquired pneumonia (CAP). In CAP, the relationship between antibiotherapy response and RDW levels is unclear.
MATERIALS AND METHODS: This prospective cohort study included a total of 65 CAP patients. Total complete blood cell (including RDW) count, blood biochemistry analysis, and arterial blood gas tests were performed on admission. RDW was also performed on the 7th day.
RESULTS: Total mean RDW level was 16.2% ± 1.9% in the study population. The level was 17.7% ± 2.1% in nonsurviving CAP patients and 15.9% ± 1.8% in surviving CAP patients (P = 0.01). Pretreatment RDW levels were 16.2% ± 1.9% as compared to 15.3% ± 2.2% on the 7th day (P = 0.002). An RDW cutoff >16.5% predicted 30‑day mortality with 78% sensitivity and 70% specificity. The risk of 30‑day mortality was 9‑fold higher in patients with elevated RDW as assessed by multivariate logistic regression analysis for CAP.
CONCLUSION: RDW can be used as an important parameter in assessing response to antibiotherapy. We also speculate that high RDW is a poor prognostic marker for CAP.
Keywords:
Pneumonia, prognosis, red blood cell distribution width
Introduction
P
neumonia is a significant cause of mortality and morbidity. While there has been a decrease in morbidity andmortality in many other infectious diseases due to widespread vaccination programs and advanced antibiotic procedures, the same success has not been achieved in community‑acquired pneumonia (CAP).
Address for correspondence: Dr. Deniz Dogan, Department of Chest Diseases, Gulhane Training and Research Hospital, University of Health Science, Ankara 06018, Turkey. E-mail: dr_denizz@yahoo. com Received: 28-12-2018 Revised: 07-03-2019 Accepted:19-03-2019 Published: 30-12-2019 Department of Chest Diseases, University of Health Science, Yedikule Chest Diseases and Chest Surgery Training and Research Hospital, 1University of Altınbaş, Medical Park Hospital, Istanbul, 2University of
Health Science, Recep Tayyip Erdoğan University, School of Medicine, Rize, 3Department of Chest Diseases, University of Health Science, Gulhane Training and Research Hospital, Ankara, Turkey Access this article online
Quick Response Code:
Website:
www.eurasianjpulmonol.com
DOI:
10.4103/ejop.ejop_80_18
How to cite this article: Çınarka H, Gümüş A,
Özyurt S, Karataş M, Gıakoup D, Cüre MC, et al. Role of red cell distribution width in assessing response to treatment and prognosis in community-acquired pneumonia: A prospective study. Eurasian J Pulmonol 2019;21:182-6.
This is an open access journal, and articles are distributed under the terms of the Creative Commons Attribution‑NonCommercial‑ShareAlike 4.0 License, which allows others to remix, tweak, and build upon the work non‑commercially, as long as appropriate credit is given and the new creations are licensed under the identical terms.
Pneumonia is one of the main causes of infection‑related deaths in the USA and Great Britain and stands in the sixth place in terms of general causes of death. Mortality levels have been reported to be 1%–5% for outpatients, 12% for hospitalized patients, and approximately 40% for those treated in intensive care units (ICUs).[1‑4] Several markers are widely used for
diagnosis, treatment, and follow‑up of CAP such as C‑reactive protein (CRP) and procalcitonin, and also there are some used for assessment of the severity of the disease such as CURB‑65 and the pneumonia severity index (PSI). The PSI and CURB‑65 are age dependent, and an elevated score in a young adult is a cause for concern. Red blood cell distribution width (RDW) is a technique involving the calculation of size variation among circulating red blood cells. RDW elevation occurs in various inflammatory conditions. High RDW levels have been shown to be associated with poor prognosis in CAP in previous studies.[5,6] However,
those studies were retrospective, and the course of RDW levels during monitoring was not investigated. The relationship between antibiotherapy response and RDW levels is therefore unclear.
The purpose of this prospective study was to investigate the prognostic role of RDW in CAP at the time of presentation and its current role in assessing the response to treatment.
Materials and Methods
Permission for this prospective, observational, descriptive study was granted by the ethics committee of Recep Tayyip Erdogan University. It was designed and conducted in accordance with the Declaration of Helsinki, between January 15, 2013, and September 31, 2013, in our pulmonology clinic. All subjects gave informed consent. We recruited 65 consecutive inpatients. Total complete blood cell (CBC) count, blood biochemistry analysis, and arterial blood gas tests were performed. Pulmonary X‑rays were taken. Diagnosis of CAP was based on the modern Infectious Diseases Society of America and American Thoracic Society guidelines.[7] At least one clinical finding (yellow,
dense phlegm, cough temperature >37.8°C) or at least two minor criteria (tachypnea, dyspnea, impaired orientation, pleural pain, pulmonary consolidation or leukocyte count >12,000 cells/µL) in addition to infiltrative changes at pulmonary X‑ray were determined as diagnostic criteria for CAP. Severity of pneumonia was calculated on the basis of PSI and CURB‑65 values. The patients who hospitalized due to low general health status but have low CURB‑65 and PSI scores were also included in the study. Patients were started on empiric treatment. Venous blood samples were collected, and full blood count, CRP,
and erythrocyte sedimentation rate (ESR) tests were performed on the 1st and 7th days. Patients’ demographic
characteristics, accompanying diseases, pneumonia symptoms, and findings and laboratory results were recorded.
Exclusion criteria
Patients who were referred from another hospital within the previous 15 days, patients who required ICU hospitalization, patients who were receiving antibiotherapy at presentation, patients with acute pulmonary embolism or severe immune deficiency and severe neutropenia, those receiving >10 mg prednisolone therapy for more than 1 month, patients with HIV positivity or active pulmonary tuberculosis, and patients aged under 18 were excluded.[5]
Laboratory analysis
CBC was calculated on admission with an automated hematology analyzer (Cell‑Dyn Ruby 100 Test/h, 2012, Abbott). RDW values were obtained as part of the CBC results. The normal reference value for RDW in our hospital laboratory ranges was between 11.6% and 14.8%. Arterial blood gas was taken from the radial artery with the patient in a seated posture after resting for 15 min, and analysis was performed immediately using a blood gas device (RAPIDLYLab 248/348 system, Siemens AG Healthcare, Germany).
Serum CRP levels were measured using the immunoturbidimetric method (Roche Diagnostics, GmbH, Mannheim, Germany). A normal reference value of 0.5 mg/dl was employed.
Statistical analysis
Compatibility of the study data with normal distribution was investigated using the Kolmogorov–Smirnov test. Results were expressed as mean (standard deviation) or median (quartiles). Student’s t‑test, the Mann–Whitney test, Fisher’s exact test, one‑way analysis of variance, and the Kruskal–Wallis test was employed, as appropriate, for intergroup comparisons. The paired sample t‑test or Wilcoxon’s test were determined to compare differences between baseline and subsequent data, depending on normal distribution. The Spearman or Pearson tests were used to assess correlation between variables. Receiver‑operating characteristic (ROC) analysis was used to assess optimal cutoff values of RDW for 30‑day mortality. Multivariate logistic regression analysis of predictor factors was performed based on a stepwise descending model with significance set at P < 0.01 for univariate analysis. P < 0.05 was considered statistically significant. Data were collected on SPSS for Mac 20.0 package program (SPSS Inc, Chicago, IL, USA) statistical software.
30‑day mortality with 78% sensitivity and 70% specificity. Univariate screening (as described in the Materials and Methods section) was used to assess all potential factors for Table 1: Baseline patients characteristics according to baseline red blood cell distribution width level
Characteristics RDW ≤16.5% (n=41) RDW >16.5% (n=24) Total (n=65) Age (year) 68±17 70±16 69±17 Male sex, % 24 (59) 18 (75) 42 (65) RR, min 22±4 21±4 22±4 Fever, °C 37.5±0.85 37.2±0.70 37.4±0.8 Pulse rate, min 93±16 92±15 93±15
SBP, mmHg 118±17 112±16 116±16.7 Leukocyte, ×103 13.9 (5‑15.8) 12.6 (5‑15.8) 13.9 (5‑15.8) MPV, fL 8±1.4 7.7±1 7.9±1.3 MCV, fL 87±5 85±6 86±5 CRP, mg/dL 21±13 17±11 20±12 PaO2, mmHg 67.6±10 66.6±13 67.3±11 SO2, % 93±3 91±5 92±4 Hb, g/dL 12.9±1.7 11.8±1.9 12.5±1.8 Creatinine, mg/dL 0.96 (0.48‑2.2) 1.0 (0.7‑6.3) 0.99 (0.48‑6.3) COPD, % 14.1 16.4 30.5 CHF, % 8.3 7.1 15.4 DM, % 5.0 4.2 9.2 CVD, % 3.3 5.4 7.7 Cancer, % 0.6 0.9 1.5
Values were shown as standard deviation and interquartile range. RR: Respiratory rate, MPV: Mean platelet volume, SBP: Systolic blood pressure, CRP: C‑reactive protein, MCV: Mean corpuscular volume, fL: Femtoliter, COPD: Chronic obstructive pulmonary disease, CHF: Congestive heart failure, DM: Diabetes mellitus, CVD: Cerebrovascular disease, RDW: Red blood cell distribution width, Hb: Hemoglobin
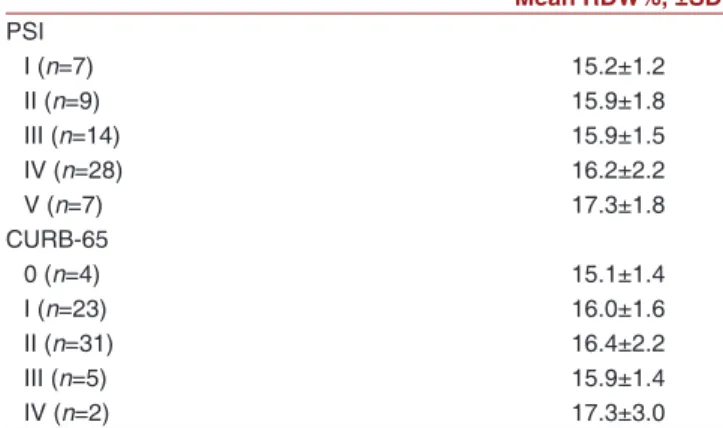
Table 2: Red blood cell distribution width levels according to pneumonia severity index, and CURB‑65
Mean RDW%, ±SD PSI I (n=7) 15.2±1.2 II (n=9) 15.9±1.8 III (n=14) 15.9±1.5 IV (n=28) 16.2±2.2 V (n=7) 17.3±1.8 CURB‑65 0 (n=4) 15.1±1.4 I (n=23) 16.0±1.6 II (n=31) 16.4±2.2 III (n=5) 15.9±1.4 IV (n=2) 17.3±3.0
Values are given SD. SD: Standard deviation, PSI: Pneumonia severity index, RDW: Red blood cell distribution width
Table 3: Baseline and 7th after antibiotherapy treatment laboratory parameters in patients with pneumonia
First day Seventy day P
RDW, % 16.2±1.9 15.3±2.2 0.002
Leukocyte, %, ×103 13.8 (2.7‑15.8) 8.7 (3.6‑25.4) <0.001
CRP, mg/dL 19.6±12 5.4±5.4 <0.001
RDW: Red blood cell distribution width, CRP: C‑reactive protein
Results
Sixty‑five patients with CAP were enrolled in the study. Sixty‑five percent (42 patients) were male and the mean age was 69 years. Baseline data for the study population are shown in Table 1, according to the RDW cutoff value. Hemoglobin (Hb) values were significantly lower in patients with RDW >16.5% (P = 0.016). Blood or sputum cultures were positive in eight cases (one
Legionella pneumophila [urine antigen positive], five Staphylococcus aureus coagulase‑negative staphylococci,
one Pseudomonas spp., and one Klebsiella pneumoniae). Accompanying comorbidities were chronic obstructive pulmonary disease at 30.8%, congestive heart failure at 15.4%, diabetes mellitus at 9.2%, cerebrovascular disease at 7.7%, and cancer at 1.5%. All accompanying comorbidities were under control. The 30‑day mortality rate was 13.8% (9 patients). Mean length of hospitalization was 8 days.[7‑10] Five (8%) patients required admission to the ICU.
The total mean RDW level was 16.2% ± 1.9%. The level was 17.7% ± 2.1% in nine nonsurviving patients and 15.9% ± 1.8% in surviving patients (P = 0.01). RDW level was lowest in the PSI‑I group and highest in the PSI‑V group. However, no statistically significant difference was determined among the groups. RDW levels were lowest in patients with a CURB‑65 score of 0 and highest in CURB‑IV. No significant difference was again determined among the groups [Table 2].
RDW, leukocyte, and CRP levels were investigated on the 7th day of treatment. Pretreatment and 7th‑day RDW levels
were 16.2% ± 1.9% and 15.3% ± 2.2%, respectively. The difference was statistically significant (P = 0.002) [Table 3]. No correlation was determined between RDW and age, mean corpuscular volume, Hb, leukocytes, or CRP (data not shown) values. ROC analysis was performed to determine the RDW cutoff point predicting 30‑day mortality [Figure 1]. Area under the curve value of 0.736 (95% confidence interval: 0.550–0.922, P < 0.001) was determined. An RDW value >16.5% predicted
Figure 1: Receiver operating characteristic analysis was shown to determine the
red blood cell distribution width cutoff point predicting 30-day mortality, and red blood cell distribution width levels on the 1st and 7th day of treatment
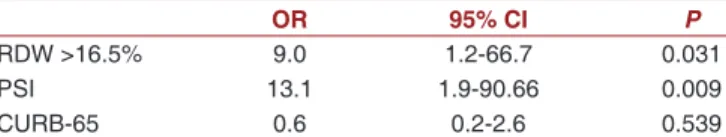
30‑day mortality of CAP. Those parameters associated with 30‑day mortality and with a significance level <0.01 were then employed in stepwise multiple regression analysis. The final regression model consisted of RDW, CURB‑65, and PSI. RDW level and PSI were identified as independent predictors of 30‑day mortality in CAP [Table 4].
Discussion
Two important conclusions emerge from this study. The first is that RDW can be used in assessing response to treatment in CAP. The second is that elevated RDW is an independent predictor of mortality in CAP.
The relationship between RDW levels and CAP is unclear. Inflammation and oxidative stress can affect red cell homeostasis. RDW has recently been shown to be an independent risk factor in inflammatory and infectious conditions. Ku et al. reported that RDW is an independent predictor of mortality in Gram‑negative bacteremia.[8] Elevated RDW levels have also been
associated with acute and chronic hepatitis B[9] and
inflammatory bowel disease activity.[10] Lippi et al.
reported a correlation between high RDW and elevated inflammation indices, including ESR and CRP. This correlation was independent of concomitant diseases and applied even after exclusion of anemic patients from the statistical analysis.[11]
CURB‑65 and PSI are frequently used in deciding on hospitalization and predicting mortality. However, these risk models are complex and may not be capable to be used everywhere. RDW, however, is part of CBC, which can also be measured at the first stage. In our study, RDW >16.5 was identified as a warning parameter on the subject of patient hospitalization.
When RDW level was compared with CURB‑65 and PSI scoring at multivariate analysis, the risk of 30‑day mortality was 9‑fold higher in patients with elevated RDW. An RDW cutoff point of >16.5% exhibited 78% sensitivity and 70% specificity for 30‑day mortality. In a retrospective study of 744 patients, Lee et al. reported 5‑fold greater 30‑day mortality in subjects with RDW >15.2 compared to those with RDW <13.3%.[5]
Braun et al. reported 2.5‑fold greater 90‑day mortality in
subjects with RDW levels above 15 as compared to those with RDW levels below that.[12] In the light of these data,
RDW appears to be a parameter that can be effectively used in predicting mortality in CAP.
Treatment of pneumonia needs to be started as early as possible. Guidelines emphasize the importance of the timing of antibiotherapy for therapeutic success.that should be started <4 h after CAP diagnosis.[13] Markers,
such as CRP and procalcitonin, are used in the diagnosis and follow‑up of pneumonia. However, these are generally investigated in secondary and tertiary hospitals and are relatively expensive. RDW is capable of being used in follow‑up of treatment of CAP since a significant decrease was observed after treatment in 1st‑ and 7th‑day
RDW values (P = 0.002). RDW level increase compared to basal level has also been shown in patients with sarcoidosis that progressed during monitoring.[14] RDW
is part of CBC, an inexpensive test, which can be easily applied even in primary health institutions. Elevated RDW levels can warn physicians regarding the severity of the disease, and changes in RDW levels can be used in the evaluation of the effectiveness of the treatment being administered.
RDW levels can increase with age. Braun et al. enrolled patients aged <60 and showed that RDW was correlated with mortality and morbidity in hospitalized patients with CAP.[12] In another study involving RDW, the mean age
of enrolled patients was 70.1 years.[5] The mean age of our
patients was 69 years, and no correlation between RDW and age was determined. In addition, advanced age did not predict mortality at multivariate analysis in our study. There are several limitations to this study. The first is the relatively low patient number. It was therefore impossible to investigate secondary conditions such as intensive care and vasopressor requirements. Second, we were unable to investigate the causes of RDW elevation, such as iron or Vitamin B12 deficiency, which are capable of obscuring the relationship between RDW and adverse outcomes. However, anemia was not identified as a predictor of all‑cause mortality at multivariate regression analysis.
Conclusion
An elevated RDW level at the time of presentation can be used as an independent predictor providing clues about mortality, and pre‑and post‑treatment investigation of RDW can be used as an important parameter in assessing response to antibiotherapy.
Financial support and sponsorship Nil.
Conflicts of interest
There are no conflicts of interest. Table 4: Independent predictors of
community‑acquired pneumonia 30‑day mortality multivariate logistic regression analysis
OR 95% CI P
RDW >16.5% 9.0 1.2‑66.7 0.031
PSI 13.1 1.9‑90.66 0.009
CURB‑65 0.6 0.2‑2.6 0.539
RDW: Red blood cell distribution width, PSI: Pneumonia severity index, OR: Odds ratio, CI: Confidence interval
References
1. Niederman MS, Mandell LA, Anzueto A, Bass JB, Broughton WA, Campbell GD, et al. Guidelines for the management of adults with community‑acquired pneumonia. Diagnosis, assessment of severity, antimicrobial therapy, and prevention. Am J Respir Crit Care Med 2001;163:1730‑54.
2. Mandell LA. Epidemiology and etiology of community‑acquired pneumonia. Infect Dis Clin North Am 2004;18:761‑76, vii. 3. Özlü T, Bülbül Y, Alataş F, Arseven O, Coşkun AŞ, Çilli A,
et al. Turkish thoracic society community‑acquired pneumonia
guidelines. Turk Toraks Derg 2009;10:1‑16.
4. Waterer GW, Rello J, Wundernk RG. Management of community‑acquired pneumonia in adults: Concise clinical review. Am J Respir Crit Care Med 2011;183:157‑64.
5. Lee JH, Chung HJ, Kim K, Jo YH, Rhee JE, Kim YJ, et al. Red cell distribution width as a prognostic marker in patients with community‑acquired pneumonia. Am J Emerg Med 2013;31:72‑9.
6. Braun E, Kheir J, Mashiach T, Naffaa M, Azzam ZS. Is elevated red cell distribution width a prognostic predictor in adult patients with community acquired pneumonia? BMC Infect Dis 2014;14:129.
7. Mandell LA, Wunderink RG, Anzueto A, Bartlett JG, Campbell GD, Dean NC, et al. Infectious diseases society of America/American Thoracic Society consensus guidelines on the management of community‑acquired pneumonia in adults. Clin Infect Dis
2007;44 Suppl 2:S27‑72.
8. Ku NS, Kim HW, Oh HJ, Kim YC, Kim MH, Song JE, et al. Red blood cell distribution width is an independent predictor of mortality in patients with gram‑negative bacteremia. Shock 2012;38:123‑7.
9. Lou Y, Wang M, Mao W. Clinical usefulness of measuring red blood cell distribution width in patients with hepatitis B. PLoS One 2012;7:e37644.
10. Song CS, Park DI, Yoon MY, Seok HS, Park JH, Kim HJ, et al. Association between red cell distribution width and disease activity in patients with inflammatory bowel disease. Dig Dis Sci 2012;57:1033‑8.
11. Lippi G, Targher G, Montagnana M, Salvagno GL, Zoppini G, Guidi GC. Relation between red blood cell distribution width and inflammatory biomarkers in a large cohort of unselected outpatients. Arch Pathol Lab Med 2009;133:628‑32.
12. Braun E, Domany E, Kenig Y, Mazor Y, Makhoul BF, Azzam ZS. Elevated red cell distribution width predicts poor outcome in young patients with community acquired pneumonia. Crit Care 2011;15:R194.
13. Houck PM, Bratzler DW, Nsa W, Ma A, Bartlett JG. Timing of antibiotic administration and outcomes for medicare patients hospitalized with community‑acquired pneumonia. Arch Intern Med 2004;164:637‑44.
14. Ozsu S, Ozcelik N, Oztuna F, Ozlu T. Prognostic value of red cell distribution width in patients with sarcoidosis. Clin Respir J 2015;9:34‑8.