Araştırma Uysal Satılmış et al. / Kirklareli University Journal of Engineering and Science 3(2017) 95-106
KINETIC CHARACTERIZATION OF GAG:CE PHOSPHOR
Sibel UYSAL SATILMIŞ1, Arzu EGE1, Levent TÜRKLER2, Zekai TEK1, Elizabeth J. POPOVICI3 1
Manisa Celal Bayar University, Faculty of Science and Letters, Department of Physics, Manisa, Turkey
2 Ege University, Bergama Technical and Business College, İzmir, Turkey
3 Raluca Ripan Institute for Research in Chemistry, Babes Bolyai University, Cluj-Napoca, Romania
Abstract
Thermoluminescence (TL) kinetic characterization of cerium (Ce3+) doped gadolinium aluminum
garnet (GAG) prepared by wet chemical synthesis method is presented in this study. Thermoluminescence glow curve of GAG phosphor after UV irradiation has two peaks at about 350 and 501 K with a heating rate of 2 Ks-1. Thermoluminescence kinetic parameters such as order of kinetics, frequency factor and activation energy associated with the main glow peak of the GAG:Ce phosphor have been calculated using various heating rates (VHR) computerized glow curve deconvulation (CGCD) and peak shape (PS) methods in this study. The activation energies obtained by VHR, PS and CGCD methods were calculated as 1.24, 1.11 and 1.14 eV, respectively. The frequency factors attained by these methods were found as 3.41x10¹¹, 1.80x10¹⁰ and 2.63x10¹⁰ s-1, respectively. Results acquired using all methods are discussed and compared.
Keywords: Gadolinium aluminum garnet, Thermoluminescence, Kinetic parameter
GAG:CE FOSFORUNUN KİNETİK KARAKTERİZASYONU Özet
Bu çalışmada, ıslak kimyasal sentez metodu ile hazırlanmış seryum (Ce+3) katkılı gadolinyum alüminyum garnetin termolüminesans (TL) kinetik karakterizasyonu sunulmuştur. UV ile ışınlanmasının ardından GAG fosforunun, termolüminesans ışıma eğrisi 2 Ks-1
ısıtma hızı ile yaklaşık olarak 350 ve 501 K de iki pike sahiptir. Çalışmada GAG:Ce fosforunun ana ışıma piki (501 K) ile ilişkili kinetik derece, frekans faktörü ve aktivasyon enerjisi gibi termolüminesans kinetik parametreleri, çeşitli ısıtma hızları (VHR), bilgisayarlı ışıma eğrisi dekonvulasyonu (CGCD) ve pik şekli (PS) metotları ile hesaplanmıştır. VHR, PS ve CGCD metotları ile elde edilen aktivasyon enerjileri sırasıyla 1,24, 1,11 ve 1,14 eV olarak hesaplanmıştır. Bu metotlarla ulaşılan frekans faktörleri 3,41x10¹¹
, 1,80x10¹⁰ ve 2,63x10¹⁰ s-1 olarak bulunmuştur. Tüm metotlardan elde edilen sonuçlar kıyaslanmış ve tartışılmıştır.
Anahtar Kelimeler: Gadolinyum alüminyum garnet, Termolüminesans, Kinetik parametre.
Araştırma Uysal Satılmış et al. / Kirklareli University Journal of Engineering and Science 3(2017) 95-106
1. INTRODUCTION
Garnet crystal is commonly used at high temperatures due to their high chemical and thermal stability. Moreover, it is used in the solid-state laser as host materials, the refractory coating fillers, magnetic materials, and phosphor powders [1-3]. The optical properties of Ce-activated garnet series used in white light emitting diodes have been remarkable in recent years [4]. Gadolinium aluminate is nowadays being investigated quite interesting as a material for, electronic, optical, magnetic and structural applications [5]. Information on the luminescence properties of cerium doped gadolinium aluminum garnet is limited to a few studies. The researches were related to gadolinium aluminum garnet preparation methods and their luminescent properties [1-8].
The recent increase in solar ultraviolet (UV) radiation reaching the Earth's surface due to the depletion of stratospheric ozone has been a major concern, due to the harmful effects on living organisms associated to the UVB (320–290 nm) and UVA (400–320 nm) components of the solar spectrum. Additionally, UVB may have several adverse influences on planktons in sea ecosystem [9, 10].
Thermoluminescence dosimeters have some superior characteristics such as their availability, being cheap and easy to use in the determination of exposed dose to living organisms. Recently, studies related to UV radiation measurement by thermoluminescent dosimeters were increased due to being cheap and easy technique in the UV measurement. This has led us to examine the usability of GAG:Ce phosphor in the measurement of UV radiation dose. The determination of the trapping parameters from thermoluminescence glow curves is an important research subject to improve the properties of the material as dosimetric usage.
In the present study, cerium-doped gadolinium aluminate phosphor prepared by a wet chemical synthesis route was used. The thermoluminescence kinetic characterization of the material was investigated after UV irradiation. It was observed that glow curve of the phosphor was consisted of two peaks at about 353 and 501 K. The kinetic parameters such as kinetic order (b), activation energy (E), and frequency factor (s) were calculated using various heating rates (VHR), Chen peak shape methods and computerized glow curve analysis (GCGD) were used.
Araştırma Uysal Satılmış et al. / Kirklareli University Journal of Engineering and Science 3(2017) 95-106
2. MATERIAL AND METHODS
The cerium-doped gadolinium aluminate phosphor used in this study was synthesized by wet-chemical route via the reagent simultaneous addition (WCS-SimAdd ) technique. All experimental details can be found in our earlier works [8]. A Harshaw 3500 TLD reader was used for recording TSL glow curves. All TSL measurements were carried out immediately after irradiating using UV light (Philips UV 100 lamp) with 311 nm wavelength.
TSL kinetic parameters of activation energy (E), frequency factor (s) and kinetic order have a sensible impact on the TSL characterization of a phosphor. Therefore, the knowledge of kinetic parameters has critical importance for understanding the thermoluminescence phenomenon in the phosphor, and there have been many methods for determining these parameters experimentally [11].
In this study peak shape (PS), various heating rates (VHR) methods and computerized glow curve deconvulation (CGCD) analysis were used to analyze the kinetic characterization for GAG:Ce phosphors.
In the peak shape method developed by Chen [12], the shape of the glow curve is used to calculate E, s and b parameters. The peak temperature Tm and two temperatures (T1 and T2) on ascending and descending side of Tm at the half of maximum intensity, the half width parameters (, , ) and the symmetry factor (
g ) were used in the calculation of the kinetic parameters in the peak shape methods. Following equations (1-3) were applied in the Peak shape method. ) 2 ( ) ( 2 m m kT b kT c E (1) Where is T2 T1, T2 Tm and Tm T1, 1 ) 42 . 0 ( 2 . 10 52 . 2 0 ) 42 . 0 ( 3 . 7 976 . 0 ) 42 . 0 ( 2 . 4 58 . 1 ) 42 . 0 ( 0 . 3 51 . 1 ' ' ' ' b c b c b c g g g g (2)
The frequency factor can be evaluated using the Equation
1 2 exp( ) 1 ( 1) m m m b kT E kT E s (3)Araştırma Uysal Satılmış et al. / Kirklareli University Journal of Engineering and Science 3(2017) 95-106
)
/
ln(
/
)
/
ln(
T
m2
E
kT
m
E
ks
Where b is the order of the kinetics and m=2kTm/E.
The VHR method is based on the recording the maximum temperatures of the glow peak with using different heating rates [13, 14]. The maximum temperature Tm is associated with the heating rate β, this relation could be described in equation (4):
(4)
Where k is Boltzmann’s constant, Tm is the maximum temperature of the glow peak, E is the activation energy (eV) and s is the frequency factor (s-1). After recording Tm with a number of different heating rates, E could be calculated from the slope of the straight line obtained from the ln (T2m/ β) versus 1/Tm plot. The intercept of the slope of this plot gives the value of frequency factor. Kitis and Tuyn proposed a model to correct for the temperature lag based on TSL measurements [15]. This model is given as an equation (5):
b a a m b m T c T ln (5)
Where c is a constant and Tma and Tmb are the maximum temperatures of glow peaks with heating rates βa and βb, respectively.
The fitting of the glow curves was carried out the CGCD analysis program designed using Pascal programming language by Turkler [16]. The equation (6) given by Kitis et al [17] for the general order kinetic glow peak was used in the CGCD analysis.
1 2 2 1 exp ) 1 )( 1 ( exp ) ( b b M M M M M M b b M Z T T T kT E T T b T T T kT E b I T I (6) Where M 2kTM /E,M 2kTM /E ve ZM 1(b1)MAraştırma Uysal Satılmış et al. / Kirklareli University Journal of Engineering and Science 3(2017) 95-106
3. RESULTS AND DISCUSSION
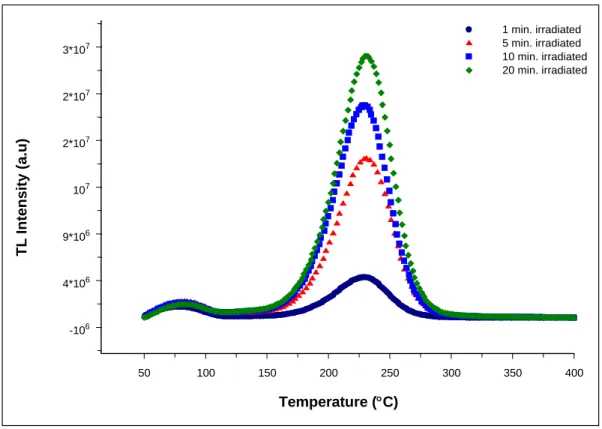
The dose response of a dosimeter should have linear or a well known function to be used in dosimetric purpose. TL glow curves of the GAG:Ce phosphors were recorded after irradiated with UV at different duration between 1 and 20 min. (Figure 1). The temperature of the main peak shifted to the low temperature side while the duration of irradiation was increased. This result indicates that the glow peaks of phosphor should not have first-order kinetics.
Figure 1. TL glow curves of the GAG:Ce phosphor exposed to UV irradiation at different
duration.
The glow curve of the GAG:Ce phosphor is well defined so the various heating rate method was applied for kinetic characterization of the phosphor. Glow curves of UV irradiated GAG:Ce phosphors were recorded using different heating rates between 1 and 40 Ks-1 (Figure 2). If the glow curves are investigated, the peak temperatures of GAG:Ce phosphor glow peaks shifted to the high temperature with the increasing heating rates. This is an expected phenomenon. 50 100 150 200 250 300 350 400 Temperature (C) -106 4*106 9*106 107 2*107 2*107 3*107 TL I nt e nsity (a .u) 1 min. irradiated 5 min. irradiated 10 min. irradiated 20 min. irradiated
Araştırma Uysal Satılmış et al. / Kirklareli University Journal of Engineering and Science 3(2017) 95-106
The kinetic parameters are calculated by taking into consideration of the obtained peak temperatures in VHR method. However, the obtained results require some corrections due to the occurrence of some systematic errors during thermoluminescence measurements. It has been well established that temperature lag (TLA) and thermal gradient (TG) have an important role in the kinetic parameter analysis [18-22]. The TLA and TG of all measurements are evaluated using the method recommended by Kitis and Tuyn [23, 24].
Figure 2. Glow curves of GAG:Ce irradiated with a UV. The glow curves were recorded at
different heating rates, namely 1, 2, 5, 10, 20 and 40 Ks-1 respectively.
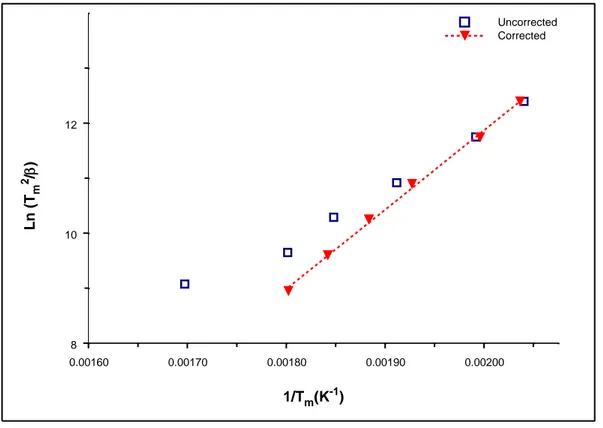
The peak temperatures of the glow curves obtained with each heating rates were used to plot the graph of ln (T2m/β) versus (1/Tm) (Figure 3). This graph should be a straight line since heating rates in the system is linear. The activation energy is determined from the slope of this line and the frequency factor is attained from the intercept of this line. Data () and data ()
100 200 300 400 Temperature (°C) 0.0 5.0*106 1.0*107 1.5*107 TL In te ns ity (a .u .) 40°C/s 20 °C/s 10 °C/s 5 °C/s 2 °C/s 1 °C/s
Araştırma Uysal Satılmış et al. / Kirklareli University Journal of Engineering and Science 3(2017) 95-106
correspond to the peak temperatures as attained from experiments and to the peak temperatures corrected for the temperature lag in figure 3, respectively. According to this method E and s parameters are calculated as 1.24 eV and 3.41x10+11 s-1, respectively.
Figure 3. The plot of Ln (T2m/β) versus (1/Tm) values of the glow peaks attained at each heating
rate.
The Peak Shape method which takes into account the peak shape or geometrical properties of a well known method of TL glow curve analysis has been applied [12]. According to this method, the average activation energy (E) was found to be 1.11 eV and average frequency factor (s) 1.80x10+10 s-1 of high temperature peak (501 K) which can be taken as a dosimetric peak using equations (1-3).
0.00160 0.00170 0.00180 0.00190 0.00200 1/Tm(K-1) 8 10 12 Ln (T m 2 / ) Uncorrected Corrected
Araştırma Uysal Satılmış et al. / Kirklareli University Journal of Engineering and Science 3(2017) 95-106
Table 1. The kinetic parameters of the glow peak at about 501 K attained by PS methods.
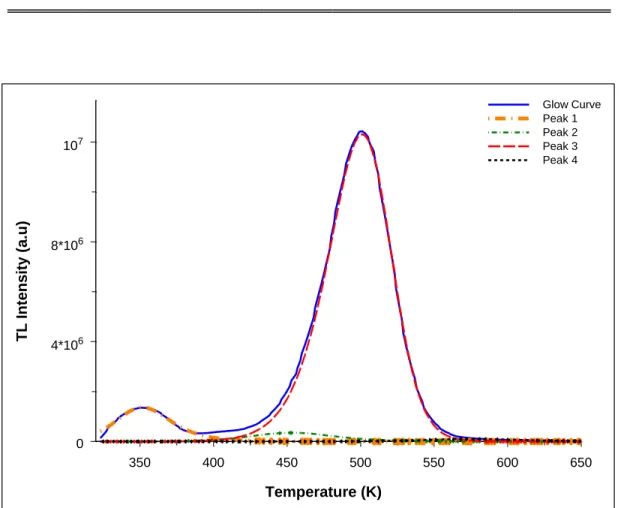
Figure 4. The computerized glow curve analysis of the GAG:Ce phosphor.
Glow curve deconvulation analysis of the phosphor GAG:Ce after exposing to UV irradiation by using the deconvulation program [16] was indicated in Figure 4. The most appropriate deconvoluted peak was taken into consideration by deciding the figure of merits (FOM). The physically calculated kinetic parameter by using FOM was in between 0.0% and
350 400 450 500 550 600 650 Temperature (K) 0 4*106 8*106 107 TL I nt e nsity (a .u) Glow Curve Peak 1 Peak 2 Peak 3 Peak 4 PS Method
Activation Energy (E) (eV) Frequency Factor (s) (s-1)
E 1.13 s 2.57x10¹⁰
E 1.09 s 9.85x10⁹
Araştırma Uysal Satılmış et al. / Kirklareli University Journal of Engineering and Science 3(2017) 95-106
2.5% [25]. The FOM value of the current deconvulation process of the GAG:Ce glow curve was found as 2.05%. As a result of the analysis, it was observed that the glow curve is composed of four peaks at about 351, 452, 501 and 575 K. Although, phosphor has composed of four peaks, only the peak 3 could be used as dosimetric purposes. The kinetic parameters for all the above peaks were also calculated and are summarized in Table 2. The activation energy and frequency factors of the main peak at 501 K were obtained as 1.14 eV and 2.63x10+10 s-1 respectively. The kinetic order of the peak was founded as the general order.
Table 2. The kinetic parameters of the glow curve of GAG:Ce phosphors were obtained in
CGCD analysis. Peak Im Tm (K) E (eV) b s (s -1 ) 1 1362844 351 0.80 2 3.51 x10 +10 2 348461 452 0.85 1.87 2.05 x10 +8 3 12312130 501 1.14 1.31 2.63x10 +10 4 98729 575 1.26 2 8.39 x10 +9 4. CONCLUSION
Investigation of thermoluminescence properties of cerium-doped gadolinium aluminate phosphor subject is an original work. The literature review shows that so far no work has been done about the thermoluminescence kinetic characterization studies of cerium doped gadolinium aluminum garnet phosphor. Keeping this in view, an attempt has been made to study about the thermoluminescence properties of this material. The kinetic parameters of Ce doped gadolinium aluminum garnet phosphor were analyzed using the various heating rates, Chen’s peak shape and computerized glow curve deconvulation methods. The obtained E, s and b parameters determined by all methods were found in good agreement with each other. The results show that the main dosimetric peak of GAG:Ce phosphor being at 501 K has a general order kinetic model. A whole knowledge of the thermoluminescence processes, determining the kinetic parameters is worth further investigation in order to design the most suitable dosimeter suitable for UVB.
Araştırma Uysal Satılmış et al. / Kirklareli University Journal of Engineering and Science 3(2017) 95-106
REFERENCES
[1] Surresh, G., Seenivasan, G., Krishnaiah, M.V., Murti, P.S., Investigation of the thermal
conductivity of selected compounds of gadolinium and lanthanum, Journal of Nuclear Materials, 249, 259-261, 1997.
[2] Cizauskaite, S., Reichlova, V., Nenartaviciene, G., Beganskiene, A., Pinkas, J., Kareiva, A.,
Sol–gel preparation and characterization of gadolinium aluminate, Materials Chemistry and Physics, 102, 105-110, 2007.
[3] Chiang, C.C., Tsai, M.S. and Hona, M.H., Preparation of Cerium-Activated GAG Phosphor
Powders Influence of Co-doping on Crystallinity and Luminescent Properties, Journal of The Electrochemical Society, 154, 10, J326-J329, 2007.
[4] Marius, M., Popovici, E.J., Barbu-Tudoran, L., Indrea, E., Mesaros, A., Cerium-doped
yttrium aluminate based phosphors prepared by wet-chemical synthesis route: Modulation of the luminescence color by changing the host-lattice composition, Ceramics International, 40, 6233– 6239, 2014.
[5] Matos, M.G., Calefi, P.S., Ciuffi, K.J., Nassar, E.J., Synthesis and luminescent properties of
gadolinium aluminates phosphors, Inorganica Chimica Acta, 375, 63–69, 2011.
[6] Dotsenko,V.P., Berezovskaya, I.V., Voloshinovskii, A.S., Zadneprovski, B.I., Efryushina,
N.P., Luminescence properties and electronic structure of Ce3+-doped gadolinium aluminum garnet, Materials Research Bulletin, 64, 151–155, 2015.
[7] Popovici, E.J., Morar, M., Bica, E., Perhaita, I., Cadis, A.I., Indrea, E., Barbu-Tudoran, L.,
Synthesis and characterization of cerium doped yttrium-gadolinium aluminate phosphors by wet-chemical synthesis route, Journal of Optoelectronics and Advanced Materials, 13, 617–624, 2011.
[8] Uysal Satilmis, S., Ege A., Ayvacikli, M., Khatab, A., Ekdal, E., Popovici, E.J., Henini, M.,
Can, N., Luminescence characterization of cerium doped yttrium gadolinium aluminate phosphors, Optical Materials, 34, 1921–1925, 2012.
[9] Diffey, B.L., Sources and measurement of ultraviolet radiation, Methods, 28, 4–13, 2002. [10] Ultraviolet Radiation Guide, Technical Manual NEHC-TM92-5, Bureau of Medicine and
Araştırma Uysal Satılmış et al. / Kirklareli University Journal of Engineering and Science 3(2017) 95-106
[11] Bindi, R., Lapraz, D., Iacconi, P., Boutayeb, S., Theoretical analysis of the simultaneous
detection method of thermally stimulated conductivity (TSC) and luminescence (TSL); application to an alpha -Al2O3 monocrystal, Journal of Physics D: Applied Physics, 27, 2395-2400, 1994.
[12] Chen, R., Glow Curves and General Order Kinetics, Journal of the Electrochemical Society,
166, (9), 1254-1257, 1969.
[13] Ege (Türkler), A., Ekdal, E., Karali, T., Can, N. and Prokic, M., Effect of heating rate on
kinetic parameters of β-irradiated Li2B4O7: Cu, Ag, P in TSL measurements, Measurement Science and Technology, 18, 889-892, 2007.
[14] Rasheedy, M.S., Method of Hoogenstraaten as a tool for obtaining the trap parameters of
general-order thermoluminescence glow peaks, Radiation Effects & Defects in Solids, 160, 383– 390, 2005.
[15] Kitis, G. and Tuyn, J.W.N., Correction for temperature lag and thermal gradient effects
arising during thermoluminescence readout, Radiation Protection Dosimetry, 84, 371–374, 1999.
[16] Türkler L., Investigation of Kinetic Parameters of Different Termoluminescent Materials,
MSc. Thesis, Manisa Celal Bayar University, Graduate School of Natural and Applied Sciences, 2010.
[17] Kitis, G., Gomez-Ros J. M. and Tuyn J. W. N., Thermoluminescence glow-curve
deconvolution functions for first, second and general orders of kinetics, Journal of Physics D: Applied Physics, 31, 2636–2641, 1998.
[18] Gotlib, V.I., Kantorovich, L.N., Grebenshicov, V.L., Bichev, V.R. and Nemiro, E.A., The
study of thermoluminescence using the contact method of sample heating, Journal of Physics D: Applied Physics, 17, 2097–2114, 1984.
[19] Betts, D.S., Couturier, L., Khayrat, A.H., Luff, B.J. and Townsend, P.D., Temperature
distribution in thermoluminescence experiments I: experimental results, Journal of Physics D: Applied Physics, 26, 843-848, 1993.
[20] Betts, D.S. and Townsend, P.D., Temperature Distribution in Thermoluminescence
Experiments II: Some Calculational Models, Journal of Physics D: Applied Physics, 26, 849– 857, 1993.
Araştırma Uysal Satılmış et al. / Kirklareli University Journal of Engineering and Science 3(2017) 95-106
Thermoluminescence Experiments, Journal of Physics D: Applied Physics, 27, 1747–1756, 1994.
[22] Ege, A., Wang, Y., Townsend, P.D., Systematic errors in thermoluminescence, Nuclear
Instruments and Methods in Physics Research A, 576, 411–416, 2007.
[23] Kitis, G. and Tuyn, J.W.N., Correctıon for temperature lag and thermal gradient effects
arising during thermoluminescence readout, Radiation Protection Dosimetry, 84 371–374, 1999.
[24] Kitis, G. and Tuyn, J.W.N., A simple method to correct for the temperature lag in TL
glow-curve measurements, Journal of Physics D: Applied Physics, 31, 2065–2073, 1998.
[25] Tamrakar, R.K., Kanchan U. and Manjulata S., Model to explain the concentration
quenching on thermoluminescence behaviour of Eu3+ doped Gd2O3 phosphor under UV