TOBB UNIVERSITY OF ECONOMICS AND TECHNOLOGY GRADUATE SCHOOL OF ENGINEERING AND SCIENCE
CLASSIFICATION OF ELECTRONIC DEVICES USING HARMONIC RADAR BASED ON A LINEAR MODEL WITH POWER-SWEPT SIGNALS
MASTER OF SCIENCE THESIS Maryam Shahi
Department of Electrical and Electronics Engineering
Thesis Supervisor: Dr. Harun Taha HAYVACI
Graduate School of Engineering and Science Approval
... Prof.Dr. Osman EROGUL
Head
I confirm that this thesis meets the requirements of a Master of Science degree thesis.
... Assoc.Prof.Dr. Tolga GIRICI
Head of Department
Master of Science student of TOBB University of Economics and Technology Maryam Shahi with student number 161211082 paid close attention to the information in this thesis to be presented in an ethical manner based on academic policies and regulations. This thesis with ”CLASSIFICATION OF ELECTRONIC DEVICES USING HARMONIC RADAR BASED ON A LINEAR MODEL WITH POWER-SWEPT SIGNALS” title was approved on 22 July 2019 by following jury members.
Thesis Supervisor: Dr. Harun Taha HAYVACI ... TOBB University of Economics and Technology
Jury Members: Prof. Dr. Asim Egemen YILMAZ ... Ankara University
Assoc.Prof.Dr. Imam Samil YETIK ... TOBB University of Economics and Technology
Dr. Harun Taha HAYVACI ... TOBB University of Economics and Technology
THESIS DECLARATION
I declare that this thesis was composed by myself and has not been submitted for any other degree or academic qualification. The information in this thesis is presented in an ethical manner based on academic policies and regulations. I took reasonable care to ensure my thesis does not breach copyright law and has not been taken from other sources except where such work has been cited and acknowledged within the text. I completed this thesis regarding all of the requirements and regulations characterized by Graduate School of Engineering and Science at TOBB University of Economics and Technology.
Maryam Shahi
ABSTRACT Master of Science Thesis
CLASSIFICATION OF ELECTRONIC DEVICES USING HARMONIC RADAR BASED ON A LINEAR MODEL WITH POWER-SWEPT SIGNALS
Maryam Shahi
TOBB University of Economics and Technology Graduate School of Engineering and Science Department of Electrical and Electronics Engineering
Thesis Supervisor: Dr. Harun Taha HAYVACI Date: July 2019
Nonlinear circuit components such as diodes, transistors, etc. receive a transmitted signal at a fundamental frequency and re-radiate the harmonics and possibly intermodulation products of that frequency. Many studies have been done to utilize nonlinearities of electronic circuits to detect, range, and track targets of interest in the presence of clutter using harmonic radar, yet only a few number of researches focus on classification of various electronic circuits.
A new technique to use nonlinear characteristics of electronic devices for classification of those devices using Harmonic Radar is proposed in this thesis. Unlike prior work in the literature, the powers of the transmitted incident waves are swept within a determined range in this study to capture the nonlinearities of the Electronic Circuits Under Test (ECUT). National Instruments (NI) AWR Design Environment is used to design the ECUT of this study. The first three harmonics of the received powers are analyzed in harmonic space. This novel method, derives the harmonic responses of the ECUT using Power Series Model. As a major contribution of this research, a linear model is proposed to relate the measurements to the unknown deterministic vectors of parameters characterizing the nonlinearities of the ECUT.
Each electronic circuit under test has a distinguishable harmonic response to a single-tone or two-tone incident wave with varying power. Therefore, a unique vector
of parameters can be derived from the presented linear model for each circuit. A Maximum Likelihood Estimator (MLE) is used in this novel approach to estimate the unique vectors of parameters in the presence of Complex White Gaussian Noise (CWGN) based on the newly developed linear model. K-Nearest Neighbors (kNN) classification method is employed to classify different nonlinear electronic devices such as diode clamper, diode limiter, and full-wave rectifier using the statistical features of the normalized estimated vectors of parameters as distinguishing factors. Simulation results prove the presented method of power-swept incident waves and estimated vectors of parameters to be an effective approach for classification of nonlinear devices using harmonic radar. The performance of the obtained classifier is evaluated using confusion matrices and scattered feature plots of the normalized estimated vectors of parameters. It is shown that the presented classifier in this study has a better performance compared to existing classifiers.
Keywords: Harmonic radar, Power series model, Maximum likelihood estimator, Linear model, K-nearest neighbors, Classification, Vectors of parameters
ACKNOWLEDGMENTS
Foremost, I would like to thank my supervisor, Dr. Harun Taha HAYVACI, for his knowledgeable guidance and unfailing support while I was writing this thesis. I would also like to thank Prof.Dr.Imam Samil YETIK for his insightful comments and contributions. I must also express my gratitude to TOBB University of Economics and Technology for providing me with a full scholarship throughout my M.Sc. studies. Last but not least, I am grateful to my fiancé, my family and my friends for their spiritual support and encouragement.
CONTENTS
Page
ABSTRACT . . . iii
ACKNOWLEDGMENTS . . . v
CONTENTS . . . vi
LIST OF FIGURES . . . vii
LIST OF TABLES . . . viii
LIST OF ABBREVIATIONS . . . ix
1. INTRODUCTION . . . 1
1.1 Review of Literature . . . 1
1.2 Purpose of Thesis . . . 5
1.3 Organization . . . 5
2. HARMONIC RE-RADIATION OF A NONLINEAR DEVICE . . . 7
2.1 Power Series Model . . . 7
2.1.1 Single-Tone Re-Radiation . . . 8
2.1.2 Two-Tone Re-Radiation . . . 9
2.2 Design and Simulation . . . 12
3. LINEAR MODEL . . . 15
3.1 Model Description . . . 15
3.2 Observation Matrices and Vectors of Unknown Parameters . . . 16
3.2.1 Single-Tone Re-Radiation . . . 16
3.2.2 Two-Tone Re-Radiation . . . 17
3.3 Maximum Likelihood Estimation . . . 17
3.4 K-Nearest Neighbors Classification . . . 19
4. PERFORMANCE EVALUATION AND SIMULATION RESULTS . . 21
4.1 Single-Tone Re-Radiation Results . . . 22
4.2 Two-Tone Re-Radiation Results . . . 23
5. CONCLUSIONS AND FUTURE WORK . . . 29
BIBLIOGRAPHY . . . 31
VITAE . . . 35
LIST OF FIGURES
Figure 2.1: Schematic of Device Type 1, Diode Clamper Circuit, Designed Using National Instruments (NI) AWR Design Environment. . . . 12 Figure 2.2: Schematic of Device Type 2, Diode Limiter Circuit, Designed Using
National Instruments (NI) AWR Design Environment. . . 13 Figure 2.3: Schematic of Device Type 3, Full-Wave Rectifier Circuit, Designed
Using National Instruments (NI) AWR Design Environment. . . . 13 Figure 3.1: MSE Functions of the MLE for Device Type 1, Diode Clamper
Circuits, First Three Harmonics of The Fundamental Frequency, Single-Tone Re-radiation. . . 19 Figure 4.1: Scattered Feature Plots of The Normalized Estimated Vectors of
Parameters at SNR = 5 dB, First Three Harmonics of ω0frequency,
Single-Tone Re-Radiation Case, (a) Mean, (b) Variance. . . 22 Figure 4.2: Scattered Feature Plots of The Normalized Estimated Vectors of
Parameters at SNR = 5 dB, First Three Harmonics of ω1frequency,
Two-Tone Re-Radiation Case, (a) Mean, (b) Variance. . . 23 Figure 4.3: Scattered Feature Plots of The Normalized Estimated Vectors of
Parameters at SNR = 5 dB, First Three Harmonics of ω2frequency,
Two-Tone Re-Radiation Case, (a) Mean, (b) Variance. . . 24 Figure 4.4: Scattered Feature Plots of The Normalized Estimated Vectors
of Parameters at SNR = 5 dB, First Three Intermodulation Frequencies, Two-Tone Re-Radiation Case, (a) Mean, (b) Variance. 25 Figure 4.5: Scattered Feature Plots of The Normalized Estimated Vectors
of Parameters at SNR = 5 dB, Second Three Intermodulation Frequencies, Two-Tone Re-Radiation Case, (a) Mean, (b) Variance. 26
LIST OF TABLES
Table 3.1: Euclidean Distances for Single-Tone Re-Radiation Case . . . 20 Table 4.1: Confusion Matrices at First Three Harmonics of ω0 Frequency for
Single-Tone Re-Radiation Case . . . 22 Table 4.2: Confusion Matrices at First Three Harmonics of ω1 Frequency for
Two-Tone Re-Radiation Case . . . 23 Table 4.3: Confusion Matrices at First Three Harmonics of ω2 Frequency for
Two-Tone Re-Radiation Case . . . 24 Table 4.4: Confusion Matrices at First Three Intermodulation Frequencies for
Two-Tone Re-Radiation Case . . . 25 Table 4.5: Confusion Matrices at Second Three Intermodulation Frequencies for
Two-Tone Re-Radiation Case . . . 26 Table 4.6: Classification Results in [38] for Five Electronic Devices . . . 27
ABBREVIATIONS
ECUT : Electronic Circuits Under Test MLE : Maximum Likelihood Estimator CWGN : Complex White Gaussian Noise KNN : K-Nearest Neighbors
RF : Radio Frequency
FM : Frequency Modulation BPSK : Binary Phase-Shift Keying MSE : Mean Square Error
SNR : Signal-to-Noise Ratio
XFMRTAP : Ideal Transformer with Center Tap SWPVAR : Swept Variable Control
PDF : Probability Density Function
LS : Least Squares
1. INTRODUCTION
1.1 Review of Literature
Linear systems satisfy the principle of superposition (homogeneity and additivity properties) [1]. A system that does not meet the principle of superposition, is called a Nonlinear System. A circuit component that shows nonlinearities is considered a nonlinear system by definition.
A harmonic radar system works by transmitting a signal to a nonlinear target of interest which receives the signal at a fundamental frequency and generates harmonics and possibly intermodulation products of that frequency [2]. The harmonics are then re-radiated back to the receiver. A harmonic radar is able to distinguish between nonlinear "targets" and "clutter" (other objects that generate false alarms if driven by an incident wave) [3]. Therefore, nonlinearities of the electronic circuits can be utilized as important distinguishing features since natural clutter only re-radiate the fundamental frequencies of the transmitted wave.
Many open-air experimental setups have proved that RF devices generate harmonics of the fundamental frequencies and multitone products of those frequencies [4]. Certain circuit components such as diodes, semiconductors, transistors, etc. can be discriminated by studying the re-radiation of those components at harmonic frequencies of the incident waves. Some of the RF circuit elements such as amplifiers show unwanted nonlinear properties that can distort the received signals form the target [5–7]. Many researches have been done to linearize the amplifiers in the transmitter to eliminate the unintended distortions [8–10]. The natural clutter do not show nonlinearities if driven by a harmonic radar [11]. Therefore, nonlinear characteristics of circuit components can be utilized to detect, track and classify
nonlinear circuits using harmonic radar. It has been shown that nonlinear circuits re-radiate the harmonics of the fundamental frequencies very poorly [12]. Thus, the preliminary shortcoming of the harmonic radar is the low received power at harmonics of the fundamental frequencies which in turn requires high transmitted power. Main purpose of this thesis is to analyze the re-radiated waves from various nonlinear circuits to derive the unique vectors of parameters based on a newly developed linear model to be used for classification of those circuits.
Detection of nonlinear targets of interest using harmonic radar technology has been issued in previous research numerously. For instance, a harmonic radar detects a non-linear moving target using Range-Doppler plots in [13]. A new approach is revealed by considering two unique sets of FM noise signals using harmonic radar to detect the multitone response of the device under test [14]. A novel detection method uses a binary phase-shift keying (BPSK) modulated signal to reduce the required transmitted power in a harmonic radar system [15] . Furthermore, many researches have been done to detect hidden electronic devices and man-made targets for military purposes [16–19].
The vast applications of harmonic radar technology are not limited to the detection of nonlinear targets. As an example, a multi-frequency radar detects and characterizes human activities using Doppler measurements in [20]. Vital signs have been successfully detected using a harmonic radar system in which the detection performance is improved by adding a phase shift between transmitted waves at two distinct frequencies [21]. A harmonic radar monitors the vital signs by analyzing first and second order harmonics of the incident wave to create frequency diversity [22]. One of the interesting applications of nonlinear radar technology is to observe bees’ behavior using a transponder. Fast disappearance of worker bees can cause shortage of food all over the world. As a result, observing bees’ behavior patterns has garnered significant attention to itself during the past decade [23–25]. Harmonic re-radiation of circuit components makes it possible to use harmonic radar for tracking tagged insects as well [26, 27]. Pest management has been a very crucial issue recently. Therefore, studying insect dispersal in the field using harmonic radar can offer effective solutions
to the issue.
The harmonic re-radiation of nonlinear targets is considered in [28]. As a popular technique in harmonic radar, single-frequency signals are transmitted to the targets in many researches [29]. Then, the harmonics of the transmitted frequencies are analyzed in the receiver to detect, track and distinguish the targets [30]. Two-tone incident waves are also transmitted to the targets to analyze the nonlinear characteristics of the targets in previous work [2, 31, 32]. Both single-tone and two-tone incident waves are utilized in this thesis to derive the unique signature of each electronic circuit to be used in classification of three different circuit types. First three harmonics of the re-radiated waves are analyzed in harmonic space. The re-radiated wave from a nonlinear circuit to a two-tone incident wave contains not only the harmonics of the fundamental frequencies but also the intermodulation products of those frequencies. As summarized above, detecting, ranging and tracking of various targets and electronic devices have been included in the prior research [29, 33–37], yet only a few number of studies focus on classification of various electronic circuits using harmonic radar. A classifier is required to distinguish between the targets based on particular features. Harmonic re-radiations of nonlinear circuits can be utilized as a distinguishing feature vector in classification [38]. The harmonic responses of various nonlinear circuits to an incident wave with varying power are analyzed in [39]. The statistical features of harmonic re-radiations are used to distinguish between nonlinear devices. In another study, the Fourier analysis of the harmonic responses are employed to distinguish those nonlinear devices using a harmonic radar [40]. However, the novel approach in this thesis classifies various nonlinear electronic circuits such as diode clamper, diode limiter and full-wave rectifier based on a newly developed linear model and estimation of unknown deterministic vectors of parameters. Derivation of unique vectors of parameters from this linear model makes an important progress in classification of nonlinear circuits of interest using harmonic radar.
National Instruments (NI) AWR Design Environment is used to design the ECUT of this study. First, single-tone and two-tone sinusoidal incident waves with varying power from 0 to 40 dBm with 1 dB intervals at 1 GHz frequency are used as the inputs
to all circuits under test. Unlike the previous research, sweeping the transmitted power in a determined range captures the nonlinear characteristics of the devices. Later, the first three harmonics of the output powers are analyzed in harmonic space. As a major contribution of this study, the re-radiated waves from the electronic circuits are calculated using power series model. The harmonic responses of the nonlinear circuits to power-swept single-tone and two-tone incident waves are derived for the first three harmonics of the fundamental frequencies and intermodulation products of those frequencies.
As a first in this area, a linear model is constructed in this study to relate the AWR measurements to the vectors of unknown parameters characterizing the nonlinearities of the ECUT. The observation matrices and unknown deterministic vectors of parameters are derived for both single-tone and two-tone re-radiation cases based on the newly developed linear model. Then, the vectors of parameters are estimated with a Maximum Likelihood Estimator (MLE) in the presence of Complex White Gaussian Noise (CWGN) for different SNR values using Monte Carlo simulations. The performance of the estimator is evaluated by analyzing the Mean Square Error (MSE) functions for one of the three main circuit types under test, diode clamper circuits. The normalized estimated vectors allow us to have the unique signature of each electronic device that makes it distinguishable from other devices.
As a novel technique, the statistical features of the normalized estimated vectors of unknown parameters are used as test and training data in classification of the ECUT using a kNN classifier. We categorize the data points in three main classes in kNN classification algorithm. First, kNN classifier calculates the Euclidean distances between test and training data sets. Then, it finds the k nearest neighbors and classifies the new devices into three device classes based on smallest Euclidean distances [41]. The proposed linear model in this thesis provides us with valuable information for classification of nonlinear devices since the statistical features of the normalized estimated vectors of parameters differ significantly for different nonlinear electronic devices. Visual and numeric evaluation of the novel method of this study at first, second and third order harmonics of the estimated vectors proves the latter statement.
1.2 Purpose of Thesis
Main purpose of this thesis is to classify various nonlinear devices such as diode clamper, diode limiter, and full wave rectifier by analyzing the re-radiated signals from those devices based on a newly proposed linear model. Nonlinearities of the ECUT are utilized as distinguishing factors in classification. The novel method of this study derives the first three harmonics of the re-radiated waves from the ECUT based on power series model for single-tone and two-tone re-radiation cases. Then, a linear model relates the measurements to the re-radiated waves from the ECUT by deriving the observation matrices and vectors of unknown parameters. Later, a Maximum likelihood estimator is employed to estimate these vectors in the presence of CWGN using Monte Carlo simulations. The statistical features of the normalized estimated vectors of unknown parameters are unique for each electronic device under test. Therefore, our ultimate goal is to use these vectors to distinguish and classify various nonlinear devices using kNN classification approach.
1.3 Organization
The further organization of this thesis is as follows. Harmonic re-radiation of a nonlinear device is discussed in Chapter 2. Power Series Model is given in Chapter 2.1 to calculate the input-output relationship of an electronic circuit. The re-radiated signals from a nonlinear device to single-tone and two-tone incident waves are predicted using Power Series Model in Chapter 2.1.1 and 2.1.2, respectively. The power series coefficients are also derived in Chapter 2.1.1 and 2.1.2 for first three harmonics and intermodulation products of fundamental frequencies for both single-tone and two-tone re-radiation cases. Experimental design and simulation of the ECUT are done using National Instruments (NI) AWR Design Environment in Chapter 2.2.
A linear model is proposed in Chapter 3 to relate the AWR measurements to the unknown deterministic vectors of parameters characterizing the nonlinearities of
the ECUT. Chapter 3.1 gives the model description of the proposed method. The re-radiated waves from nonlinear devices under test are also re-written in Chapter 3.1 based on the newly constructed linear model in order to derive the vectors of parameters. The observation matrices and unknown deterministic vectors of parameters are derived in Chapter 3.2.1 and 3.2.2 for single-tone and two-tone re-radiation cases, respectively. Maximum likelihood estimation of the vectors of unknown parameters is included in Chapter 3.3. The performance of the estimator is also evaluated in Chapter 3.3 by plotting the Mean Square Error (MSE) functions with respect to SNR values for diode clamper circuits under test. The k-NN classification method is used in Chapter 3.4 for classification of the ECUT using normalized estimated vectors of parameters for both single-tone and two-tone re-radiation cases. Euclidean distances are also given in Chapter 3.4 for single-tone re-radiation case to validate the proposed technique.
Performance evaluation and simulations results are discussed in Chapter 4. Single-tone and two-tone re-radiation results are analyzed using confusion matrices and scattered feature plots of the normalized estimated vectors of parameters in Chapter 4.1 and 4.2, receptively. Finally, Chapter 5 gives the conclusion of the research and future work.
2. HARMONIC RE-RADIATION OF A NONLINEAR DEVICE
The main goal of this study is to classify various electronic circuits using nonlinear characteristics of those circuits. To achieve that goal, a system model is needed that can predict the response of the nonlinear circuits under test to any input signal. The re-radiated signals from nonlinear devices cannot be described by a linear system model. Therefore, a nonlinear system model is utilized to formulate the re-radiation of a nonlinear device.
2.1 Power Series Model
The input-output relationship of a nonlinear electronic circuit do not satisfy the linearity property since nonlinear devices receive the transmitted signal at a fundamental frequency and re-radiate a new signal at harmonics and possibly intermodulation products of that frequency. The harmonic response of a nonlinear device to any incident wave can be predicted by Power Series Model [38], [42–46],
s[ n0] = ∞
∑
n=1 sn= ∞∑
n=1 anxn (2.1)where s is the re-radiated signal from the device, n denotes the number of the harmonics of the fundamental frequencies, n0denotes the number of the received samples, x is the incident wave and an’s are the complex power series coefficients. According to this
model, the re-radiated signal is equal to the sum of the incident wave raised to the nth power scaled by the power series coefficients. First three harmonics of the re-radiated waves from a nonlinear device are derived in two subsections for single-tone and two-tone re-radiation cases.
2.1.1 Single-Tone Re-Radiation
In case of a sinusoidal incident wave that contains only a single frequency, we have
x1= x0sin(ω0n0+ φ0), n0= 1, 2, ..., N0 (2.2)
where x1 is the incident wave, x0and φ0 are the magnitude and phase of the incident
wave. We can derive the re-radiated wave from a nonlinear device for the first, second, and third order harmonics using Eq. (2.1) as
s1[ n0] =(a1x0+ 3 4a3x 3 0) sin(ω0n0+ φ1) − 1 2a2x 2 0cos(2ω0n0+ φ2) −1 4a3x 3 0sin(3ω0n0+ φ3) (2.3)
The re-radiated signal, s1, can be rewritten by moving the phase information into the
amplitudes as
s1[ n0] = b1sin(ω0n0) + b2sin(2ω0n0) + b3sin(3ω0n0)
+ b4cos(ω0n0) + b5cos(2ω0n0) + b6cos(3ω0n0)
(2.4)
where b coefficients are derived as
b1= (a1x0+ 3 4a3x 3 0) cos(φ1) b2= 1 2a2x 2 0sin(φ2) b3= −1 4a3x 3 0cos(φ3) b4= (a1x0+3 4a3x 3 0) sin(φ1) b5= −1 2a2x 2 0cos(φ2) b6= −1 4a3x 3 0sin(φ3) (2.5)
As shown in Eq. (2.4), a nonlinear device re-radiates a signal at first, second and third harmonics of the fundamnetal frequency, ω0, if driven by a single-tone incident wave.
The phase of each harmonic is a random variable taking a value in [−π, π] interval.
2.1.2 Two-Tone Re-Radiation
In case of a sinusoidal incident wave that contains two distinct frequencies, we have
x2= x21sin(ω1n0+ φ21) + x22sin(ω2n0+ φ22),
n0= 1, 2, ..., N0
(2.6)
where x2 is the incident wave, x21 and x22 are the magnitudes of the wave, φ21 and
φ22 are the initial phases and n is the nth harmonic of the fundamental frequencies,
ω1 and ω2. The re-radiated wave from a nonlinear device to a two-tone incident wave
contains not only the harmonics of the fundamental frequencies, ω1 and ω2, but also
intermodulation products of those frequencies. Using Eq. (2.1) we can calculate the re-radiated wave for the first three harmonics as
s2[ n0] = 3
∑
n=1anxn2= a1x2+ a2x22+ a3x32 (2.7)
First, second and third terms of Eq. (2.7) are calculated as
a1x2= a1x21sin(ω1n0+ φ1) + a1x22sin(ω2n0+ φ2) (2.8) a2x22= a2[ x21sin(ω1n0+ φ21) + x22sin(ω2n0+ φ22)]2 = a2 2x 2 21+ a2 2x 2 22− a2 2x 2 21cos(2ω1n0+ φ3) −a2 2x 2 22cos(2ω2n0+ φ4) −a2x21x22cos((ω1+ ω2)n0+ φ5) +a2x21x22cos((ω1− ω2)n0+ φ6) (2.9) a3x32= a3[ x21sin(ω1n0+ φ21) + x22sin(ω2n0+ φ22)]3 = −a3 4x 3 21sin(3ω1n0+ φ7) − a3 4x 3 22sin(3ω2n0+ φ8) +(3a3 4 x 3 21+ 3a3 2 x 2 22x21) sin(ω1n0+ φ1) +(3a3 4 x 3 22+ 3a3 2 x 2 21x22) sin(ω2n0+ φ2) −3a3 4 x 2 21x22α − 3a3 4 x 2 22x21β (2.10) 9
where α and β are
α = sin((ω2− 2ω1)n0+ φ9) + sin((2ω1+ ω2)n0+ φ10)
β = sin((ω1− 2ω2)n0+ φ11) + sin((2ω2+ ω1)n0+ φ12)
(2.11)
The re-radiated signal, s2, can be rewritten by moving the phase information into the
amplitudes as
s2[ n0] = c1sin(ω1n0) + c2sin(2ω1n0) + c3sin(3ω1n0)
+ c4cos(ω1n0) + c5cos(2ω1n0) + c6cos(3ω1n0)
+ c7sin(ω2n0) + c8sin(2ω2n0) + c9sin(3ω2n0)
+ c10cos(ω2n0) + c11cos(2ω2n0) + c12cos(3ω2n0)
+ c13cos((ω1+ ω2)n0) + c14sin((ω1+ ω2)n0) + c15cos((ω1− ω2)n0) + c16sin((ω1− ω2)n0) + c17cos((ω2− 2ω1)n0) + c18sin((ω2− 2ω1)n0) + c19cos((2ω1+ ω2)n0) + c20sin((2ω1+ ω2)n0) + c21cos((ω1− 2ω2)n0) + c22sin((ω1− 2ω2)n0) + c23cos((2ω2+ ω1)n0) + c24sin((2ω2+ ω1)n0) (2.12)
where the c coefficients of the first three harmonics of the fundamental frequencies are derived as c1= (a1x1+ 3a3 4 x 3 1+ 3a3 2 x 2 2x1) cos(φ1) c2= a2 2 x 2 1sin(φ3), c3= − a3 4x 3 1cos(φ7) c4= (a1x1+3a3 4 x 3 1+ 3a3 2 x 2 2x1) sin(φ1) c5= −a2 2 x 2 1cos(φ3), c6= − a3 4x 3 1sin(φ7) c7= (a1x2+ 3a3 4 x 3 2+ 3a3 2 x 2 1x2) cos(φ2) c8= a2 2 x 2 2sin(φ4), c9= − a3 4x 3 2cos(φ8) c10 = (a1x2+3a3 4 x 3 2+ 3a3 2 x 2 1x2) sin(φ2) c11 = −a2 2x 2 2cos(φ4), c12 = − a3 4 x 3 2sin(φ8) (2.13) 10
The c coefficients are derived for the first three intermodulation products of the fundamental frequencies as c13= −a2x1x2cos(φ5) c14= a2x1x2sin(φ5) c15= a2x1x2cos(φ6) c16= −a2x1x2sin(φ6) c17= − 3a3 4 x 2 1x2sin(φ9) c18= − 3a3 4 x 2 1x2cos(φ9) (2.14)
The c coefficients of the next three intermodulation products are
c19= −3a3 4 x 2 1x2sin(φ10) c20= −3a3 4 x 2 1x2cos(φ10) c21= −3a3 4 x 2 2x1sin(φ11) c22= − 3a3 4 x 2 2x1cos(φ11) c23= − 3a3 4 x 2 2x1sin(φ12) c24= − 3a3 4 x 2 2x1cos(φ12) (2.15)
As shown in Eq. (2.12), the re-radiated signal from a nonlinear circuit to the two-tone incident wave from Eq. (2.6) contains ω1, ω2, 2ω1, 2ω2, 3ω1 and 3ω2 frequencies
and mixing products of those frequencies, ω1+ ω2, ω1− ω2, ω2− 2ω1, 2ω1+ ω2,
ω1− 2ω2, and 2ω2+ ω1. The phases of harmonics and intermodulation products are
random variables taking a value in [−π, π] interval.
The experimental design and simulation of various electronic devices using NI AWR Design Environment are given in the next section. The output powers of the circuits under test are gathered form AWR at first three harmonics and utilized to calculate b coefficients in Eq. (2.5) and c coefficients in Eq. (2.13), Eq. (2.14), and Eq. (2.15).
2.2 Design and Simulation
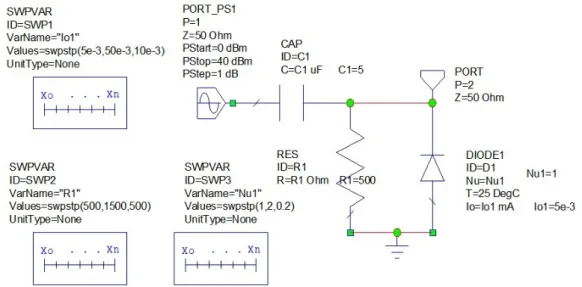
Three main circuit types, namely diode clamper, diode limiter and full wave rectifier, have been designed using National Instruments (NI) AWR Design Environment to gather a data set of different realizations for both single-tone and two-tone re-radiation cases. Fig. 2.1 shows the diode clamper circuit under test. A simple diode clamper circuit consists of a capacitor, a diode, and a resistor that shifts the signal to a desired DC level.
Figure 2.1: Schematic of Device Type 1, Diode Clamper Circuit, Designed Using National Instruments (NI) AWR Design Environment.
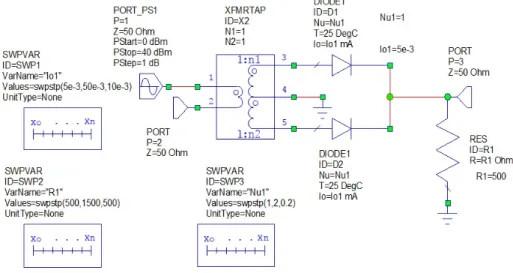
The second type of the circuits under test, diode limiter, is shown in Fig. 2.2. A basic diode limiter circuit is generally used to limit the input voltage. A full-wave rectifier Circuit is also designed using AWR design environment, as shown in Fig. 2.3, to collect a large data set. An Ideal Transformer with Center Tap (XFMRTAP) is used in the circuit. The Swept Variable Control (SWPVAR) is used to sweep certain parameters with 90 different values for each circuit type which gives 270 electronic circuits under test in total. As a novel method, the transmitted power is swept from 0 to 40 dBm with 1 dB intervals at 1 GHz frequency for each circuit to capture the nonlinear I-V characteristics of the nonlinear junctions within the circuits under test. Then, the received powers are analyzed in harmonic space for the first, second and
Figure 2.2: Schematic of Device Type 2, Diode Limiter Circuit, Designed Using National Instruments (NI) AWR Design Environment.
third order harmonics.
Realistic electronic circuits are simulated using AWR Design Environment to create a real life scenario in this study. The harmonic power levels at the first, second and third harmonics are simulated using AWR Microwave Office Harmonic Balance simulator. Then, the received powers of the electronic circuits under test are analyzed to enable the performance assessment of the proposed technique. The novel approach in this
Figure 2.3: Schematic of Device Type 3, Full-Wave Rectifier Circuit, Designed Using National Instruments (NI) AWR Design Environment.
thesis can be applied for any other type or number of nonlinear electronic circuits outside this research as well.
The proposed linear model in the next chapter relates the measurements to the vectors of unknown parameters. Next, the statistical features of the normalized estimated vectors of parameters are used as test and training data in classification of ECUT for both single-tone and two-tone re-radiation cases.
3. LINEAR MODEL
3.1 Model Description
A linear model is developed in this section to relate the AWR measurements to the unknown deterministic vectors of parameters characterizing the nonlinearities of the ECUT. According to the proposed linear model, the received data vector r can be written as,
r = Hθ + w (3.1)
where
• H ∈ CN×p is a known full rank matrix whose columns span the useful signal subspace H;
• θ ∈ Cp×1 is an unknown deterministic vector of parameters accounting for the signal location in H;
• w denotes the CWGN contributions which are assumed to be independent and identically distributed (iid), complex normal random vectors with zero-mean and covariance matrix C = σ2I.
• p dimension gives the number of harmonics of fundamental frequencies and intermodulation products of those frequencies which reduces to “ 6 ” for single-tone re-radiation case and “ 24 ” for two-tone re-radiation since we only consider the first three harmonics.
The re-radiated signal to a single-tone incident wave contains no intermodulation terms. The re-radiated signals in Eq. (2.4) and Eq. (2.12) are re-written based on
the proposed linear model as
s1[ n0] = H1θ1
s2[ n0] = H2θ2
(3.2)
where the re-radiated waves, s1 and s2, are written as the product of observation
matrices, H1and H2, and vectors of unknown parameters, θ1and θ2, for single-tone
and two-tone re-radiation cases, respectively.
The transmitted powers are swept within a determined range to capture the nonlinear behaviors of electronic circuits in this study. The CWGN contributions in Eq. (3.1) are swept along with the transmitted powers. By sweeping the noise vector along with varying power, we are adding a corresponding noise value (proportional to the swept power) to the re-radiated wave vectors in Eq. (3.2).
3.2 Observation Matrices and Vectors of Unknown Parameters
Each nonlinear circuit under test has a distinct response (θ ’s) to a single-tone or two-tone time-varying incident wave with varying power. As a result, a unique unknown deterministic vector of parameters can be estimated from the proposed linear model for each ECUT which makes each device distinguishable from other nonlinear devices. The observation matrices and vectors of unknown parameters are derived in two subsections for both single-tone and two-tone re-radiation cases at first, second, and third order harmonics.
3.2.1 Single-Tone Re-Radiation
The H1N×6 matrix and θ16×1 vector (index 1 represents the single-tone re-radiation
case) are derived from Eq. (2.4) for single-tone re-radiation case at first, second and third harmonics of the fundamental frequency, ω0, as
θ1= h b1 b2 . . . b5 b6 iT (3.3) 16
H1=
sin(ω0) . . . sin(3ω0) . . . cos(3ω0)
sin(2ω0) . . . sin(6ω0) . . . cos(6ω0)
..
. ... ... ... ...
sin(N0ω0) . . . sin(3N0ω0) . . . cos(3N0ω0)
(3.4)
The θ1 vector in Eq. (3.3) contains the phase information of the re-radiated signal in
Eq. (2.4). Each nonlinear circuit under test possesses a distinct vector of parameters that makes it separable form other electronic circuits.
3.2.2 Two-Tone Re-Radiation
The H2N×24 matrix and θ224×1 vector (index 2 represents the two-tone re-radiation
case) are similarly derived from Eq. (2.12) for two-tone re-radiation case at first three harmonics of the fundamental frequencies, ω1 and ω2, and intermodulation products
of those frequencies as θ2= h c1 c2 . . . c23 c24 iT (3.5) H2=
sin(ω1) . . . cos(ω2) . . . sin(2ω2+ω1)
sin(2ω1) . . . cos(2ω2) . . . sin(4ω2+2ω1)
..
. ... ... ... ...
sin(N0ω1) . . . cos(N0ω2) . . . sin(2N0ω2+N0ω1)
(3.6)
The θ2vector in Eq. (3.5) contains the phase information of the re-radiated signals in
Eq. (2.12). Similar to single-tone re-radiation case, a unique vector of parameters can be derived for each nonlinear circuit under test that makes it distinguishable form other electronic circuits under test.
3.3 Maximum Likelihood Estimation
Maximum Likelihood Estimation is considered to be the most popular approach to obtaining practical estimators. The performance of the MLE is optimal for large
enough data sets. The goal of maximum likelihood estimation is to find the parameter values that give the distribution that maximizes the probability of observing the data [47]. The probability density function (PDF) of the received data formulated in Eq.(3.1) is p(r; θ ) = 1 πNσ2Nexp h − 1 σ2(r − Hθ ) H(r − Hθ ) i. (3.7)
The maximum likelihood estimation of θ is the value that maximizes the PDF in Eq.(3.7). In other words, MLE of θ is the value that minimizes the Least Squares (LS) error
J =(r − Hθ )H(r − Hθ ). (3.8)
We want to find the value of θ that minimizes J [47], so we can write
J = rHr − rHHθ − θHHHr + θHHHHθ (3.9) ∂J ∂ θ = −(H Hr)∗+ (HHHθ )∗ = −h HH(r − Hθ ) i∗ . (3.10)
We can find the minimizing solution by setting the complex gradient equal to zero [47], yielding the MLE
ˆ
θ = (HHH)−1HHr. (3.11)
The MLE above has been used in MATLAB simulations to estimate the unknown deterministic vectors of parameters in Eq.(3.3) and Eq.(3.5) in the presence of Complex White Gaussian Noise (CWGN) for different SNR values using Monte Carlo simulations. In this study, Monte Carlo simulation involves 1000 recalculations before it is complete.
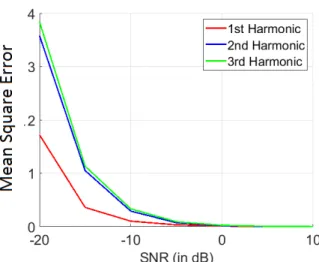
The performance of the estimator is evaluated by plotting the Mean Square Error (MSE) functions with respect to SNR values for diode clamper circuits under test. As it is shown in Fig. 3.1, MSE functions of the estimator at first, second and third order harmonics of ω0frequency are descending as the SNR value increases for single-tone
re-radiation case at 1mW transmitted power. As it appears from Fig. 3.1, MSE is almost zero when SNR value is greater than - 5 dB. The estimation of the unknown
Figure 3.1: MSE Functions of the MLE for Device Type 1, Diode Clamper Circuits, First Three Harmonics of The Fundamental Frequency, Single-Tone Re-radiation.
vectors of parameters is done at SNR = 5 dB for both single-tone and two-tone cases in this study. The MLE shows a better performance during estimation for single-tone re-radiation compared to the two-tone case.
3.4 K-Nearest Neighbors Classification
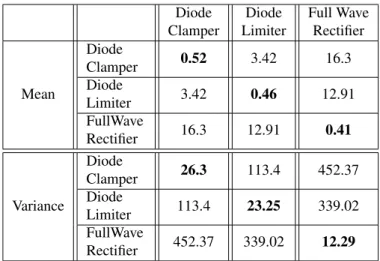
Classification of the ECUT is done in this study using a 3-Nearest Neighbor classifier that is trained to use the normalized estimated vectors of unknown parameters as test and training data sets. Training data is gathered from National Instruments (NI) AWR Design Environment by designing various nonlinear electronic circuits under test to create a more realistic scenario. In this classification, 70% of the data is allocated for training and 30% for testing. We label each row of training data set with a device class. KNN classifier finds the 3 nearest neighbors by calculating the Euclidean distances between the test and training data. The test data is assigned to one of the three types of devices under test by deriving the smallest Euclidean distances. The Euclidean distances are given in Table 3.1 for single-tone re-radiation case. As it appears from Table 3.1, the within class distances (diagonal elements) for both mean and variance of the estimated vectors are small, whereas the between class distances (non-diagonal elements) are high. This means that the estimated vectors of the circuits in the same
Table 3.1: Euclidean Distances for Single-Tone Re-Radiation Case Diode Clamper Diode Limiter Full Wave Rectifier Mean Diode Clamper 0.52 3.42 16.3 Diode Limiter 3.42 0.46 12.91 FullWave Rectifier 16.3 12.91 0.41 Variance Diode Clamper 26.3 113.4 452.37 Diode Limiter 113.4 23.25 339.02 FullWave Rectifier 452.37 339.02 12.29
class have minimum distance from each other and maximum distance from the other types of circuits in harmonic space. As a result, these unique vectors are proven to be useful for distinguishing electronic devices. The accurate simulation results prove our proposed method to be efficient for classification of ECUT especially at low SNR values in more realistic scenarios.
4. PERFORMANCE EVALUATION AND SIMULATION RESULTS
The performance assessment of the presented approach for classification of various electronic devices is presented in this chapter. Simulation results are analyzed in two subsections for single-tone and two-tone re-radiation cases. In each subsection, we present the scattered feature plots of the normalized estimated vectors of parameters. Then, we discuss the corresponding classification results by presenting the confusion matrices. The kNN classification method is used in both subsections as classification technique. As described earlier in Chapter 2, first three harmonics of the received powers are collected from AWR design environment for electronic circuits in Fig. 2.1, Fig. 2.2 and Fig. 2.3. Then, the proposed linear model in Chapter 3 relates the data to the unknown deterministic vectors of parameters. These vectors are unique for each nonlinear circuit under test which makes them distinguishing factors to be used in classification of nonlinear devices.
Maximum likelihood estimation of the vectors of parameters is done in the presence of Complex White Guassian Noise (CWGN) at different SNR values in Chapter 3.3. The estimated data is normalized using Z-Score Normalization Method. The basic z-score formula for a sample is
Z=x− ¯x
S (4.1)
where x is the sample data, ¯x denotes the sample mean, and S is the sample standard deviation. Furthermore, the estimation and classification steps are repeated through 1000 Monte Carlo trials to make sure that the method can be applied to real life scenarios. Next, the statistical features of the normalized estimated vectors of parameters are used as test and training data sets in classification of electronic circuits under test.
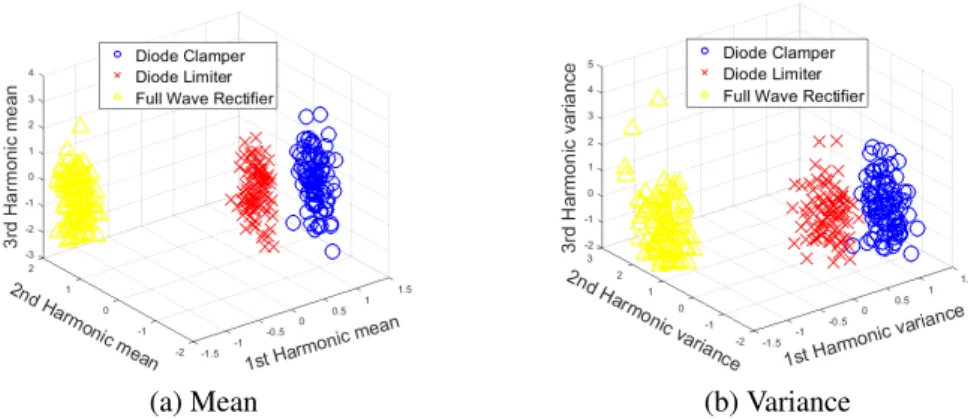
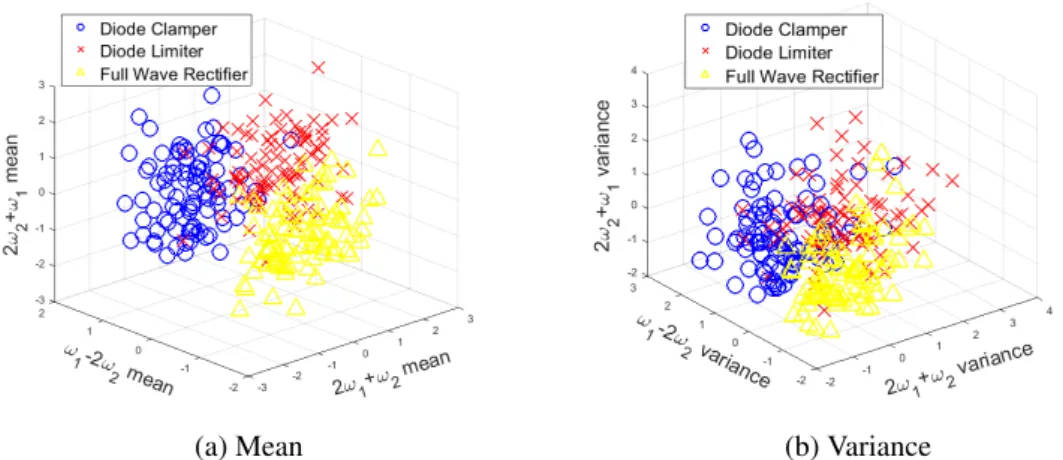
(a) Mean (b) Variance
Figure 4.1: Scattered Feature Plots of The Normalized Estimated Vectors of Parameters at SNR = 5 dB, First Three Harmonics of ω0frequency,
Single-Tone Re-Radiation Case, (a) Mean, (b) Variance.
4.1 Single-Tone Re-Radiation Results
The performance of the 3-NN classifier is evaluated for single-tone re-radiation case in this section. The 3D scattered feature plots of the normalized estimated vectors of parameters are shown in Fig. 4.1 for single-tone re-radiation case with first, second and third order harmonics defined as dimensions of harmonic space. As shown in Figure 4.1(a) and 4.1(b), the statistical features of the normalized estimated vectors are well clustered for the first three harmonics of ω0 frequency. As a result, these
features are utilized to classify nonlinear devices using Euclidean distances and kNN classification technique described in Chapter 3.4. The classification of ECUT is repeated through 1000 Monte Carlo simulations. The confusion matrices in Table 4.1 show the simulated classification results at SNR = 5 dB for single-tone re-radiation Table 4.1: Confusion Matrices at First Three Harmonics of ω0 Frequency for
Single-Tone Re-Radiation Case
Device 1 Device 2 Device 3 Mean
Device 1 99% 1% 0%
Device 2 1.2% 98.8% 0%
Device 3 0% 0% 100%
Device 1 Device 2 Device 3 Variance
Device 1 92.6% 7.4% 0%
Device 2 1.3% 98.7% 0%
Device 3 0% 0% 100%
(a) Mean (b) Variance
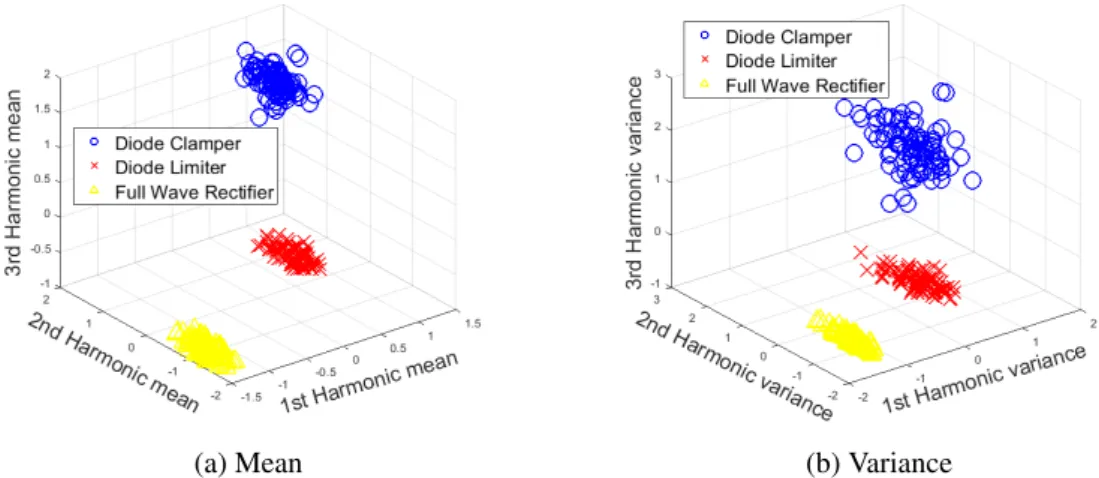
Figure 4.2: Scattered Feature Plots of The Normalized Estimated Vectors of Parameters at SNR = 5 dB, First Three Harmonics of ω1frequency,
Two-Tone Re-Radiation Case, (a) Mean, (b) Variance.
case at first three harmonics of ω0 frequency. As it is clear in Table 4.1, ECUT are
successfully classified with less than 1.3% confusion percentage between three classes when mean of the normalized estimated vectors are used as test and training data. The confusion percentage stays under 7.5% when variance of the normalized estimated data is used for classification. Device type 3, full-wave rectifier circuit, is classified with zero confusion percentage.
4.2 Two-Tone Re-Radiation Results
The performance of the 3-NN classifier is evaluated for two-tone re-radiation case in this section. The scattered feature plots of the normalized estimated vectors of Table 4.2: Confusion Matrices at First Three Harmonics of ω1 Frequency for
Two-Tone Re-Radiation Case
Device 1 Device 2 Device 3 Mean
Device 1 100% 0% 0%
Device 2 0% 100% 0%
Device 3 0% 0% 100%
Device 1 Device 2 Device 3 Variance
Device 1 100% 0% 0%
Device 2 0% 100% 0%
Device 3 0% 0% 100%
(a) Mean (b) Variance
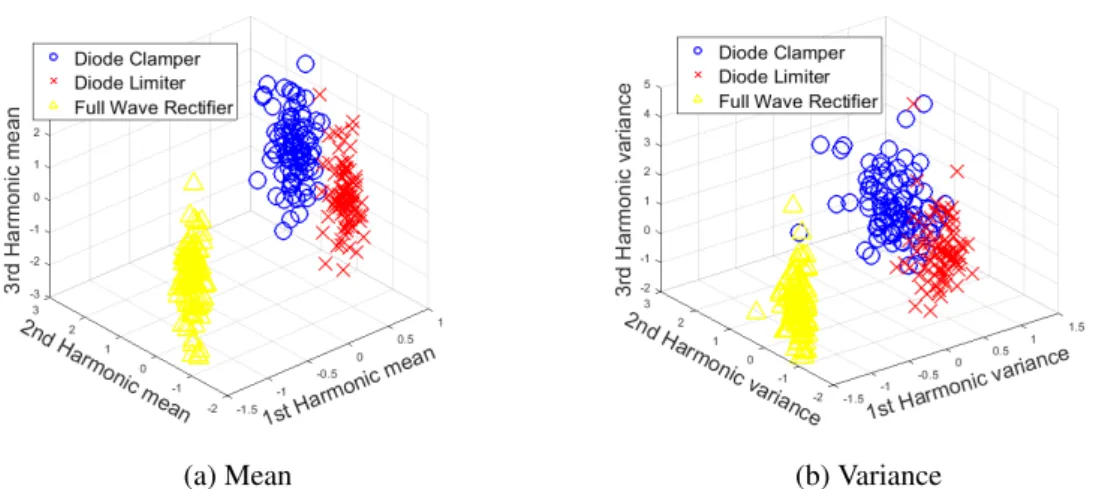
Figure 4.3: Scattered Feature Plots of The Normalized Estimated Vectors of Parameters at SNR = 5 dB, First Three Harmonics of ω2frequency,
Two-Tone Re-Radiation Case, (a) Mean, (b) Variance.
unknown parameters at first three harmonics of ω1frequency are given in Fig. 4.2. As
shown in Fig. 4.2(a) and 4.2(b), the mean and variance of the normalized estimated data are well-separated in harmonic space for the first three harmonics of ω1frequency
in two-tone re-radiation case. Corresponding confusion matrices are given in Table 4.2. As shown in Table 4.2, all three device classes are classified at first, second, and third harmonics of ω1frequency with 100% classification percentage and zero confusions.
This result is expected since estimated data is well-clustered in Fig. 4.2.
The feature plots of the first three harmonics of ω2frequency shown in Fig. 4.3(a) and
4.3(b) are fairly separated. The confusion percentages at first three harmonics of ω2
frequency are given in Table 4.3. Confusion percentage stays under 0.3% when mean of the normalized estimated data is utilized in classification and 4.3% when variance Table 4.3: Confusion Matrices at First Three Harmonics of ω2 Frequency for
Two-Tone Re-Radiation Case
Device 1 Device 2 Device 3 Mean
Device 1 99.8% 0.2% 0%
Device 2 0% 100% 0%
Device 3 0% 0% 100%
Device 1 Device 2 Device 3 Variance
Device 1 95.8% 4.2% 0%
Device 2 1.4% 98.6% 0%
Device 3 0% 0% 100%
(a) Mean (b) Variance
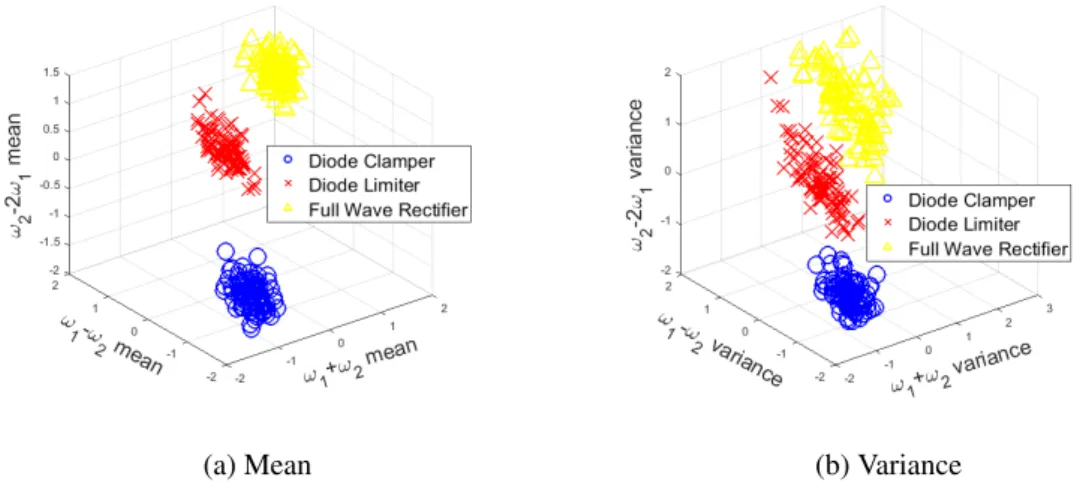
Figure 4.4: Scattered Feature Plots of The Normalized Estimated Vectors of Parameters at SNR = 5 dB, First Three Intermodulation Frequencies, Two-Tone Re-Radiation Case, (a) Mean, (b) Variance.
of the normalized estimated vectors is used as test and training data.
The scattered feature plots and confusion matrices at intermodulation products of fundamental frequencies are also presented for further evaluation of the approach. The 3D feature plots of the first three intermodulation frequencies, ω1+ ω2, ω1− ω2,
and ω2− 2ω1, defined as dimensions of harmonic space are presented in Fig. 4.4.
The corresponding confusion matrices are given in Table 4.4. As it appears in Fig. 4.4(a), the mean of the normalized estimated vectors are closely spaced for each one of the three device classes. Therefore, the devices under test are classified with zero confusion between three classes as shown in Table 4.4. Confusion percentage stays under 0.5% in Table 4.4 when variance of the estimated data is used at first three intermodulation frequencies. Feature plots of the next three intermodulation Table 4.4: Confusion Matrices at First Three Intermodulation Frequencies for
Two-Tone Re-Radiation Case
Device 1 Device 2 Device 3 Mean
Device 1 100% 0% 0%
Device 2 0% 100% 0%
Device 3 0% 0% 100%
Device 1 Device 2 Device 3 Variance
Device 1 99.9% 0.1% 0%
Device 2 0.4% 99.6% 0%
Device 3 0% 0.1% 99.9%
(a) Mean (b) Variance
Figure 4.5: Scattered Feature Plots of The Normalized Estimated Vectors of
Parameters at SNR = 5 dB, Second Three Intermodulation Frequencies, Two-Tone Re-Radiation Case, (a) Mean, (b) Variance.
frequencies, 2ω1+ ω2, ω1− 2ω2 and 2ω2+ ω1, are shown in Fig. 4.5. Unlike feature
plots at first three intermodulation frequencies, statistical features of the normalized estimated data in Fig. 4.5(a) and 4.5(b) are poorly clustered. The corresponding classification results in Table 4.5 show that the three classes are not as well-clustered as the first three harmonics and intermodulation frequencies. Despite the fact that scattered data is noisier than the data at other frequencies, confusion percentage stays under 6.9% when mean of the normalized estimated vectors is used in classification as shown in Table 4.5. The performance of the classifier drops to 66.6% for device type Table 4.5: Confusion Matrices at Second Three Intermodulation Frequencies for
Two-Tone Re-Radiation Case
.
Device 1 Device 2 Device 3 Mean
Device 1 93.2% 6.8% 0%
Device 2 4.4% 93.5% 2.1%
Device 3 0% 1% 99%
Device 1 Device 2 Device 3 Variance
Device 1 74.4% 25% 0.6%
Device 2 20.7% 66.6% 12.7%
Device 3 1% 9.7% 89.3%
2 with 12.7% and 20.7% confusion percentages. Maximum confusion percentages are 25% for device type 1 and 9.7% for device type 3. The performance of the classifier improves as the SNR value increases.
The 3-NN classifier shows its best performance when estimation and classification steps are done at first three harmonics of ω1 frequency in two-tone re-radiation case
as shown in Table 4.2 and Fig.4.2. The vectors of parameters in Eq.(3.3) and Eq.(3.5) have been converted to 3-by-1 and 12-by-1 vectors respectively by moving the phase information into H1, and H2 matrices from Eq.(3.4) and Eq.(3.6) for each nonlinear
circuit under test before plotting scattered feature plots and simulating confusion matrices.
Classification of 5 electronic devices in [38], presents promising results, which are given in Table 4.6. Received powers are collected with respect to frequency using sixteen receiver antennas. Mean, standard deviation, minimum and maximum values of the gathered data set are utilized as statistical features using a 3-Nearest Neighbors classifier. Unlike [38], power-swept signals are used as incident waves to
Table 4.6: Classification Results in [38] for Five Electronic Devices
Device 1 2 3 4 5
Mean 100% 99.4% 88.7% 99% 89.6%
Std. Dev. 0% 1.1% 4.6% 1.4% 4.8%
Min 100% 95.2% 73.8% 92.9% 71.4%
Max 100% 100% 100% 100% 100%
electronic devices and harmonic responses of the devices are analyzed at first three harmonics in this thesis. Multiple receiver antennas in [38] provide spatial diversity, while power-swept signals provide signal-power diversity in this study. Besides, the statistical features of the normalized estimated vectors of unknown parameters are used as distinguishing factors in this research. Presented classification results prove the proposed method in this thesis to be a practical approach for classification of nonlinear devices with a better performance compared to existing classifiers.
5. CONCLUSIONS AND FUTURE WORK
The novel method presented in this paper classifies various nonlinear electronic circuits such as diode clamper, diode limiter and full-wave rectifier using harmonic radar based on a newly proposed linear model and estimation of unknown deterministic vectors of parameters. Harmonic responses of the circuits are simulated and collected as a large data set using National Instruments (NI) AWR Design Environment. This novel technique, derives the harmonic responses of the ECUT using Power Series Model. As a major continuation, the measurements are related to the unknown vectors of parameters using a newly developed linear model. A unique vector of parameters is estimated using a MLE for each nonlinear circuit under test which allows us to have the unique signature of each one of the Electronic Circuits Under Test (ECUT). The statistical features of the normalized estimated vectors of parameters are analyzed at harmonic frequencies to be used as distinguishing features in classification.
As a novel approach, the classification of the ECUT is done using k-Nearest Neighbors (kNN) classification technique for both single-tone and two-tone re-radiation cases with power-swept incident waves to capture the nonlinearity of the circuits. Performance of the classifier is evaluated for noisy test and training data sets to create a real life scenario. The confusion matrices and scattered feature plots of the normalized estimated data are presented to evaluate the classification technique. Simulation results show that electronic devices under test are successfully classified when statistical features of the normalized estimated vectors of parameters are used for classification. The 3-NN classifier shows its best performance when estimation and classification steps are done at first three harmonics of ω1frequency in two-tone re-radiation case.
Simulation results prove the proposed approach of power-swept incident waves with
unique estimated vectors of unknown parameters to be very effective for classification of nonlinear targets of interest for both single-tone and two-tone re-radiation cases. It is shown that the presented classifier in this study has a better performance compared to existing classifiers.
The proposed technique of this study classifies the ECUT with zero confusion percentages and 100% classification results in some cases. These results may be only obtainable for the electronic circuits that are specifically designed for this research and drop for a different set of electronic circuits outside this work. Taking the statistical feature values (mean and variance) of the estimated data contributes to the high classification results. Other contributing factors may be the made assumptions on CWGN noise vectors in maximum likelihood estimation. The process can be repeated in future work for a different case study with correlated noise vectors. In addition, data can be collected with experimental setup from different nonlinear electronic circuits to verify the results in a more realistic scenario. Furthermore, the performance of the estimator and classifier can be analyzed for fourth, fifth or higher order harmonics of the fundamental frequencies.
BIBLIOGRAPHY
[1] A. V. Oppenheim, A. S. Willsky, and I. T. Young, (1983). Signals and systems, Prentice-Hall, Englewood Cliffs, New Jersey.
[2] J. Saebboe, V. Viikari, T. Varpula, H. Seppä, S. Cheng, M. Al-Nuaimi, P. Hallbjorner, A. Rydberg, (2009). Harmonic automotive radar for VRU classification, International Radar Conference, Surveillance for a Safer World, pp. 1-5.
[3] T. G. Leighton, G. H. Chua, P. R. White, K. F. Tong, H. D. Griffiths, D. J. Daniels, (2013). Radar clutter suppression and target discrimination using twin inverted pulses, Proc R Soc A, vol. 469, no. 2160.
[4] G. J. Mazzaro, A. F. Martone, D. M. McNamara, (2014). Detection of RF electronics by multitone harmonic radar, IEEE Transactions on Aerospace and Electronic Systems, vol. 50, no. 1, pp. 477-490.
[5] M. B. Steer, P. J. Khan, (1984). Large signal analysis of nonlinear microwave systems, IEEE MTT-S International Microwave Symposium Digest, San Francisco, CA, pp. 402-403.
[6] J. Jakabosky, L. Ryan, S. Blunt, (2013). Transmitter-in-the-loop optimization of distorted OFDM radar emissions, IEEE Radar Conference, Ottawa, ON, pp. 1-5. [7] S. Tjora, L. Lundheim, (2012). Distortion modeling and compensation in step
frequency radars, IEEE Transactions on Aerospace and Electronic Systems, vol. 48, no. 1, pp. 360-374.
[8] J. C. Pedro, N. B. De Carvalho, (2001). Evaluating co-channel distortion ratio in microwave power amplifiers, IEEE Transactions on Microwave Theory and Techniques, vol. 49, no. 10, pp. 1777-1784.
[9] K. A. Gallagher, G. J. Mazzaro, R. M. Narayanan, K. D. Sherbondy, A. F. Martone, (2014). Automated cancellation of harmonics using feed-forward filter reflection for radar transmitter linearization, Proc. SPIE 9077, Radar Sensor Technology XVIII, vol. 9461, Baltimore, MD.
[10] K. A. Gallagher, R. M. Narayanan, G. J. Mazzaro, K. D. Sherbondy, (2014). Linearization of a harmonic radar transmitter by feed-forward filter reflection, IEEE Radar Conference, Cincinnati, OH, pp. 1363-1368.
[11] D. W. Steele, F. S. Rotondo, J. L. Houck, (2009). Radar system for manmade device detection and discrimination from clutter, US Patent, No: 7,830,299. [12] F. Crowne, C. Fazi, (2009). Nonlinear radar signatures from metal surfaces,
International Radar Conference, Surveillance for a Safer World, Bordeaux, France, pp. 1-6.
[13] K. A. Gallagher, R. M. Narayanan, G. J. Mazzaro, K. I. Ranney, A. F. Martone, K. D. Sherbondy, (2015). Moving target indication with non-linear radar, IEEE Radar Conference (RadarCon), Arlington, VA, pp. 1428-1433. [14] J. Owen, S. D. Blunt, K. Gallagher, P. McCormick, C. Allen, K. Sherbondy,
(2018). Nonlinear radar via intermodulation of FM noise waveform pairs, IEEE Radar Conference, Oklahoma City, OK, USA, pp. 0951-0956.
[15] R. Pavlik, Z. Hrubos, (2016). Cyclostationary and correlation based signal detection for harmonic radar systems, International Symposium on Fundamentals of Electrical Engineering (ISFEE), Bucharest, Romania, pp. 1-5.
[16] W. J. Keller, (2011). Active improvised explosive device (IED) electronic signature detection, US Patent, No: 8,063,813.
[17] E. M. Schultz, R. D. Curry, R. A. Niksch, (2011). Improvised explosive device countermeasures, US Patent, No: 7,512,511, B1.
[18] S. Holly, N. Koumvakalis, (2011). Multi-band receiver using harmonic synchronous detection, US Patent, No: 8,054,212, B1.
[19] G. E. Lehtola, (2011). RF receiver sensing by harmonic generation, US Patent, No: 7,864,107.
[20] R. Narayanan, S. Smith, K. A. Gallagher, (2014). A multifrequency radar system for detecting humans and characterizing human activities for short-range through-wall and long-range foliage penetration applications, International Journal of Microwave Science and Technology, pp. 1-21.
[21] L. Chioukh, H. Boutayeb, K. Wu, D. Deslandes, (2012). f/nf harmonic radar system with optimal detection of vital signs, 42nd European Microwave Conference, Amsterdam, pp. 25-28.
[22] L. Chioukh, H. Boutayeb, K. Wu, D. Deslandes, (2011). Monitoring vital signs using remote harmonic radar concept, 8th European Microwave Conference, Manchester, pp. 381-384.
[23] Z. Tsai, P. Jau, N. Kuo, J. Kao, K. Lin, F. Chang, E. Yang, H. Wang, (2012). A high range resolution 9.4/18.8 GHz harmonic radar for bees searching, IEEE MTT-S International Microwave Symposium Digest,Montreal, Canada, pp. 1-3. [24] Z. Tsai, P. Jau, N. Kuo, J. Kao, K. Lin, F. Chang, E. Yang, H. Wang,
(2013). A high-range-accuracy and high-sensitivity harmonic radar using pulse pseudorandom code for bee searching, IEEE Transactions on Microwave Theory and Techniques,vol. 61, no. 1, pp. 666-675.
[25] Y. Liu, M. Hsu, H. Wang, Z. Tsai, (2016). A differential miniature transponder for 9.4/18.8 GHz harmonic bee searching radar with low gain degradation from bee’s body, IEEE MTT-S International Microwave Symposium(IMS), San Francisco, USA, pp. 1-4.
[26] M. E. O’Neal, D. Landis, E. Rothwell, L. Kempel, D. Reinhard, (2004). Tracking insects with harmonic radar: a case study, American Entomologist, vol. 50, no. 4, pp. 212-218.
[27] D. Psychoudakis, W. Moulder, C. Chen, H. Zhu, J. L. Volakis, (2008). A portable low-power harmonic radar system and conformal tag for insect tracking, IEEE Antennas and Wireless Propagation Letters, Vol. 7, pp. 444-447.
[28] L. Rong, W. Hai-yong, (2008). The re-radiation characteristics of nonlinear target in harmonic radar detection, China-Japan Joint Microwave Conference, Shanghai, pp. 661-664.
[29] N. Tahir, G. Brooker, (2011). Recent developments and recommendations for improving harmonic radar tracking systems, Proceedings of the 5th European Conference on Antennas and Propagation (EUCAP),Rome, pp. 1531-1535. [30] G. L. Charvat, E. Rothwell, L. Kempel, (2003). Harmonic radar
tag measurement and characterizations, Antennas and Propagation Society International Symposium Digest, Held in conjunction with: USNC/CNC/URSI North American Radio Sci. Meeting, Columbus, OH, pp. 696-699, vol.2.
[31] D. G. Jablonski, H. W. Ko, D. A. Oursler, D. G. Smith, D. M. White, (2004). System and method of radar detection of non-linear interfaces, US Patent, No: 6,765,527.
[32] A. F. Martone, E. J. Delp, (2007). Characterization of RF devices using two-tone probe signals, IEEE/SP 14th Workshop on Statistical Signal Processing, Madison, WI, USA, pp. 161-165.
[33] H. M. Aumann, N. W. Emanetoglu, (2014). A wideband harmonic radar for tracking small wood frogs, IEEE Radar Conference, Cincinnati, OH, pp. 0108-0111.
[34] H. Aumann, E. Kus, B. Cline, N. W. Emanetoglu, (2013). A low-cost harmonic radar for tracking very small tagged amphibians, IEEE International Instrumentation and Measurement Technology Conference (I2MTC),Minneapolis, MN, pp. 234-237.
[35] B.G. Colpitts, D.M. Luke, G. Boiteau, (2000). Harmonic radar for insect flight pattern tracking, Canadian Conference on Electrical and Computer Engineering, Halifax, NS, Canada, pp. 302-306, vol.1.
[36] B.G. Colpitts, G. Boiteau, (2004). Harmonic radar transceiver design: miniature tags for insect tracking, IEEE Transactions on Antennas and Propagation, vol. 52, no. 11, pp. 2825-2832.
[37] J. Kiriazi, J. Nakakura, K. Hall, N. Hafner, V. Lubecke, (2007). Low profile harmonic radar transponder for tracking small endangered species, 29th Annual International Conference of the IEEE Engineering in Medicine and Biology Society,Lyon, pp. 2338-2341.
[38] K. A. Gallagher, (2015). Harmonic radar: theory and applications to nonlinear target detection, tracking, imaging and classification, Ph.D. dissertation, The Pennsylvania State University.
[39] H. Ilbegi, H. T. Hayvaci, I. S. Yetik, A. E. Yilmaz, (2017). Distinguishing electronic devices using harmonic radar, IEEE Radar Conference(RadarConf), Seattle, WA, pp. 1527-1530.
[40] H. Ilbegi, H. T. Hayvaci, I. S. Yetik, (2017). Distinguishing electronic devices using Fourier features derived from harmonic radar, International Conference on Electromagnetics in Advanced Applications (ICEAA), Verona, Italy, pp. 1502-1505.
[41] M. Manjusha, R.Harikumar, (2016). Performance analysis of kNN classifier and k-means clustering for robust classification of epilepsy from EEG signals, International Conference on Wireless Communications, Signal Processing and Networking (WiSPNET),Chennai, pp. 2412-2416.
[42] S. A. Maas, (1988). Nonlinear microwave and RF circuits, Published by Artech House, New York.
[43] F. Giannini, (2004). Nonlinear microwave circuit design, New York, NY, John Wiley and Sons, Ltd.
[44] J. C. Pedro, N. B. Carvolho, (2003). Intermodulation distortion in microwave and wireless circuits, Boston, MA, Artech House.
[45] A. F. Martone, (2007). Forensic characterization of RF circuits, Ph.D. dissertation, Purdue University.
[46] G. J. Mazzaro, (2009). Time-frequency effects in wireless communication systems, Ph.D. dissertation, North Carolina State University.
[47] Steven M. Kay, (1993). Fundamentals of statistical signal processing, estimation theory, vol. 1, New Jersey, Prentice Hall.
VITAE
Name-Surname : Maryam Shahi
Nationality : IR
Date and Place of Birth : 06.08.1991 Ajabshir
E-mail : [email protected]
EDUCATION:
• Undergraduate: 2014, University of Tabriz, Faculty of Electrical and Computer Engineering, Electrical Engineering
PROFESSIONAL EXPERIENCE:
Year Place Position
2016-2019 TOBB University of Economics and Technology TA (M.Sc. Student with Full Scholarship) FOREIGN LANGUAGES: English, Turkish
PUBLICATIONS, PRESENTATIONS AND PATENTS:
• Shahi, M., Ilbegi, H., Yetik, I. S., Hayvaci, H.T., 2019. Distinguishing Electronic Devices Using Harmonic Radar Based on a Linear Model, ICEAA-IEEE APWC Conference, Granada, Spain, 9 - 13 September 2019. • Shahi, M., Ilbegi, H., Yetik, I. S., Hayvaci, H.T., 2019. Classification of
Electronic Devices Using Harmonic Radar Based on a Linear Model with Power-Swept Signals, IEEE Journal in Progress, 2019.