EFFICIENCY AND PERFORMANCE
MEASUREMENT OF TURKISH
UNIVERSITIES VIA DATA
ENVELOPMENT ANALYSIS
Bushra SOUMMAKIEAssoc.Prof.Dr., Antalya Bilim University Faculty of Economics, Business and Social Sciences, Department of Business Administration
[email protected] Işılay TALAY
Assist.Prof.Dr., Antalya Bilim University Faculty of Economics, Business and Social Sciences, Department of Business Administration
bstract: This study aims to measure efficiency and performance of Turkish universities for their research, and communication through their websites. Turkey‟s higher education sector is growing with high momentum and to gain higher rankings globally, Turkish universities must conduct cutting-edge research and communicate it globally. Thus, efficiency and performance measurements in these regards are needed for this development. To reach this aim, indicators for research and website communication are used to apply data envelopment analysis for 50 universities in Turkey. Research and website efficiency scores under variable returns to scale are obtained, and mean research efficiency is higher than the mean website efficiency. Thus, it has been observed that some universities which are successful in terms of research activities have not achieved similar success in the interest and traffic to their websites. To reach the efficient frontier for research, inefficient universities should increase the number of patents and enhance their portfolio of graduate degree programs; while to be efficient for website communication, they need to increase interest in their website to get more links from other websites, and have the visitors spend more time on their website. Meanwhile, they should also decrease the average load time of their websites.
Keywords: Universities in Turkey, data envelopment analysis, research, website and internet-based communication, performance and efficiency.
A
Hacettepe University Journal of Economics and Administrative Sciences Vol. 38, Issue 1, 2020 pp. 115-138VERİ ZARFLAMA
ANALİZİ İLE TÜRKİYE
ÜNİVERSİTELERİNİN VERİMLİLİĞİ
VE PERFORMANSLARININ ÖLÇÜMÜ
Bushra SOUMMAKIEDoç.Dr., Antalya Bilim Üniversitesi İktisadi, İdari ve Sosyal Bilimler Fakültesi İşletme Bölümü
[email protected] Işılay TALAY
Dr.Öğr. Üyesi, Antalya Bilim Üniversitesi İktisadi, İdari ve Sosyal Bilimler Fakültesi İşletme Bölümü
z: Bu çalışma, Türk üniversitelerinin araştırmaları ve web siteleri üzerinden iletişimleri açısından verimlilik ve performanslarını ölçmeyi amaçlamak-tadır. Türkiye‟nin yükseköğretim sektörü yüksek ivme ile büyümekte ve küresel olarak daha yüksek sıralarda yer almak için, Türk üniversitelerinin en üst düzeyde araştırma yapması ve küresel olarak iletişim kurması gerekmektedir. Bu nedenle, bu gelişme için verimlilik ve performans ölçümlerine ihtiyaç vardır. Bu amaca ulaşmak için, Türkiye'deki 50 üniversiteye veri zarflama analizi uygulanmış, bunun için de araştırma ve web sitesi iletişimi odaklı göstergeler kullanılmıştır. Ölçeğe göre değişken getiri kapsamında, araştırma ve web sitesi verimlilik puanları ölçeklenmiş ve ortalama araştırma etkinliği, ortalama web sitesi verimliliğinden daha yüksek çıkmıştır. Böylece, araştırma faaliyetleri açısından başarılı olan bazı üniversitelerin, web sitelerine ilgi ve trafikte benzer bir başarı sağlayamadığı görülmüştür. Araştırma için verimli ön eğri sınırına ulaşmak için, verimsiz üniversitelerin patent sayısını arttırması ve lisansüstü diploma programları portföyünü arttırması gerekmektedir; web sitesi iletişimi içinse, web sitelerine olan ilgiyi arttırarak diğer web sitelerinden daha fazla bağlantı almak ve ziyaretçilerin web sitelerinde daha fazla zaman geçirmelerini sağlamaları gerekmektedir. Bu arada, web sitelerinin ortalama yükleme sürelerini de azaltmaları gereklidir.
Anahtar Sözcükler: Türk üniversiteleri, veri
zarflama analizi, araştırma, web sitesi ve internet tabanlı iletişim, performans ve verimlilik.
Ö
Hacettepe Üniversitesi İktisadi ve İdari Bilimler
Fakültesi Dergisi Cilt 38, Sayı 1, 2020
INTRODUCTION
There have been important developments in the education sector in Turkey within the last fifteen years. The number of state and foundation universities has increased, and Turkey has also started to gain an important place in the global higher education sector. The number of Turkish universities taking place in the global university rankings has been increasing, and operating in this competitive environment, for universities in Turkey, it is necessary to develop a mechanism to measure efficiency in comparison to other universities. With such a mechanism, through efficiency and performance measurement, they can determine what they should do to make themselves more successful than their competitors, which are competing with them to attract students and / or research funding and grants.
In this study, performance and efficiency measurement of universities in Turkey is conducted via data envelopment analysis (DEA) method, the activities included in the performance definition are research indicators and internet and website focused indicators. The internet and website focused indicators are the most important communication resources for Turkish and foreign potential students, industry representatives, and any other interested parties (Gordon, Berhow, 2008: 152; Schimmel
et al., 2010: 5). Thus, research and the means of communication to the external
environment are the performance criteria. The analysis is performed for 50 universities in Turkey. To our knowledge, this is the first study involving the performance criteria for internet and website focused activities concerning Turkish universities. In this study, a DEA optimization model is used. Significant differences have been observed in the efficiency ranking in terms of research indicators and website indicators. Therefore, it has been observed that some universities which are successful in terms of research activities have not achieved similar success in the interest and traffic to their websites. In terms of university-industry cooperation, in order to commercialize the research subjects in the industry, it is necessary to be able to express them as much as possible to any potentially interested party, but it is observed that some universities do not perform the required communication.
Aim of the Study
The aim of this research is to demonstrate the use of DEA to measure the efficiencies of different universities in a developing country, Turkey, where the higher education sector is growing substantially, and present the benchmarks for resource utilization. DEA has been used for efficiency evaluation of universities in many studies globally. Emrouznejad and Yang (2018) provide a comprehensive analysis of 40 years of DEA literature.
We aim to provide managerial insights and guidance to the universities in Turkey from two aspects: research activities and website oriented activities. Turkish universities are publishing more and more research in journals included in citation indexes (Figures 9 and 10 in Günay, Günay, 2011: 20); thus, Turkish universities are improving their effectiveness in their research activities. However, the efficiency of such activities is also important since Turkey is a developing country and efficiency in use of resources is a major topic. There are many examples of use of DEA in measuring research efficiency of universities exclusively (e. g. Lee, Worthington, 2016: 26). In that regard, our study presents the latest evidence from Turkey.
Our study also presents a novel perspective for Turkish universities for measure of website efficiency via DEA. Communication through the website is another topic of interest since university websites could help in reaching prospective students, funders, and businesses (Gordon, Berhow, 2008. 152; Schimmel et al., 2010: 5). Thus, the influence of a university‟s website is acknowledged by the literature and there are previous examples of use of DEA in website efficiency measurement in other countries (Lo Storto, 2014: 642; Najadat et al., 2017: 161). Hence, our study provides a novel approach and guidance in an increasingly important topic for Turkish universities.
Significance and scope of the study
There have been more than 7.5 million students on higher education in Turkey in the 2017-2018 academic year (YÖK, 2019), and only between the years 2006-2011, 50 new public universities and 36 non-profit foundation universities were founded (Altınsoy, 2011: 1). The government‟s social policy, which is to increase the student access to higher education facilities (Günay, Günay, 2011: 17) continues; and especially in non-industrialized regions, it is expected to have more universities founded. It is also due to the strategic public policy factor to increase the social mobility, that the increase in the number of newly founded universities will continue both through government and foundation-oriented higher education sector. All these factors ended up with a massive higher education system, and Turkey has also started to gain an important place in the global higher education sector.
The reason for this emphasis on the higher education sector comes from the influence of this sector on the economic development and growth. Through research and development activities, this sector also provides internationally competitive advantage and prestige, besides the positive effect on the economic welfare of the country (Selim, Bursalioglu, 2013: 896). Therefore, it is imperative for the developing countries to strengthen the higher education sector. For the developing countries such as Turkey, this mission provides a bigger challenge compared to the developed countries because the student numbers and hence the demand for the higher education would be
increasing; however, there will be limited funding that could be dedicated to the education sector besides the other crucial sectors such as health and defense industries (Kuah, Wong, 2011: 499). The competition for funding between different crucial sectors in a developing country necessitates the need for measuring efficiency in the higher education sector.
While the higher education sector serves as a locomotive for economic development, due to some challenges it is not easy to measure the efficiency. In Turkey there is no private university but there are foundation and public universities. Thus, the higher education sector is non-profit in Turkey, and this creates difficulties in constructing economic trade-offs and pricing of resources. In addition to the non-profit nature of this business, the performance on fields such as research is harder to quantify since the positive effects are usually observed quite afterwards. The universities involve many different resources, human capital being the most important one, facilities, funding, etc.; hence the nature of higher education results in using very different types of inputs to produce again different types of outputs with different nature (Munoz, 2016: 810). Therefore, determination of a single production function to help the administrators reach efficiency is not possible through regular means.
DEA is a non-parametric method to compare different but homogenous decision making units in terms of efficiency. The strengths of this method make it particularly useful for measuring the efficiency in the service sector, where both the nature and monetary values of inputs and outputs are harder to quantify. Applying DEA would produce the comparably efficient set of universities in a country that would serve as a reference to the inefficient ones, thus would result in better use of limited funding that would be dedicated to the higher education especially in a developing country. Other methods such as stochastic frontier analysis are also used for calculating the efficiency of universities; however, for relative efficiency measurements DEA is more suitable, since DEA can handle multiple inputs and outputs at the same time (Kağnıcıoğlu, İcan, 2011: 15).
Plan and organization of the study
The paper is comprised of five sections overall. The Introduction is followed by the Literature Review section which includes a table summarizing the related DEA studies on university efficiency with research and/or website focused indicators. Afterwards, the DEA model and the data and sample are explained within the Methodology section. The next section, Results and Discussion, presents the initial results and further analysis and discussion on expected improvements in efficiency and analyzing overall technical efficiency (OTE). The paper ends with the Conclusion section. Tables presenting the main analysis results are placed after the Conclusion and
before the Refences parts.
1. LITERATURE REVIEW
After the DEA method is established by (Charnes et al., 1981: 668) via furthering the efforts of (Farrell, 1957: 253), it has been applied in the higher education sector as well. One may check the review articles about DEA to peruse these advancements and accomplishments (Cook, Seiford, 2009:1; Kuah et al., 2010:168). DEA method has been conducted for universities and individual departments in the previous studies. An overall classification of the applications could regard differentiation of the studies based on the geographical region the study is conducted and output/input types analyzed. Among these studies, some are representative by way of analysis and interpretation of efficiency scores, e. g. (Johnes, Johnes, 1995: 301); whereas some are representative through the level of details included e. g. (Ahn et al., 1989: 165). There are studies conducted in various countries, e. g. in Germany, (Fandel, 2007: 521); in UK, (Sarrico et al., 1997: 1163); in Taiwan, (Kong, Fu, 2012: 541), and similar. A country arguably with more attention given to the application of the DEA method to higher education is Australia since this sector experienced reforms there and the budget for universities were under closer consideration (Dollery et al., 2006: 86). Several studies were conducted regarding the efficiency measurement of universities in Australia, (Avkiran, 2001: 57); and (Abbott, Doucouliagos, 2003: 89) could be referred to as examples. There is recently a particular orientation towards measuring the efficiency of university websites, e. g. (Lo Storto, 2014: 642) evaluated the efficiency of 31 Italian public university websites, and (Najadat et al., 2017: 161) evaluated the efficiency of Jordanian universities‟ websites.
There have been many DEA-oriented studies conducted in Turkey, with Turkish universities being the source of the data. We will provide some references that are to our knowledge to demonstrate further categorization of the studies and provide representative examples to the interested reader. The DEA-oriented studies conducted for Turkish higher education system usually were considering the efficiency of the university overall; moreover, the methods used were not solely the efficiency analysis through the DEA but additional panel data analysis such as the Tobit model. The purpose was first to determine the efficient universities among the data set, and then to apply panel data analysis to determine the factors affecting efficiency. Among such studies there is: (Selim, Bursalioglu, 2013: 896) which studied the output/input data of Turkish universities over 2006-2010; (Selim, Bursalioglu, 2015: 56) which studied data from 51 public universities over 2006-2010 where the first stage of the analysis was to calculate the bootstrapped efficiency and the second stage of the analysis used the Tobit model to determine the factors affecting the efficiency of the universities in the sample; (Erkoç, 2016: 124) applied the same mechanism for the Turkish university data between
2005-2010 similar to (Tekneci, 2014: iv). Additionally, Tekneci (2014) also used Stochastic Frontier Analysis (SFA), another method which is parametric to calculate research efficiency of the Turkish universities, in that regard, Tekneci‟s study differentiated from the ones stated previously since it was aimed on research efficiency only, rather than overall efficiency of a university.
As a significant contribution to the previous DEA studies on Turkish universities we emphasize the website focused output/input analysis as a means of communication and promotion, and to our knowledge this is the first study to include such measures to calculate efficiency. We believe this type of output/input choice would become helpful in Turkey‟s higher education environment since there are many new institutions founded and it is becoming increasingly competitive for them to attract more students although the university mass student population is continuing to increase. Moreover, in our sample there are many young universities (i. e. less than 15 years old) and we expect their efficiency to improve faster, therefore our study provides the latest evidence on these Turkish universities as another contribution to the literature. Among the studies using the DEA method as the single stage of analysis; (Dikmen, 2007: 3) analyzed Turkish universities‟ data for 2000-2001, (Baysal et al., 2005: 72) analyzed Turkish universities‟ efficiency for 2004, and (Kağnıcıoğlu, İcan, 2011: 13) analyzed 2007 data.
Some DEA-oriented, overall university efficiency calculation in Turkey also included methods such as Malmquist total productivity index to observe the change in efficiency through time (Günay et al., 2017: 85). There have been studies regarding the efficiency of universities in Turkey that focused not on the overall performance but on rather more detailed performance measures. For ex, (Bayraktar et al., 2013: 1810) examined the efficiency of the quality management practices in Turkish universities through DEA and SFA, and (Çınar, 2016: 3) applied Multi-Activity DEA to 45 Turkish public universities to determine the “research efficient” and “teaching efficient” universities.
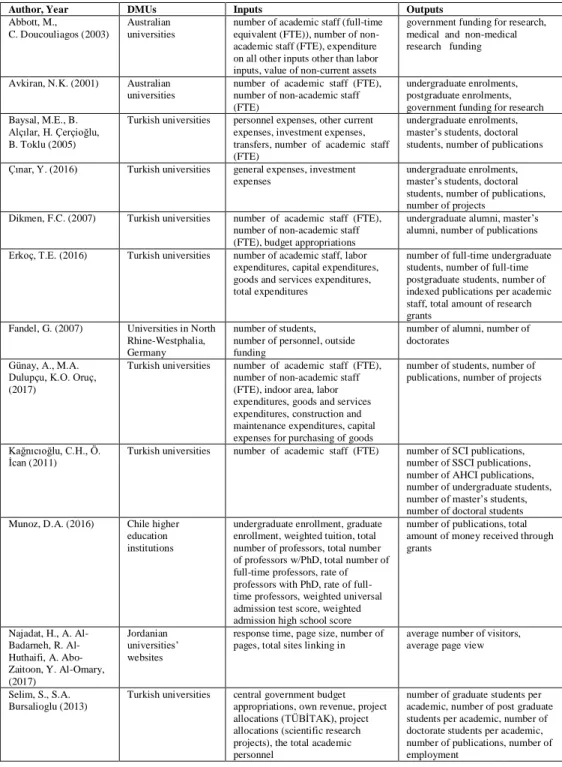
At the table below we have summarized related DEA studies to our knowledge on university efficiency utilizing research and/or website focused indicators similar to ours both from Turkey and other countries. Our contribution to this literature is twofold, first, we included the website efficiency model, which is a novel approach that has been recently recognized, and second, there are very young universities in our sample that are younger than 15 years old and our data provides updated insights for these institutions both on research and website indicators.
Table 1. Summary of Related DEA Studies on University Efficiency with Research and/or Website Focused Indicators
Author, Year DMUs Inputs Outputs
Abbott, M., C. Doucouliagos (2003)
Australian universities
number of academic staff (full-time equivalent (FTE)), number of non-academic staff (FTE), expenditure on all other inputs other than labor inputs, value of non-current assets
government funding for research, medical and non-medical research funding
Avkiran, N.K. (2001) Australian
universities
number of academic staff (FTE), number of non-academic staff (FTE)
undergraduate enrolments, postgraduate enrolments, government funding for research Baysal, M.E., B.
Alçılar, H. Çerçioğlu, B. Toklu (2005)
Turkish universities personnel expenses, other current
expenses, investment expenses, transfers, number of academic staff (FTE)
undergraduate enrolments, master‟s students, doctoral students, number of publications
Çınar, Y. (2016) Turkish universities general expenses, investment
expenses
undergraduate enrolments, master‟s students, doctoral students, number of publications, number of projects
Dikmen, F.C. (2007) Turkish universities number of academic staff (FTE),
number of non-academic staff (FTE), budget appropriations
undergraduate alumni, master‟s alumni, number of publications
Erkoç, T.E. (2016) Turkish universities number of academic staff, labor
expenditures, capital expenditures, goods and services expenditures, total expenditures
number of full-time undergraduate students, number of full-time postgraduate students, number of indexed publications per academic staff, total amount of research grants
Fandel, G. (2007) Universities in North
Rhine-Westphalia, Germany
number of students, number of personnel, outside funding
number of alumni, number of doctorates
Günay, A., M.A. Dulupçu, K.O. Oruç, (2017)
Turkish universities number of academic staff (FTE),
number of non-academic staff (FTE), indoor area, labor expenditures, goods and services expenditures, construction and maintenance expenditures, capital expenses for purchasing of goods
number of students, number of publications, number of projects
Kağnıcıoğlu, C.H., Ö.
İcan (2011) Turkish universities number of academic staff (FTE) number of SCI publications, number of SSCI publications,
number of AHCI publications, number of undergraduate students, number of master‟s students, number of doctoral students
Munoz, D.A. (2016) Chile higher
education institutions
undergraduate enrollment, graduate enrollment, weighted tuition, total number of professors, total number of professors w/PhD, total number of full-time professors, rate of professors with PhD, rate of full-time professors, weighted universal admission test score, weighted admission high school score
number of publications, total amount of money received through grants Najadat, H., A. Badarneh, R. Al-Huthaifi, A. Abo-Zaitoon, Y. Al-Omary, (2017) Jordanian universities‟ websites
response time, page size, number of pages, total sites linking in
average number of visitors, average page view
Selim, S., S.A. Bursalioglu (2013)
Turkish universities central government budget
appropriations, own revenue, project allocations (TÜBİTAK), project allocations (scientific research projects), the total academic personnel
number of graduate students per academic, number of post graduate students per academic, number of doctorate students per academic, number of publications, number of employment
Tablo 1.’in Devamı:
Tekneci, P.D. (2014) Turkish universities professors, associate professors,
assistant professors, research assistants, research infrastructure funds
publications, citations, PhD graduates, TÜBİTAK projects Guccio, C., M.F.
Martorana, I. Mazza (2016)
Italian public universities
total number of students, the total number of academic staff, the total number of available seats in teaching rooms, libraries and laboratories
number of graduates, number of graduates
Hock-Eam, L., F.M. Taib, H. Abdullah, N. Adiana, Y.S. Hwa (2016)
Malaysian public universities
government operating grant, total expense, academic staff, administrative staff, total asset
income generation excluding government
grant, fees income, graduates Eva, M., J.M.
Gómez-Sancho,.C. Perez-Esparrells (2017)
Spanish universities enrollment,
academic staff (FTE)
graduates, publications (WoS) Chuanyi, W., L.
Xiaohong, Z. Shikui (2016)
Chinese universities faculties annual educational
expenditure, area of classroom, area of laboratory
doctor degree granting, master degree granting, bachelor degree granting, papers (CSSCI/CSCD), papers(SCI/SSCI/AHCI), patents
Wolszczak-Derlacz, J. (2017)
European and U.S. universities
academic staff, non-academic staff, total
revenue, total number of students
publications, graduates
Kaynak: Yazarlar tarafından oluşturulmuştur.
The analysis is conducted for measuring the efficiency of 50 Turkish universities in total. Of the 202 institutions listed by Council of Higher Education (YÖK, 2019), there are 129 public and 73 nonprofit foundation universities active in fall 2019. The sample involves universities from different regions, both public and non-profit foundation universities, with different levels of history. The sample is chosen among the universities that are appearing in the world rankings and representing the diverse educational potential in Turkey‟s higher education institutions. The data has been collected during the summer of 2018, and the next two sections will present the details of the model, input and output selection, and similar characteristics of the study along with the analysis results. The paper will end with conclusions and future research.
2. METHODOLOGY 2.1. The DEA Model
In DEA, efficiency is taken as the ratio of outputs to inputs; however, one of the method‟s main aims is to provide guidance to comparably inefficient DMUs, and this could be done in more than one way. If the approach to make the inefficient units efficient is through reduction of inputs, then, this type of DEA analysis is called input-oriented DEA. On the other hand, if the approach to increase the efficiency is through the increase of outputs, then, such a DEA analysis is called output-oriented DEA. In this study output-oriented DEA is conducted, at the same time, the inputs included in the model were assumed to be controllable.
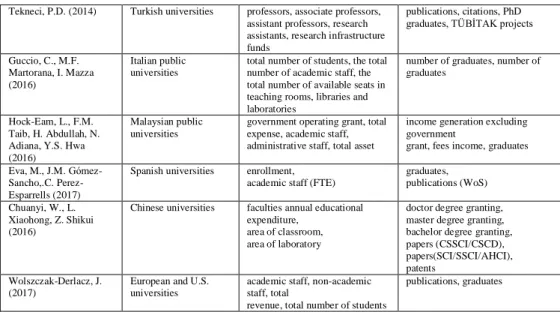
Another classification on the types of DEA is related with the returns to scale properties. In other words, if it is assumed that scale of economies remains constant as the institution‟s size increases, then the DEA is conducted under the assumption of constant returns to scale (CRS). This assumption implies that as inputs are increased the amount of increase in the outputs stays at a constant value. However, in some cases, an increase in the inputs can provide an increase in the outputs at a greater or lower proportion, and variable returns to scale (VRS) assumption applies to these cases. Hence, the DEA could be conducted with both assumptions and two frontiers -CRS and VRS frontiers- could be obtained. The set of efficient units under the CRS assumption is a subset of the ones under the VRS assumption, and moreover, similar to (Botti et al., 2009: 573), in our case due to universities differing in size (the total number of students) and their scale size being under their administration‟s control, the VRS type of analysis was chosen. In this paper, for comparison purposes, we will report the CRS scores and the scale efficiency of the unit as well. The scale efficiency is defined as the efficiency ratio under the CRS divided by the ratio under the VRS, and it reports which units are operating efficiently based on their scale and sizes. In the table below we provide the DEA models used in this research, output-oriented CRS and VRS models.
Table 2. Output-oriented CRS model Maximize θ s. t. ∑ ∑
Table 3. Output-oriented VRS model Maximize θ s. t. ∑ ∑ ∑
The output-oriented CRS and VRS DEA are conducted to measure the efficiency of Turkish universities from two perspectives: research and website focused indicators. To our knowledge, this is the first study to include the web-site and internet based communication as a performance focus. As expressed above the improvement trend in Turkey‟s higher education sector leads the universities into increasing their reputation in the world rankings, and we believe, therefore, not only conducting excellent research but also communicating it efficiently is of outmost importance if the university aims to increase the quality of its admissions and scholars.
In the DEA model conducted to measure research efficiency the inputs focus on the human capital of the universities and the grants obtained by the university. Thus, the inputs involve the monetary and the human capital. The outputs are related with established research metrics such as H-index and number of patents. There are five inputs and three outputs in the research focused model.
In the DEA model to measure website efficiency the inputs are related with potential visitors of the website, e. g. students, and the technical capabilities of the university servers expressed as the average load time, whereas the outputs are related with metrics measuring attention to the website such as the views, time spent on the website, and links with the other sites. There are two inputs and four outputs.
The definitions and data sources of the inputs and outputs of the model are expressed in detail in the following section. The analysis is conducted for measuring the efficiency of 50 Turkish universities in total. According to Boussofianee et al. (1991), for m inputs and p outputs one would need at least (m+p+1) or (m+p)*2 DMUs. Our sample satisfies this requirement. The complete list of universities could be found in Table 6 and Table 8.
2.2. Data and Sample
This section presents the inputs and outputs used for both research and website efficiency indicators.
2.2.1. Research Indicators
Data for research assessment have been extracted from the Scientific and Technological Research Council of Turkey website (TÜBİTAK), the Council of Higher Education website (YÖK), Web of Science website, Scopus website and the universities‟ websites. A sample of 50 universities or decision making units (DMUs) is randomly selected from public and foundation universities in Turkey.
Inputs:
a. Research funding and grants or project allocation, is expressed as the average yearly amount allocated for research projects during the period 2013-2017 (in millions of Turkish liras), taken from the TÜBİTAK website.
b. Number of full time academic staff (full Professors, Associate Professors, Assistant Professors, and Research Assistants). This widely used indicator refers to the staff who perform research and technology transfer activities.
Outputs:
a. Hirsh index (H-index), quantifies the impact and the productivity of the academic staff in the university during the period 2013-2017. It is based on the number of citations that the scientist received from his/her publications and related to the number and the quality of the academic staff publications.
b. Number of patents, is expressed as the number of intellectual properties of the staff in the university during the period 2013-2017. This number is extracted from the Scopus website.
c. Number of graduate degree programs, which is taken from the university website.
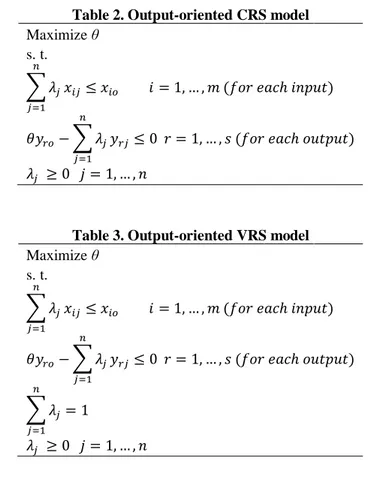
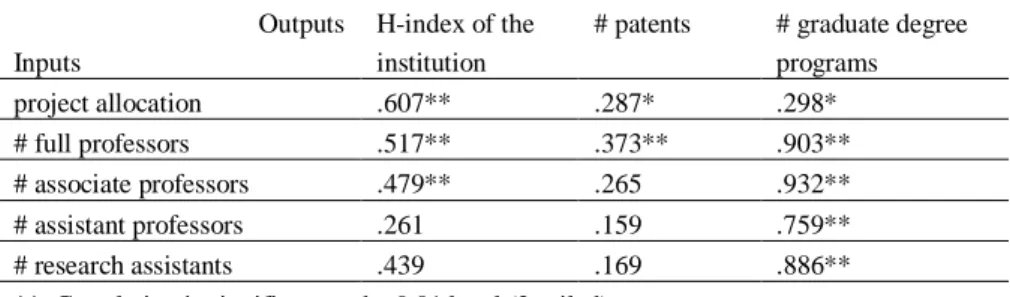
Table 4 presents the correlation between the inputs and outputs for the research model. All the Pearson correlation coefficients are estimated to be positive, indicating the explanatory power of the inputs and outputs in the model, e.g. a strong correlation between the number of full professors and the number of graduate degree programs exist. This is reasonable, since professors are crucial for supervising students conducting research.
Table 4. Correlation Coefficients for Research-Model Outputs
Inputs
H-index of the institution
# patents # graduate degree programs project allocation .607** .287* .298* # full professors .517** .373** .903** # associate professors .479** .265 .932** # assistant professors .261 .159 .759** # research assistants .439 .169 .886**
**. Correlation is significant at the 0.01 level (2-tailed). *. Correlation is significant at the 0.05 level (2-tailed).
2.2.2. Website Indicators
Data for website assessment have been extracted from the Council of Higher Education‟s (YÖK) website and Alexa Internet Company which is an American web traffic analysis company. Literature on website productivity has suggested three major areas for measuring the performance of a website (Lo Storto, 2013; 1007): user experience, website navigability and website structure.
Inputs:
a. The number of undergraduate students.
b. Average load time (in seconds), provides the speed of loading the university website, which is a site performance measurement. It is called the „speed index‟. Research indicates that 53% of people will leave a mobile page if it takes longer than 3 seconds to load (MachMetrics, 2018).
Outputs:
a. Bounce rate, which is the percentage of single-page visits or visits in which the person left the website from the entrance (landing) page. A low rate is preferred.
b. Total sites linking in the university website.
c. The number of page views per visitor per day.
d. Daily time on site per day (in hours).
Najadat et al., (2017: 161) use Response Time (on par with Average Load Time above), Total Sites Linking In (same as above), and Average Number of Visitors (same as above) as indicators of the efficiency evaluation of Jordanian Universities‟ websites via DEA.
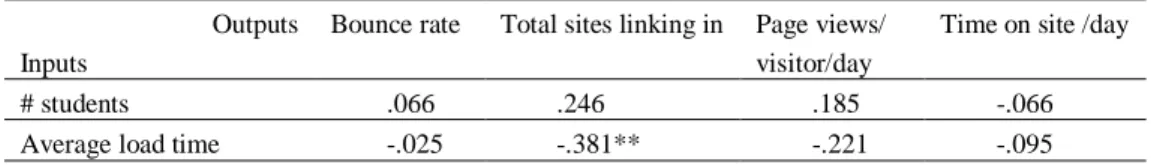
The following table presents the correlation between the inputs and outputs for the website-model.
Table 5. Correlation Coefficients for Website-Model Outputs
Inputs
Bounce rate Total sites linking in Page views/ visitor/day
Time on site /day
# students .066 .246 .185 -.066
Average load time -.025 -.381** -.221 -.095
3. RESULTS AND DISCUSSION 3.1. Initial Results
This section analyses the results for the indicators used, the research and website indicators, respectively. Table 6 summarizes the estimated research-efficiency and the website-efficiency scores.
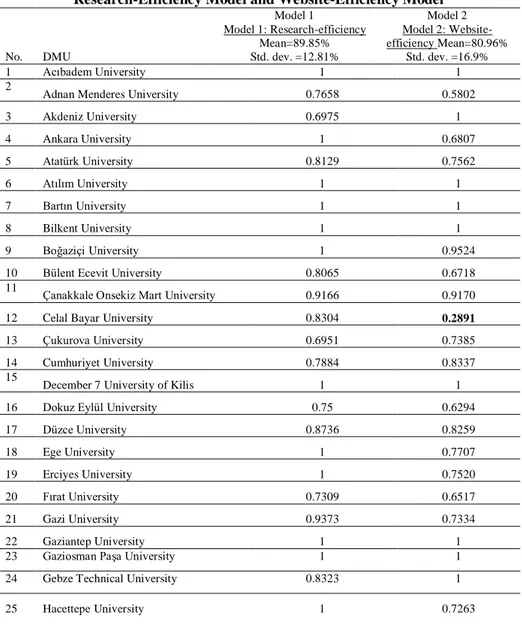
The results of Table 6 give that out of 50 sample universities, 24 universities (48%) have been found research efficient, and the overall mean score is 89.85%. It can be interpreted that the higher education sector in Turkey, in general, is pretty efficient in research dimension. While the mean score for the website model was 80.96% and just 14 universities (28%) are found as website-efficient.
However, the higher mean score (89.85%) and the lower standard deviation of the score (12.81%) in research-model compared with the website-model (mean= 80.96%, SD =16.9%) indicate that the higher education sector in Turkey is more efficient in research than the website communication.
Table 6 shows, assuming VRS, the average of research efficiency scores is 89.85%, i.e. given the scale of operation measured by the amount of output produced, a majority of universities are efficient in allocating their resources to produce as closer to the maximum amount of outcome as possible.
3.2. Expected Improvements in Efficiency
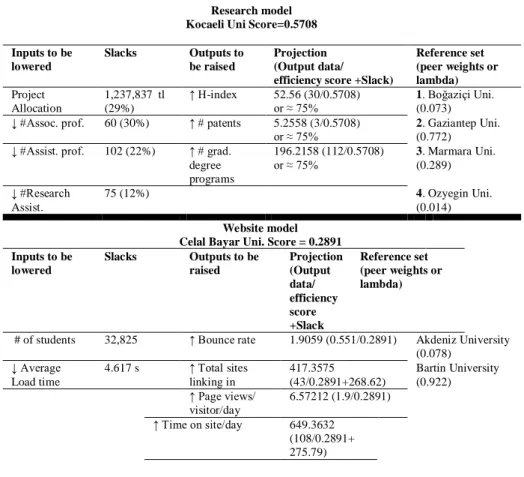
Table 7 shows the expected improvements for the DMU with the lowest score in either model. In other words, the table represents how an inefficient university would achieve efficiency by the allocation of its scarce resources more efficiently to produce higher outputs.
It is interesting to mention that
i. DMU # 36, the unit with the lowest score in the research-model may improve its efficiency score by reducing the amount of project allocation by 29%, associate professors by 30%, assistant professors by 22% and number of research assistants by 12%. Even without these input slacks or over-utilized resources, the DMU can increase its outputs H-index, # of patents as well as # of graduate degree programs by 75.19% (1/0.5708=1.7519).
It is also important to compare the inefficient DMUs with their peer efficient benchmark targets or frontier. In the case of research-model, there are four peers or
reference set of DMU #36 as shown on the last column of Table 7. These peers are Boğaziçi University with corresponding weight or lambda equals to 7.3%, Gaziantep University with a weight 77.2%, Marmara University with 2.89% and Özyeğin University with 1.4% weight. When there is more than one efficient unit in the reference set, the unit with the largest weight is selected. In our case the efficient unit Gaziantep university makes the highest contribution as a benchmark.
ii. In the case of DMU # 12 in the website model, this university can increase its total sites linked-in by 269 sites and the time on site per day about 275.79 hrs. These increases could occur after the outputs are increased to the amount obtained by dividing their original values by the efficiency score. Furthermore, the above increase in the outputs can be reached by reducing the number of students by 32,825 and the average load time by 4.617 sec (over-utilized resources) (See Table 7). This university has two efficient peers, Bartın University with 92.2% weight and Akdeniz university with 7.8% weight.
3.3. Analyzing Overall Technical Efficiency (OTE)
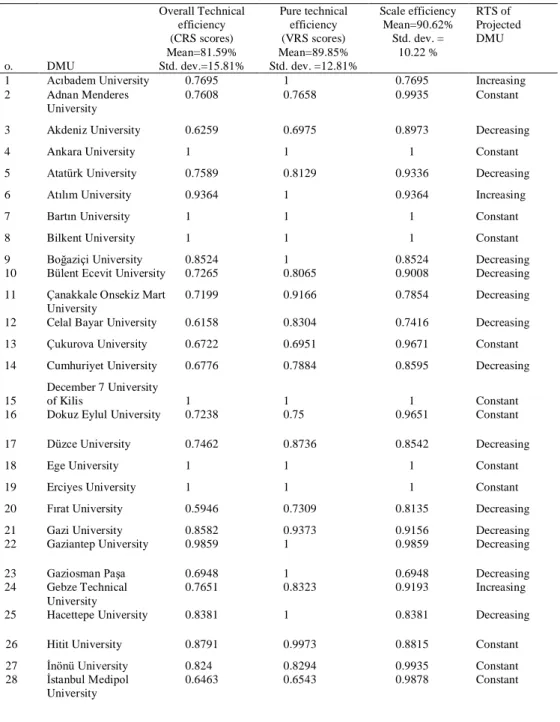
Table 8 presents the efficiency scores of the universities based on the CRS model and VRS model respectively based on the research-efficiency. The CRS model measures the OTE scores, while the VRS model computes the pure technical efficiency (PTE) for a university. The OTE constitute of pure technical efficiency (PTE) and scale efficiency (SE) as shown in Table 8. The comparison of the scale efficiency score and the technical efficiency score explains the source of inefficiency (Cooper et al., 2004). The last column in the table represents the status of returns to scale (RTS) whether it is increasing, decreasing or constant. The results are reported by DEA Excel Solver software. The following discussion is based on the results on Table 8 which presents the universities‟ research-efficiency.
The findings show that Turkish universities, in general, technical and scale efficient. The table gives that out of 50 universities, 15 universities have been found to be overall technically efficient (OTE) with OTE score equal to 1. These universities are efficiently allocating their resources and they are forming a reference set for inefficient universities. It is observed from the table that OTE scores range between 0.4465 and 1, with a mean value of 81.59%. It can be concluded that the universities are obtaining output levels of only 81.59% of what they could obtain by transforming their current level of inputs (or the same level of outputs in sampled universities could be produced with 18.41% less inputs). This percentage refers to the mean overall technical inefficiency (OTIE) score.
Also, out of the 15 efficient universities defining the efficient frontier of the sampled Turkish universities, 6 of the universities are foundation universities (i.e. 36%
of the total efficient universities). This highlights that the foundation universities armed with the public universities in the formation of efficient frontier of Turkish universities.
It is important to conclude that the pure technical efficiency (PTE) scores of the research-efficiency model indicate underutilization of inputs. The mean value of PTE scores is 89.85%. Thus, the degree of pure technical inefficiency (PTIE) in our sample equals 10.15%. This result indicates that 10.15% of the 18.41% of the mean overall technical inefficiency score given above is due to inappropriate allocation of inputs by the management. In addition, based on VRS model, 24 universities have been recognized as relatively efficient. Out of these 24 universities, 15 universities were also efficient based on the CRS model. Thus, the overall technical inefficiency in these other 9 inefficient universities is due to unsuitable choice of scale size instead of managerial decisions on allocation of inputs. Furthermore, the pure technical inefficiency which reflects the managerial inefficiency is a main source of OTIE, in contrast to the scale inefficiency which has a small effect on OTIE.
The values for scale efficiency (SE) are obtained by dividing the OTE by the PTE. If SE=1 then the university is efficient and operating in its optimal scale size, and it is not efficient if SE< 1.
In consequence, 23 or 46% of the sampled Turkish universities have been operating at constant returns to scale; in other words, at their most productive scale size, for instance Ankara, Bartın, Bilkent, etc. Four universities or a small percentage of universities (8%) are operating at an increasing returns to scale. The main reason of the inefficiency of these four universities, namely Acıbadem, Atılım, Gebze Technical and TOBB university of Economics and Technology, is due to the small size of operation and these DMUs need to plan for an expansion (Avkiran, 2001: 71). The remaining 23 or 46% of the universities are operating at a decreasing returns to scale, indicating that these universities like Boğaziçi university are too large in size and they are not taking a full advantage of their scale. These universities have a potential to downsize either by the closure of some programs or by separating their functions into distinct sections and similar (Duan et al., 2019: 68).
CONCLUSION
Turkey has made crucial attempts to improve the quality and the quantity of the higher education institutions especially in the last 20 years. This paper provides an important understanding of the performance level of Turkish universities and how efficient universities convert their inputs into outputs.
Our study was created in order to investigate the efficiency of the Turkish universities from two dimensions: research and website quality. There are several
studies which compare universities from the research and educational perspective. However, for measuring the website-efficiency, this is one of the first attempts to evaluate universities in Turkey. As known, the website efficiency is one of the most valuable marketing assets for each organization.
Further studies may include more indicators for evaluation of universities, especially by adding environmental indicators for assessing the humanitarian perspective of the institutions.
Table 6. Variable Return to Scale (VRS) Scores of Universities Across Research-Efficiency Model and Website-Efficiency Model
No. DMU Model 1 Model 1: Research-efficiency Mean=89.85% Std. dev. =12.81% Model 2 Model 2: Website-efficiency Mean=80.96% Std. dev. =16.9% 1 Acıbadem University 1 1 2
Adnan Menderes University 0.7658 0.5802
3 Akdeniz University 0.6975 1 4 Ankara University 1 0.6807 5 Atatürk University 0.8129 0.7562 6 Atılım University 1 1 7 Bartın University 1 1 8 Bilkent University 1 1 9 Boğaziçi University 1 0.9524
10 Bülent Ecevit University 0.8065 0.6718
11 Çanakkale Onsekiz Mart University
0.9166 0.9170
12 Celal Bayar University 0.8304 0.2891
13 Çukurova University 0.6951 0.7385
14 Cumhuriyet University 0.7884 0.8337
15
December 7 University of Kilis 1 1
16 Dokuz Eylül University 0.75 0.6294
17 Düzce University 0.8736 0.8259 18 Ege University 1 0.7707 19 Erciyes University 1 0.7520 20 Fırat University 0.7309 0.6517 21 Gazi University 0.9373 0.7334 22 Gaziantep University 1 1
23 Gaziosman Paşa University 1 1
24 Gebze Technical University 0.8323 1
Tablo 6’nın Devamı:
26 Hitit University 0.9973 0.7771
27 İnönü University 0.8294 0.8281
28 İstanbul Medipol University 0.6543 0.4797
29 İstanbul Technical University 0.9518 1
30 İstanbul University 1 0.9093
31 İzmir Institute of Technology 1 1
32 İzmir University of Economics 1 0.4879
33 Karabük University 0.8115 0.8478 34 Karadeniz Tech. U. 0.5857 0.7008 35 Koç University 1 0.7044 36 Kocaeli University 0.5708 1 37 Marmara University 1 0.8278 38 Mersin University 1 0.4950
39 Middle East Technical University 1 1
40 Ondokuz Mayıs University 0.7547 0.9088
41 Özyeğin University 1 0.7350
42 Sabancı University 1 1
43 Sakarya University 0.9959 0.8694
44 Selçuk University 0.8583 0.7305
45 Süleyman Demirel University 0.7747 0.7791
46 TOBB University of Economics and
Technology
1 0.7428
47 Uludağ University 1 0.8376
48 Yeditepe University 1 0.6207
49 Yıldız Technical University 0.967 0.8246
Table 7. Expected Improvements for Universities with the Lowest VRS Scores Research model
Kocaeli Uni Score=0.5708 Inputs to be lowered Slacks Outputs to be raised Projection (Output data/ efficiency score +Slack)
Reference set (peer weights or lambda) Project Allocation 1,237,837 tl (29%) ↑ H-index 52.56 (30/0.5708) or ≈ 75% 1. Boğaziçi Uni. (0.073)
↓ #Assoc. prof. 60 (30%) ↑ # patents 5.2558 (3/0.5708)
or ≈ 75% 2. Gaziantep Uni. (0.772)
↓ #Assist. prof. 102 (22%) ↑ # grad. degree programs 196.2158 (112/0.5708) or ≈ 75% 3. Marmara Uni. (0.289) ↓ #Research Assist. 75 (12%) 4. Ozyegin Uni. (0.014) Website model Celal Bayar Uni. Score = 0.2891 Inputs to be lowered Slacks Outputs to be raised Projection (Output data/ efficiency score +Slack Reference set (peer weights or lambda)
# of students 32,825 ↑ Bounce rate 1.9059 (0.551/0.2891) Akdeniz University
(0.078) ↓ Average Load time 4.617 s ↑ Total sites linking in 417.3575 (43/0.2891+268.62) Bartin University (0.922) ↑ Page views/ visitor/day 6.57212 (1.9/0.2891) ↑ Time on site/day 649.3632 (108/0.2891+ 275.79)
Table 8. Technical and Pure Technical Efficiency Scores (Research-Efficiency Model)1 N o. DMU Overall Technical efficiency (CRS scores) Mean=81.59% Std. dev.=15.81% Pure technical efficiency (VRS scores) Mean=89.85% Std. dev. =12.81% Scale efficiency Mean=90.62% Std. dev. = 10.22 % RTS of Projected DMU
1 Acıbadem University 0.7695 1 0.7695 Increasing
2 Adnan Menderes
University
0.7608 0.7658 0.9935 Constant
3 Akdeniz University 0.6259 0.6975 0.8973 Decreasing
4 Ankara University 1 1 1 Constant
5 Atatürk University 0.7589 0.8129 0.9336 Decreasing
6 Atılım University 0.9364 1 0.9364 Increasing
7 Bartın University 1 1 1 Constant
8 Bilkent University 1 1 1 Constant
9 Boğaziçi University 0.8524 1 0.8524 Decreasing
10 Bülent Ecevit University 0.7265 0.8065 0.9008 Decreasing
11 Çanakkale Onsekiz Mart
University
0.7199 0.9166 0.7854 Decreasing
12 Celal Bayar University 0.6158 0.8304 0.7416 Decreasing
13 Çukurova University 0.6722 0.6951 0.9671 Constant
14 Cumhuriyet University 0.6776 0.7884 0.8595 Decreasing
15
December 7 University
of Kilis 1 1 1 Constant
16 Dokuz Eylul University 0.7238 0.75 0.9651 Constant
17 Düzce University 0.7462 0.8736 0.8542 Decreasing
18 Ege University 1 1 1 Constant
19 Erciyes University 1 1 1 Constant
20 Fırat University 0.5946 0.7309 0.8135 Decreasing
21 Gazi University 0.8582 0.9373 0.9156 Decreasing
22 Gaziantep University 0.9859 1 0.9859 Decreasing
23 Gaziosman Paşa 0.6948 1 0.6948 Decreasing
24 Gebze Technical
University
0.7651 0.8323 0.9193 Increasing
25 Hacettepe University 0.8381 1 0.8381 Decreasing
26 Hitit University 0.8791 0.9973 0.8815 Constant
27 İnönü University 0.824 0.8294 0.9935 Constant 28 İstanbul Medipol University 0.6463 0.6543 0.9878 Constant 1
Notes: CRS - constant returns to scale. VRS - variable returns to scale. RTS - returns to scale. Scale efficiency = Overall Technical Efficiency (OTE) / Pure Technical Efficiency (PTE)
Tablo 8’in Devamı:
29 İstanbul Technical
University
0.542 0.9518 0.5694 Decreasing
30 İstanbul University 1 1 1 Constant
31 İzmir Institute of Technology 1 1 1 Constant 32 İzmir University of Economics 1 1 1 Constant
33 Karabük University 0.7736 0.8115 0.9533 Constant
34 Karadeniz Technical
University
0.4593 0.5857 0.7842 Decreasing
35 Koç University 1 1 1 Constant
36 Kocaeli University 0.4465 0.5708 0.7822 Decreasing
37 Marmara University 1 1 1 Constant
38 Mersin University 0.782 1 0.7820 Decreasing
39
Middle East Technical
University 0.8714 1 0.8714 Decreasing
40 Ondokuz Mayıs
University
0.7527 0.7547 0.9973 Constant
41 Özyeğin University 1 1 1 Constant
42 Sabancı University 1 1 1 Constant
43 Sakarya University 0.8671 0.9959 0.8707 Decreasing
44 Selçuk University 0.8259 0.8583 0.9623 Decreasing
45 Süleyman Demirel University 0.6318 0.7747 0.8155 Decreasing 46 TOBB University of Economics and Technology 0.7627 1 0.7627 Increasing
47 Uludağ University 1 1 1 Constant
48 Yeditepe University 1 1 1 Constant
49 Yıldız Technical
University
0.7319 0.967 0.7569 Decreasing
50 Pamukkale University 0.6751 0.7364 0.9168 Decreasing
REFERENCES
Abbott, M., C. Doucouliagos (2003), “The efficiency of Australian universities: A Data Envelopment Analysis”, Economics of Education review, 22(1), 89-97.
Ahn T., V. Arnold, A. Charnes, WW. Cooper (1989), “DEA and Ratio Efficiency Analyses for Public Institutions of Higher Learning in Texas”, Research in Governmental and
Nonprofit Accounting, 5(2), 165-185.
Altınsoy S. (2011), “A Review of University Facilities in Turkey”, CELE Exchange, 2011(6), 1-5. Avkiran, N.K. (2001), “Investigating Technical and scale Efficiencies of Australian Universities
Through Data Envelopment Analysis”, Socio-Economic Planning Sciences, 35(1), 57-80.
Bayraktar, E., E. Tatoglu, S. Zaim (2013), “Measuring the Relative Efficiency of Quality Management Practices in Turkish Public and Private Universities”, Journal of the
Operational Research Society, 64(12), 1810-1830.
Baysal, M.E., B., Alçılar, H. Çerçioğlu, B. Toklu (2005), “Türkiye'deki Devlet Üniversitelerinin 2004 Yılı Performanslarının, Veri Zarflama Analizi Yöntemiyle Belirlenip Buna Göre 2005 Yılı Bütçe Tahsislerinin Yapılması”, Sakarya Üniversitesi Fen Bilimleri Enstitüsü
Dergisi, 9(1), 67-73.
Botti, L., W. Briec, G. Cliquet (2009), “Plural Forms versus Franchise and Company-Owned Systems: A Dea Approach of Hotel Chain Performance”, Omega, 37(3), 566-578. Boussofiane, A., R.G. Dyson, E. Thanassoulis (1991), “Applied Data Envelopment
Analysis”, European Journal of Operational Research, 52(1), 1-15.
Charnes, A., W.W. Cooper, E. Rhodes (1981), “Evaluating Program and Managerial Efficiency: An Application of Data Envelopment Analysis to Program Follow Through”,
Management Science, 27(6), 668–697.
Chuanyi, W., L. Xiaohong, Z. Shikui (2016), “The Relative Efficiencies of Research Universities of Science and Technology in China: Based on the Data Envelopment Analysis and Stochastic Frontier Analysis”, Eurasia Journal of Mathematics, Science & Technology
Education, 12(10), 2753-2770.
Cook, W.D., L.M. Seiford (2009), “Data Envelopment Analysis (DEA) - Thirty Years On”,
European Journal of Operational Research, 192, 1-17.
Cooper, W.W., Seiford, L.M., J. Zhu (2004), “Data Envelopment Analysis”, Handbook on Data
Envelopment Analysis, Boston, MA: Springer, 1-39.
Çınar, Y. (2016), Research and Teaching Efficiencies of Turkish Universities with Heterogeneity
Considerations: Application of Multi-Activity DEA and DEA by Sequential Exclusion of Alternatives Methods.
https://arxiv.org/ftp/arxiv/papers/1701/1701.07318.pdf (Access Date: 11.10.2018) Dikmen, F.C. (2007), “Veri Zarflama Analizi İle Üniversitelerin Etkinliğinin Ölçülmesi”, Kocaeli
Üniversitesi İktisadi ve İdari Bilimler Dergisi, 3-4(3-6), 1-22.
Dollery, B., D. Murray, L. Crase (2006), “Knaves or knights, Pawns or Queens? An Evaluation of Australian Higher Education Reform Policy”, Journal of Educational Administration, 44(1), 86-97.
Duan, S.X., H. Deng, F. Luo (2019), “An Integrated Approach for Identifying the Efficiency-Oriented Drivers of Electronic Markets in Electronic Business”, Journal of Enterprise
Information Management, 32(1), 60-74.
Emrouznejad, A., G.L. Yang (2018), “A survey and Analysis of the first 40 Years of Scholarly literature in DEA: 1978–2016”, Socio-Economic Planning Sciences, 61, 4-8.
Erkoç, T.E. (2016), “Measuring Efficiencies of Turkish Public Universities with Non-Parametric Efficiency Estimation Method [Türkiye‟de Kamu Üniversitelerinin Etkinliğinin Parametrik Olmayan Yöntem ile Ölçülmesi]”, Hacettepe Üniversitesi Eğitim Fakültesi
Eva, M., Gómez-Sancho, J.M., C. Perez-Esparrells (2017), “Comparing University Performance By Legal Status: A Malmquist-Type Index Approach for the Case of The Spanish Higher Education System”, Tertiary Education and Management, 23(3), 206-221. Fandel, G. (2007), “On the Performance of Universities in North Rhine-Westphalia, Germany:
Government's Redistribution of Funds Judged Using Dea Efficiency Measures”,
European Journal of Operational Research, 176(1), 521-533.
Farrell, M.J. (1957), “The Measurement of Productive Efficiency”, Journal of the Royal
Statistical Society. Series A (General), 120(3), 253–290.
Gordon, J., S. Berhow (2008), “University Websites and Dialogic Features for Building Relationships with Potential Students”, Public Relations Review, 35(2), 150–152. Guccio, C., Martorana, M.F., I. Mazza (2016), “Efficiency Assessment and Convergence in
Teaching and Research in Italian Public Universities”, Scientometrics, 107(3), 1063-1094.
Günay, A., Dulupçu, M.A., K.O. Oruç (2017), “Türkiye‟de Devlet Üniversitelerinin Etkinlik ve Verimlilik Analizi: Veri Zarflama Analizi ve Malmquist Toplam Faktör Verimlilik Endeksi Uygulamaları”, Abant İzzet Baysal Üniversitesi Sosyal Bilimler Enstitüsü
Dergisi, 17(3), 85-113.
Günay, D., A. Günay (2011), “1933'den Günümüze Türk Yükseköğretiminde Niceliksel Gelişmeler”, Journal of Higher Education & Science/Yüksekögretim ve Bilim
Dergisi, 1(1), 1-22.
Hock-Eam, L., Taib, F.M., Abdullah, H., Adiana, N., Y.S. Hwa (2016). “How Efficient are Malaysian Public Universities?, A Comparative Analysis Using Data Envelopment Analysis”, Asian Academy of Management Journal, 21(2), 75-97.
Johnes J, G. Johnes (1995), “Research Funding and Performance in U.K. University Departments of Economics: a Frontier Analysis”, European Economics Review,14(3), 301-314. Kağnıcıoğlu, C.H., Ö. İcan (2011), “Measuring Relative Efficiencies of Turkish Universities in
2007: A DEA Case Study in R”, Anadolu University Journal of Social Sciences, 11(1), 13-26.
Kong, W.H., T.T. Fu (2012), “Assessing the Performance of Business Colleges in Taiwan Using Data Envelopment Analysis and Student Based Value-Added Performance Indicators”, Omega, 40(5), 541-549.
Kuah, C.T., Wong, K.Y., F. Behrouzi (2010, May). A Review on Data Envelopment Analysis
(DEA), In 2010 Fourth Asia International Conference on Mathematical/Analytical
Modelling and Computer Simulation (pp. 168-173), Kota Kinab, Malaysia: IEEE. Kuah, C.T., K.Y. Wong (2011), “Efficiency Assessment of Universities Through Data
Envelopment Analysis”, Procedia Computer Science, 3, 499-506.
Lee, B.L., A.C. Worthington (2016), “A Network DEA Quantity and Quality-Orientated Production Model: An Application to Australian university Research Services”, Omega
Lo Storto, C., (2013), “Evaluating Ecommerce Websites Cognitive Efficiency: An Integrative Framework Based on Data Envelopment Analysis”, Applied Ergonomics, 44, 1004-1014.
Lo Storto, C. (2014), “Benchmarking Website Performance in the Public Sector: A Non Parametric Approach”, Journal of Computers, 9(3), 636-643.
MachMetrics, (2018), https://www.machmetrics.com/speed-blog/average-page-load-times-websites-2018/ (Access Date: 22.07.2019)
Munoz, D.A. (2016), “Assessing the Research Efficiency of Higher Education Institutions in Chile: A Data Envelopment Analysis Approach”, International Journal of Educational
Management, 30(6), 809-825.
Najadat, H., A. Al-Badarneh, R. Al-Huthaifi, A. Abo-Zaitoon, Y. Al-Omary (2017), “Evaluating Jordanian Universities' Websites based on Data Envelopment Analysis”, In 2017 8th
International Conference on Information and Communication Systems (ICICS) (pp.
159-164),Irbid, Jordan: IEEE.
Sarrico, C.S., S.M. Hogan, R.G Dyson, A.D. Athanassopoulos (1997), “Data Envelopment Analysis and University Selection”, Journal of the Operational Research
Society, 48(12), 1163-1177.
Schimmel, K., D. Motley, S. Racic, G. Marco, M. Eschenfelder (2010), “The Importance of University Web Pages in Selecting a Higher Education Institution”, Research in Higher
Education, 9, 1-16.
Selim, S., S.A. Bursalioglu (2013), “Analysis of the Determinants of Universities Efficiency in Turkey: Application of the Data Envelopment Analysis and Panel Tobit Model”, Procedia-Social and Behavioral Sciences, 89, 895-900.
Selim, S., S.A. Bursalıoğlu (2015), “Efficiency of Higher Education in Turkey: A Bootstrapped Two-Stage DEA Approach”, International Journal of Statistics and Applications, 5(2), 56-67.
Tekneci, P.D. (2014), Evaluating Research Performance of Turkish Universities. PhD Dissertation, Ankara: Middle East Technical University.
Wolszczak-Derlacz, J. (2017), “An Evaluation and Explanation of (in) Efficiency in Higher Education Institutions in Europe and the US with the Application of Two-Stage Semi-Parametric DEA”, Research Policy, 46(9), 1595-1605.