Nutrition and dehydration: players should learn how
to bring them to life.
Gizem Kose
1, Cemil Tu
ğrulhan Şam
2, Orcan Mızrak
2, Hakan Acar
3, Erkut Tutkun
4*
1 Department of Nutrition and Dietetics, Istanbul Kent University, Istanbul, Turkey; 2 Faculty of Sports Science, Atatürk
University, Erzurum, Turkey; 3 Department of Phsical Educationand Sport, Bülent Ecevit University, Zonguldak, Turkey; 4 Faculty of Sport Science, Bursa Uludağ University, Bursa,Turkey
Abstract
Objective: In the present study, it is aimed to investigate the relationship between nutritional knowledge,
hydration, food frequency with their gender and body mass index among students from sports department.
Methods: This cross-sectional study was conducted 127 randomly selected undergraduate students in Spring
2019. Participants completed sociodemographic form, and Nutrition Knowledge Level Survey for Adults (NKLSA) questionnaires that included questions related to their eating habits, nutritional knowledge etc. Body weight and height of participants were measured.
Results: In the present study, 66.1% of the participants were female and 33.9% were male, the mean age
was 20.5 ± 4.15 years; mean body mass index (BMI, kg/m²) was 21.49 ± 2.13; 22.35 ± 2.35 in males and 21.06 ± 1.87 in females (p < 0.05). Distributions in the BMI classification were, mostly (91.3%) normal (NW) and there was a significant difference between gender (p < 0.05). There was no statistically significant differ-ence between mean Nutrition Knowledge Level Survey for Adults (NKLSA) scores of males (50.00 ± 5.57) and females (50.16 ± 6.36) (p > 0.05). UW group was found to be having high NKLSA scores than the other BMI classes but it was not statistically significant. More than 50% of participants want to have an education about nutrition, mostly based on sports nutrition (p < 0.05). Most of female and male participants (65.5% and 60.5%) had a moderate score on NKLSA. Training hours were higher in normal weight group (p < 0.001). Hydration states of participants found as females drink more water before (p < 0.05) and during training than males, but males drinking more water in a day than females (p < 0.05). There was no statistically significant difference between mean NKLSA scores of males and females (p > 0.05). Females and males ate CHO but females have more protein than males (p < 0.000) after trainings. Pre-obese group had more carbohydrate and protein than other groups (p < 0.001). All gender and BMI groups found mostly drink just water during trainings. There was only one significant correlation between water intake and liquid intake daily (p < 0.001).
Conclusion: Adolescence is an important because lifelong eating habits can build in this part of life.
In-creased body mass index, eating and nutrition can be impaired based on sports performance. Nutritional knowledge assessment tools are crucial to detect athlete’s nutritional and fluid intake as well as endurance and performance during trainings and matches.
Introduction
Sports nutrition is the adequate and balanced intake of nutrients with the arrangements that are adjusted amounts according to age, gender, physi-cal activity and sports type, training and competition periods (1). For athletic population, nutrition has an important place for both performance and a healthy life (2). The performance of the athlete may be posi-tively and negaposi-tively affected due to nutrition (3). In addition to training, performance improvements can be done with a balanced diet (4,5). A well balanced adequate nutrition plan should be organized consider-ing trainconsider-ing and competition timconsider-ings.
Players and athletes generally have special en-ergy and nutrient needs that support enen-ergy system for greater energy expenditure, increased macronutri-ent requiremmacronutri-ents (6). Muscle glycogen appears to be the main source of energy during matches (7) and en-hancing energy stores with carbohydrate can maximize muscle protein synthesis (8). Therefore, an inadequate carbohydrate intake may negatively affect performance. Higher grain consumption with a consistency in sports nutrition recommendations, promotes adequate intake of carbohydrate to enhance performance (9,10). Car-bohydrates are vital for sports performance (11,12) to reach optimal performance due to aerobic nature of physical activity (13,14) by having a positive effect on cardiovascular system, too (15). Players and athletes seem to not meeting recommended carbohydrate takes (1). It has been suggested that daily nutrient in-take should be based on CHO (16,17) and organized specially for athletic performance for sports training and match schedules (18). Depending on individual levels of activity, for footballers 6-10g/kg a day intake of CHO may be enough for plenish glycogen stores and provide supplementary fuel (15). Protein intakes of players and atheletes varies in researches (1,16,19). There are recommendations for intake (16) but some-times it can be exceeding (13). Greater than 1.5g/ kg a day intake of protein may cause health problems and especially using protein powders (19). In a review, percentage of macronutrients to be taken according to energy mentioned as 53.1% CHO, 15.3% protein and 28.5% fat (6).
Water, which is an essential nutrient for human life, is also important for the performance of athletes. Hydration is important before, during and after train-ings (20). The rate of sweating during the match; match duration and intensity differ depending on environ-mental conditions. Water consumption promotes ad-equate hydration for athlete and it makes performance safer and optimal (16). Especially the loss of sweat of elite athletes often exceeds fluid intake and in this case results in dehydration (21). Even in a 2-3% dehydra-tion causes a decrease in performance. A fluid intake above the loss of fluid in the body caused by sweating is a cause of hyponatremia, also known as water poi-soning. For this reason, athletes should drink 500-600 ml of water 2-3 hours before training or competition and during, every 15-20 minutes 200-300 ml.
Nutritional information can be reached by anyone or anywhere (22). The source of information is vital because information should be accurate and practicable to be us-able (23,24). In a big review, it was implied as there are so many misconceptions about the roles of nutrients and their contents (energy, cholesterol, fiber etc), and espe-cially protein usage for energy (25). In a study it is found that only 22% percent of players knew that fat is the most energy densed food (26). Nutritional information source is a factor that determines nutritional knowledge quality (2,27,28). Athlete’s, players’ and coach’s nutritional infor-mation status is unclear. In a review, it was implied that having previously nutrition course correlated with higher scores of knowledge (13). Athletic performance must meet all recommendations (16) and include sufficient en-ergy, nutrients, hydration and meal times (2). Nutritional knowledge is correlated with a higher quality of diet (29,30) and counseling should be made by dietitian or sports dietitian (8). For athletes and players, there should be general and sport nutrition educations regularly (4,9)
The aim of this study was to investigate the relation-ship between nutritional knowledge and dehydration.
Materials and Methods
In the present study, a questionnaire form con-sisting of 20 questions including age, gender, sports branch, nutrition education status, training nutrition
and hydration informations were used and body mass index that was calculated after measurement.
Nutrition Knowledge Level Survey for Adults (NKLSA) Nutrition Knowledge Level Survey for Adults was developed by Batmaz (2018) as Turkish version. It has 20 items with likert type (strongly agree, agree, neither agree nor disagree, disagree, strongly disagree). The max-imum score that can be obtained under the basic nutri-tion title is 80. And at the end of the scale, participants evaluated the relationship between nutrition and health and the accuracy of food preferences in daily life with a separate VAS scale that ranges from 0 to 10. In the origi-nal form of NKLSA, cronbach alpha value was found as 0.72, in our study we found 0.797 with a good consisten-cy. The level of knowledge of the participants with a total score of less than 45 was poor, the level of knowledge of those with a score of 45-55 was moderate, the level of those with a score of 56-65 was good, and the level of knowledge of those with a score of 65 was very good. Statistical analysis
In the study, Skewness and Kurtosis, Student t-test, one-way ANOVA, chi-square analysis, Pearson correlation analysis were used to evaluate the data ob-tained. Skewness and Kurtosis values falling outside the range of -1.5 to +1.5 indicate a normal distribution. Pearson correlation and regression was used to NKL-SA total scores and their correlations with the score groups. Body Mass Index (BMI): body weight (kg)/ height² (m²) calculated with the formula. The World Health Organization (WHO) classification was used for BMI. Data were analyzed by using the IBM SPSS Statistics version 21 software for Windows. Signifi-cance level was p < 0.05.
Results
In the present study, 127 students were participat-ed, 66.1% of the participants were female and 33.9% were male, the mean age was 20.5 ± 4.15 years. Mean body mass index (BMI, kg/m²) was 21.49 ± 2.13;
22.35 ± 2.35 in males and 21.06 ± 1.87 in females (p < 0.05). Distributions in the BMI classification were, 3.1% were under weight (UW), 91.3% were nor-mal (NW) and 5.5% pre-obese (PW); 86.0% of nor-males were NW, 94% of females were NW (p < 0.05).
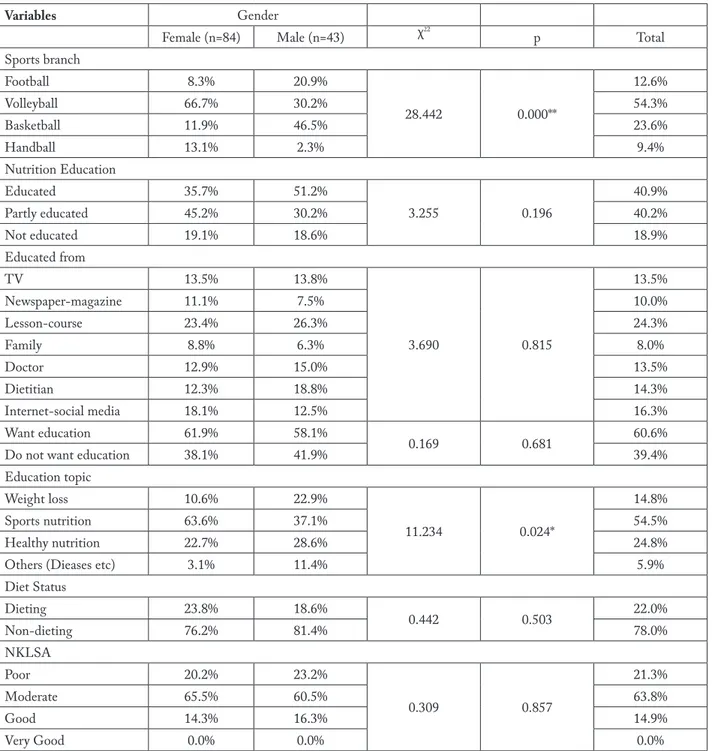
Participants were gathered in four groups as foot-ball, volleyfoot-ball, basketball and handball players and a significant difference was found between females and males. Although 60.6% of the participants responded not being educated, the percentage of educated from whom question’s response increased to 87.4%. There was no significant difference between participants who received, did not receive, and partially received nutri-tion educanutri-tion (p > 0.05). Most of participants that received a nutrition education as females-males (23.4-26.3%) had a course/ lesson during their college life, and others had information from social media (18.1-12.5%), dietitian (12.3-18.8%), doctor (12.9-15.0%), TV (13.5-13.8%), newspaper/magazine (11.1-7.5%), family (8.8-6.3%). More than 50% of female-male participants want to have an education about nutri-tion, mostly based on sports nutrinutri-tion, and females (63.6%) want more sports nutrition education than males (37.1%) (p < 0.05). Most of females (76.2%) and males (81.4%) were not on diet (p > 0.05).
Nutrition Knowledge Level Survey for Adults (NKLSA) scores divided originally to four categories as poor, moderate, good, and very good knowledge. But as it can be seen on the Table 1, there were no ‘very good’ answer group for this categorization. Most of female and male participants (65.5% and 60.5%) had a moderate score on NKLSA.
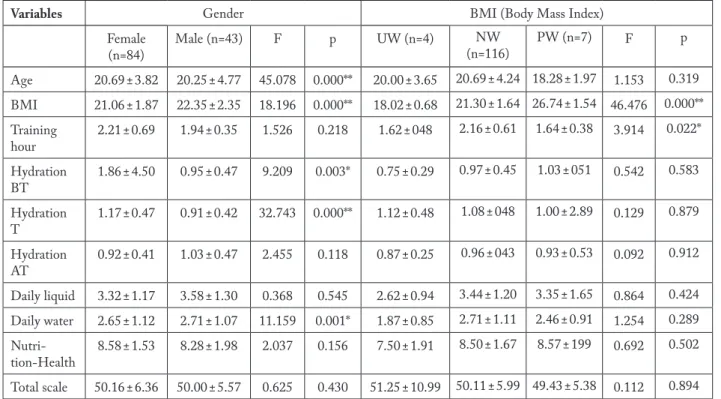
There was a significant difference between gen-ders’ mean BMI, and males had higher BMI than females (p < 0.001). Training hours were significantly higher in normal weight group than other BMI classes (p < 0.001). Hydration states of participants found as females drink more water before (p < 0.05) and dur-ing (p < 0.001) traindur-ing than males, but males drinkdur-ing more water in a day than females (p < 0.05). There was no statistically significant difference between mean NKLSA scores of males (50.00 ± 5.57) and females (50.16 ± 6.36) (p > 0.05). UW group was found to be having high NKLSA scores than the other BMI class-es but it was not statistically significant.
Table 1. Distribution of sports branch, nutrition education, diet status and NKLSA score groups according to gender
Variables Gender
Female (n=84) Male (n=43) χ22 p Total Sports branch Football 8.3% 20.9% 28.442 0.000** 12.6% Volleyball 66.7% 30.2% 54.3% Basketball 11.9% 46.5% 23.6% Handball 13.1% 2.3% 9.4% Nutrition Education Educated 35.7% 51.2% 3.255 0.196 40.9% Partly educated 45.2% 30.2% 40.2% Not educated 19.1% 18.6% 18.9% Educated from TV 13.5% 13.8% 3.690 0.815 13.5% Newspaper-magazine 11.1% 7.5% 10.0% Lesson-course 23.4% 26.3% 24.3% Family 8.8% 6.3% 8.0% Doctor 12.9% 15.0% 13.5% Dietitian 12.3% 18.8% 14.3% Internet-social media 18.1% 12.5% 16.3% Want education 61.9% 58.1% 0.169 0.681 60.6% Do not want education 38.1% 41.9% 39.4% Education topic Weight loss 10.6% 22.9% 11.234 0.024* 14.8% Sports nutrition 63.6% 37.1% 54.5% Healthy nutrition 22.7% 28.6% 24.8%
Others (Dieases etc) 3.1% 11.4% 5.9%
Diet Status Dieting 23.8% 18.6% 0.442 0.503 22.0% Non-dieting 76.2% 81.4% 78.0% NKLSA Poor 20.2% 23.2% 0.309 0.857 21.3% Moderate 65.5% 60.5% 63.8% Good 14.3% 16.3% 14.9% Very Good 0.0% 0.0% 0.0%
*p < 0.05, **p < 0.001 NKLSA: Nutrition Knowledge Level Survey for Adults.
Participants were asked open-ended questions about the foods they consumed before, during and, after training. Afterwards, the answers were divided into nutrients (carbohydrates, protein, water and oth-ers). Foods such as pasta, banana, dried fruit were
in the carbohydrate (CHO) group; toast, sandwich, main meal in CHO+protein group; meat products and chicken were evaluated in the protein group. The remaining answers included answers such as energy drinks, nuts and coffee, but their frequency were low.
Table 2. Distribution of age, BMI, training features, hydration and nutrition status, nutrition & health relationship, and NKLSA
score according to gender, and BMI classification
Variables Gender BMI (Body Mass Index)
Female (n=84) Male (n=43) F p UW (n=4) NW (n=116) PW (n=7) F p Age 20.69 ± 3.82 20.25 ± 4.77 45.078 0.000** 20.00 ± 3.65 20.69 ± 4.24 18.28 ± 1.97 1.153 0.319 BMI 21.06 ± 1.87 22.35 ± 2.35 18.196 0.000** 18.02 ± 0.68 21.30 ± 1.64 26.74 ± 1.54 46.476 0.000** Training hour 2.21 ± 0.69 1.94 ± 0.35 1.526 0.218 1.62 ± 048 2.16 ± 0.61 1.64 ± 0.38 3.914 0.022* Hydration BT 1.86 ± 4.50 0.95 ± 0.47 9.209 0.003* 0.75 ± 0.29 0.97 ± 0.45 1.03 ± 051 0.542 0.583 Hydration T 1.17 ± 0.47 0.91 ± 0.42 32.743 0.000** 1.12 ± 0.48 1.08 ± 048 1.00 ± 2.89 0.129 0.879 Hydration AT 0.92 ± 0.41 1.03 ± 0.47 2.455 0.118 0.87 ± 0.25 0.96 ± 043 0.93 ± 0.53 0.092 0.912 Daily liquid 3.32 ± 1.17 3.58 ± 1.30 0.368 0.545 2.62 ± 0.94 3.44 ± 1.20 3.35 ± 1.65 0.864 0.424 Daily water 2.65 ± 1.12 2.71 ± 1.07 11.159 0.001* 1.87 ± 0.85 2.71 ± 1.11 2.46 ± 0.91 1.254 0.289 Nutri-tion-Health 8.58 ± 1.53 8.28 ± 1.98 2.037 0.156 7.50 ± 1.91 8.50 ± 1.67 8.57 ± 199 0.692 0.502 Total scale 50.16 ± 6.36 50.00 ± 5.57 0.625 0.430 51.25 ± 10.99 50.11 ± 5.99 49.43 ± 5.38 0.112 0.894 *p < 0.05, **p < 0.001
BMI: body mass index, BT: before training, T: during training, AT: after training, UW: underweight, NW: normal weight and, PW: pre-obese.
Table 3. Nutrients that mostly eaten training related according to gender and BMI
Gender BMI (Body Mass Index) Female (n=84) Male (n=43) χ2 P UW (n=4) NW (n=116) (n=7)PW χ2 p BT 45.2%
CHO 55.8%CHO 10.328 0.243 Nothing25%
50% CHO 42.9% CHO 29.207 0.023* T 85.7% Water 90.7% Water 1.733 0.630 100% Water 86.2% Water Water100% 1.736 0.942 AT 41.7%
CHO + protein 32.6%CHO 33.844 0.000** Protein50%
31.9% Protein 57.1% CHO + protein 51.027 0.000** *p < 0.05, **p < 0.001
BT: before training, T: during training, AT: after training, UW: underweight, NW: normal weight and PW: pre-obese, CHO: Carbohydrate.
Before trainings most of the participants had CHO based nutrition. Evaluating by gender, it was found that females and males ate CHO but females have more protein than males (p < 0.000) after trainings. By BMI groups, it is stated that pre-obese group had more carbohydrate and protein than other groups
(p < 0.001). All gender and BMI groups found mostly drink just water during trainings.
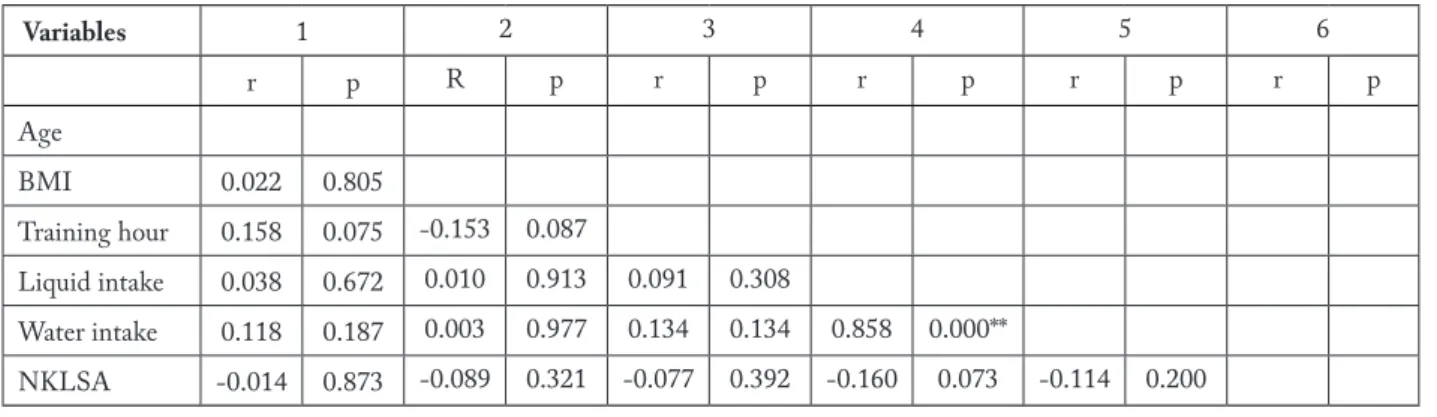
There was only one significant correlation between water intake and liquid intake daily (p < 0.001). Both training hour and NKLSA scores were negatively but not significantly correlated with body mass index (p > 0.05).
Table 4. Correlations between age, BMI, training hour, daily liquid and water consumption, and NKLSA scores Variables 1 2 3 4 5 6 r p R p r p r p r p r p Age BMI 0.022 0.805 Training hour 0.158 0.075 -0.153 0.087 Liquid intake 0.038 0.672 0.010 0.913 0.091 0.308 Water intake 0.118 0.187 0.003 0.977 0.134 0.134 0.858 0.000** NKLSA -0.014 0.873 -0.089 0.321 -0.077 0.392 -0.160 0.073 -0.114 0.200 **p < 0.001 Discussion
Present study was aimed to determine relation-ships between gender, body mass index, hydration status and nutritional knowledge of football, volley-ball, basketball and handball players that studying and training in the sports department. Literature compari-sons were discussed below.
Original form of NKLSA was published by Bat-maz (2018), it was found NKLSA scores as min 35, max 76 and mean 53 ± 8.1, and in our study it was 30, 65 and 50.11 ± 6.09, respectively. In that study, NKL-SA scores were divided into four group, too. Batmaz (2018) studied with 51% females, and couldn’t find any differences between BMI by gender (p > 0.05). In this study, males had higher BMI values (p < 0.05).
Nutrition education is crucial for life-long eating and hydration habits especially for athletes and sports performance. In a study, it was found that 48.1% of participants had a nutritional education, and 27% from TV or radio, 18% from newspaper or magazine, 17% from dietitian. In the same study, 68.3% of participants said that they want to have a nutritional education, and most of them asked for the topic about weight loss (31). Devlin and Belski (2015) found that 98% of athletic population obtained their nutritional informa-tion from dietitians, and it was a good percentage. In a study that conducted in Brazil, it is reported that most of the table tennis players use had nutritional informa-tion from their families Argôlo et al. (2018). Abbey et al. (2017) stated that only 11.5% of their participants
had a nutrition course and their mean knowledge score were higher. Hull et al. (2016) showed less percent-age as 39.7% of their participants used non-dietitian sources. Additionally, Blennerhassett et al. (2019) stat-ed that 96% of ultra-endurance athletes had never re-ceived a nutritional education. In our study, we found mostly educated from lessons or courses during col-lege education and although some of the participants responded not being educated, from whom educated response increased. It can be said that the first two re-sult were not showing education; it is just nutritional information. Most of the participants said they want to have an education about nutrition, mostly based on sports nutrition, and females (63.6%) want more sports nutrition education than males (p < 0.05).
Batmaz (2018) stated that there was no significant difference between educated and non-educated, diet-ing and non-dietdiet-ing individuals’ mean NKLSA scores. In our study, females (76.2%) and males (81.4%) were not on a diet, and there was a similar result about scores but not shown in tables. In a study, similar to our study, it was reported that 79% of participants were on a diet and most of them for weight loss (31).
Nutrition Knowledge Level Survey for Adults (NKLSA) scores divided into four categories as poor, moderate, good, and very good knowledge. Other questionnaires used in different studies, Devlin and Belski (2015) implied that nutritional knowledge of athletic population was low as in other studies found (17, 23 27, 28). They found that more than 50% of the participants gave right answers to nutrients
questionnaires but it was not enough for performance. Folasire et al. (2015) stated that more than half of their participants had good nutritional scores. Alau-nyte et al. (2015) found that athletes who have poor nutritional knowledge had higher liquid and water consumption. Magee et al. (2017) studied with 409 athletes and found that overall nutritional knowl-edge of the participants was poor. Condo et al. (2019) showed that Australian football players did not have high nutritional knowledge as it is mentioned in other studies. Similar to previous studies we could not even detect any ‘very good’ answer group, and most of the participants (62.5%) had a moderate score on NKL-SA. Batmaz (2018) found significant difference be-tween NKLSA scores of males (55.1±7.9) and females (50.9 ± 7.9) (p=0.008). Spronk et al. (2015), Zaboro-wicz et al. (2016) and Citarella et al. (2019) stated a significant difference between gender and found as females have more high scores (p < 0.05). In our study we couldn’t find any difference between gender. Similar to this study, Şanlıer et al. (2009) and Batmaz (2018) found no significant difference between BMI groups for NKLSA scores. We found UW group had higher NKLSA scores than the other BMI classes but it was not statistically significant. Folasire et al. (2015) couldn’t find any correlation between nutri-tional knowledge and body weight. In our study, train-ing hour and NKLSA scores were not significantly but negatively in a correlation with BMI. It shows us that when BMI increases training hours and NKLSA scores may decrease. Not being statistically significant may be due to the small numbers of participants and not having high body mass index values.
Magee et al. (2017), Argôlo et al. (2018) and Blennerhassett et al. (2019) found in their studies that training sessions of participants was ranging between 1 and 2 hours. In the present study, we found similar training hours, additionally training hours were sig-nificantly higher in normal weight group. This may be because individuals who are at normal weight can per-form better. Of course, there are no very low or high weighted participants, however, there is still a differ-ence in their daily training hour (p < 0.001).
Dehydration of > 2% body weight loss impairs performance significantly (21). Athletes can remain dehydrated during trainings because of not wanting
to waste their precious time for drinking or lack of important knowledge of drinking liquid. Salici et al. (2019) didn’t state any difference between liquid con-sumption during trainings (p > 0.05). Hull et al. (2016) found that males drink more juice during the week than women (p=0.001). Devlin and Belski (2015) found that hydration knowledge of their participants was good. In this study, it is found that females drink more water before and during training than males, but, in a total day males drinking more water than females (p < 0.05). All gender and BMI groups found mostly drink just water during trainings. Nascimento et al. (2016) stated their participants had 400-575 ml of wa-ter during trainings. Hydration of athletes is crucial for performance and drinking water or liquid before or during training can be difficult for them because of the volume it creates in the stomach.
Hull et al. (2016) stated in their post-workout nu-trition results, males were more likely to consume car-bohydrate based (rice or pasta) than females. Condo et al. (2019) reported CHO intake was minimum espe-cially on training days of football players. In this study, females have more protein than males after trainings, pre-obese group had more carbohydrate and protein than other BMI groups (p < 0.05). After intense physi-cal activity, carbohydrate and protein should be taken together for muscle regeneration and for our energy system. Nutritional deficits and poor eating habits in sports may contribute to injuries (7). In this present study, it is reported that before trainings most of the participants had CHO, and it was proper for physi-cal performance. There is a need about tools improve-ments to assess athlete’s awareness about carbohydrate recommendations (26), and of course types of carbo-hydrates that should be eaten before and after train-ings or matches.
Without guidance from scientific recommenda-tions, dietary habits can be detrimental, it may be re-sulted in unfavorable changes in body composition and performance problems (20). Spendlove et al. (2012), have reported nutrition knowledge in elite athletes is very important for their daily life and performance. Individuals who have high nutritional information are almost 25 times more likely to meet recommendations and have a healthier diet, as a naturally healthy and quality life (4, 25, 28).
Conclusion
There is a gap about nutritional knowledge of ath-letes and players in literature, that is why there is a need for more detection and intervention for eating and lifestyle habits especially supported with educa-tions. Nutrition educations and courses that are given in the university period make adulthood life much more qualified and for athletes it is much more impor-tant. Good and practicable knowledge of nutrients will improve sports performance.
Conflict of interests: The authors declared no conflict of interests
regarding the publication of this manuscript
References
1. Holway FE, Spriet LL. Sport-specific nutrition: practi-cal strategies for team sports. Journal of sports sciences 2011; 29(sup1), 115-S125.
2. Folasire OF, Akomolafe AA, Sanusi RA. Does nutrition knowledge and practice of athletes translate to enhanced athletic performance? Cross-sectional study amongst nige-rian undergraduate athletes. Global journal of health science 2015; 7(5), 215.
3. Blennerhassett C, McNaughton LR, Sparks SA. Factors in-fluencing ultra-endurance athletes food choices: an adapted food choice questionnaire. Research in Sports Medicine 2019; 27(2), 257–271.
4. Wardle J, Parmenter K, Waller J. Nutrition knowledge and food intake. Appetite 2000; 34(3), 269–275.
5. Kreider RB, Wilborn CD, Taylor L, Campbell B, Almada AL, Collins R, Kerksick CM. ISSN exercise & sport nu-trition review: research & recommendations. Journal of the international society of sports nutrition 2010; 7(1), 7. 6. Capling L, Beck KL, Gifford JA, Slater G, Flood VM,
O’Connor H. Validity of dietary assessment in athletes: A systematic review. Nutrients 2017; 9(12), 1313.
7. Argôlo D, Borges J, Cavalcante A, Silva G, Maia S, Ramos A, Oliveira E, Nascimento MV. Poor dietary intake and low nutritional knowledge in adolescent and adult competitive athletes: a warning to table tennis players. Nutrición hospi-talaria: Organo oficial de la Sociedad española de nutrición parenteral y enteral 2018; 35(5), 1124–1130.
8. Nascimento M, Silva D, Ribeiro S, Nunes M, Almeida M, Mendes-Netto R. Effect of a nutritional intervention in athlete’s body composition, eating behaviour and nutritional knowledge: A comparison between adults and adolescents. Nutrients 2016; 8(9), 535.
9. Spronk I, Heaney SE, Prvan T, O’Connor HT. Relationship between general nutrition knowledge and dietary quality in
elite athletes. International journal of sport nutrition and exercise metabolism 2015; 25(3), 243–251.
10. Salici O, Akkaya B, Ertürk H, Orhan H. Adölesan dönemi voleybolcularin beslenme alişkanliklarinin müsabaka per-formansina etkilerinin incelenmesi: Isparta Örneği. SDÜ Sağlık Bilimleri Dergisi 2019; 10(3), 249–255.
11. Anderson L, Orme P, Di Michele R, Close GL, Morgans R, Drust B, Morton JP. Quantification of training load during one-, two-and three-game week schedules in professional soccer players from the English Premier League: impli-cations for carbohydrate periodisation. Journal of sports sciences 2016; 34(13), 1250–1259.
12. Alaunyte I, Perry JL, Aubrey T. Nutritional knowledge and eating habits of professional rugby league players: does knowledge translate into practice? Journal of the Interna-tional Society of Sports Nutrition 2015; 12(1), 18. 13. Trakman GL, Forsyth A, Devlin BL, Belski R. A
system-atic review of athletes’ and coaches’ nutrition knowledge and reflections on the quality of current nutrition knowledge measures. Nutrients 2016; 8(9), 570.
14. Burke LM, Read RS. A study of dietary patterns of elite Australian football players. Canadian journal of sport sci-ences 1988;13(1), 15–19.
15. Abbey EL, Wright CJ, Kirkpatrick CM. Nutrition practices and knowledge among NCAA Division III football play-ers. Journal of the International Society of Sports Nutrition 2017; 14(1), 13.
16. Thomas DT, Erdman KA, Burke LM. Position of the acad-emy of nutrition and dietetics, dietitians of canada, and the american college of sports medicine: nutrition and athletic performance. Journal of the Academy of Nutrition and Dietetics 2016; 116(3), 501–528.
17. Hamilton G, Thomson C, Hopkins W. Nutrition knowl-edge of elite distance runners. Journal of Sport Nutrition 1994; 22(2), 26–29.
18. Devlin BL, Leveritt MD, Kingsley M, Belski R. Dietary in-take, body composition, and nutrition knowledge of Austral-ian football and soccer players: Implications for sports nutri-tion professionals in practice. Internanutri-tional journal of sport nutrition and exercise metabolism 2017; 27(2), 130–138. 19. MacKenzie K, Slater G, King N, Byrne N. The
measure-ment and interpretation of dietary protein distribution dur-ing a rugby preseason. International journal of sport nutri-tion and exercise metabolism 2015; 25(4), 353–358. 20. Hull MV, Jagim AR, Oliver JM, Greenwood M, Busteed DR,
Jones MT. Gender differences and access to a sports dietitian influence dietary habits of collegiate athletes. Journal of the International Society of Sports Nutrition 2016; 13(1), 38. 21. Magee PJ, Gallagher AM, McCormack JM. High
preva-lence of dehydration and inadequate nutritional knowledge among university and club level athletes. International jour-nal of sport nutrition and exercise metabolism 2017; 27(2), 158–168.
22. Zaborowicz K, Czarnocinska J, Galinski G, Kazmierc-zak P, Górska K, Durczewski P. Evaluation of selected dietary behaviours of students according to gender and
nutritional knowledge. Roczniki państwowego zakładu higieny 2016; 67(1), 45–50.
23. Dunn D, Turner LW, Denny G. Nutrition knowledge and attitudes of college athletes. The Sport Journal 2007; 10(4), 45–52 .
24. Condo D, Lohman R, Kelly M, Carr A. Nutritional intake, sports nutrition knowledge and energy availability in female Australian Rules Football Players. Nutrients 2019; 11(5), 971.
25. Heaney S, O’Connor H, Michael S, Gifford J, Naughton G. Nutrition knowledge in athletes: a systematic review. Inter-national journal of sport nutrition and exercise metabolism 2011; 21(3), 248–261.
26. Devlin BL, Belski R. Exploring general and sports nutrition and food knowledge in elite male Australian athletes. Inter-national journal of sport nutrition and exercise metabolism 2015; 25(3), 225–232.
27. Harrison J, Hopkins W, MacFarlane D, Worsley A. Nu-trition knowledge and dietary habits of elite and non-elite athletes. Australian Journal of Nutrition and Dietetics 1991; 48(4), 124–127.
28. Spendlove JK, Heaney SE, Gifford JA, Prvan T, Denyer GS, O’Connor HT. Evaluation of general nutrition knowledge
in elite Australian athletes. The British Journal of Nutrition 2012; 107(12), 1871–1880.
29. Citarella R, Itani L, Intini V, Zucchinali G, Scevaroli S, Kreidieh D, Tannir H, El Masri D, El Ghoch M. Nutri-tional knowledge and dietary practice in elite 24-hour ultra-marathon runners: a brief report. Sports 2019; 7(2), 44. 30. Şanlıer N, Konaklıoğlu E, Güçer E. Gençlerin beslenme
bilgi, alişkanlik ve davranişlari ile beden kütle indeksleri ar-asindaki ilişki, Gazi Eğitim Fakültesi Dergisi 2009; 29(2), 333–52.
31. Batmaz H. Yetişkinler için beslenme bilgi düzeyi ölçeği geliştirilmesi ve geçerlik-güvenirlik çalışması. Marmara Üniversitesi Sağlık Bilimleri Enstitüsü, Beslenme ve Diye-tetik Anabilim Dalı 2018; Doctoral dissertation, İstanbul). 32. World Health Organization (WHO). BMI classification.
Access: (http://appswhoint/ bmi/ indexjsp?introPage=intro_ 3html). Access date: 28/12/2019.
*Corresponding Author:
Erkut TUTKUN , Faculty of Sport Science, Bursa Uludağ University, Bursa,Turkey