Contents lists available atScienceDirect
Neurotoxicology
journal homepage:www.elsevier.com/locate/neuro
Full Length Article
The impact of frying aerosol on human brain activity
Motahareh Naseri
a, Mojtaba Jouzizadeh
b, Mahsa Tabesh
b, Milad Malekipirbazari
c,
Raikhangul Gabdrashova
a,d, Sholpan Nurzhan
a,d, Hamta Farrokhi
b, Reza Khanbabaie
b,
Hossein Mehri-Dehnavi
b, Zhibek Bekezhankyzy
a,e, Aidana Gimnkhan
a,e, Maryam Dareini
a,
Akbota Kurmangaliyeva
a,d, Nazia Islam
a,d, Byron Crape
f, Giorgio Buonanno
g, Flemming Cassee
h,
Mehdi Amouei Torkmahalleh
a,i,⁎aChemical and Aerosol Research Team, School of Engineering, Nazarbayev University, Nur-Sultan 010000, Kazakhstan bDepartment of Physics, Babol Noshirvani University of Technology, Shariati Ave., Babol, 47148-71167, Iran cDepartment of Industrial Engineering, Bilkent University, 06800 Bilkent, Ankara, Turkey
dDepartment of Biology, School of Engineering, Nazarbayev University, Nur-Sultan 010000, Kazakhstan eDepartment of Chemistry, School of Engineering, Nazarbayev University, Nur-Sultan 010000, Kazakhstan fDepartment of Medicine, School of Medicine, Nazarbayev University, Nur-Sultan 010000, Kazakhstan
gDepartment of Civil and Mechanical Engineering, University of Cassino and Southern Lazio, via Di Biasio 43, Cassino 03043, Italy hNational Institute for Public Health and the Environment, Bilthoven, The Netherlands
iThe Environment and Resource Efficiency Cluster, Nazarbayev University, Nur-Sultan 010000, Kazakhstan
A R T I C L E I N F O Keywords: Brain EEG Frying Ultrafine particles Translocation Neurodegenerative disease A B S T R A C T
Knowledge on the impact of the exposure to indoor ultrafine particles (UFPs) on the human brain is restricted. Twelve non-atopic, non-smoking, and healthy adults (10 female and 7 male, in average 22 years old) were monitored for brain physiological responses via electroencephalographs (EEGs) during cooking. Frying ground beef meat in sunflower oil using electric stove without ventilation was conducted. UFPs, particulate matter (PM) (PM1, PM2.5, PM4, PM10), CO2, indoor temperature, RH, oil and meat temperatures were monitored continuously throughout the experiments. The UFP peak concentration was recorded to be approximately 2.0 × 10⁵particles/ cm3. EEGs were recorded before exposure, at end of cooking when PM peak concentrations were observed, and 30 min after the end of the cooking session (post-exposure). Brain electrical activity statistically significantly changed during post-exposure compared to the before exposure, suggesting the translocation of UFPs to the brain, occurring solely in the frontal and temporal lobes of the brain. Study participants older than 25 were more susceptible to UFPs compared to those younger than 25. Also, the brain abnormality was mainly driven by male rather than female study participants. The brain slow-wave band (delta) decreased while the fast-wave band (Beta3) increased similar to the pattern found in the literature for the exposure to smoking fumes and diesel exhaust.
1. Introduction
Exposure to indoor aerosol is important since the vast majority of people spend most of their time indoors (Wallace et al., 2004). Indoor particulate matter (PM) sources are typically short-term events that can produce high ultrafine particles (UFPs) (particles less than 100 nm aerodynamic diameter) concentrations (Long et al., 2000) such as burning candles and cooking.
The cooking emission in residential or commercial kitchens is one of the main indoor PM sources that results in human exposure to high concentrations of ultrafine particles (Abdullahi et al., 2013; Amouei
Torkmahalleh et al., 2017a). Exposure to cooking PM was found to be almost one order of magnitude higher than the exposure to PM from most other everyday activities (Wallace and Howard-Reed, 2002; Wallace and Ott, 2010).He et al. (2004)investigated PM2.5and ultra-fine particle (7 nm to 808 nm) emission rates in 15 houses in Australia while performing 20 indoor activities such as cooking (frying, grilling, toasting, microwaving, oven use, kettle), smoking, sweeping floor, va-cuuming, candle burning and hair drying. They found cooking as the largest source of indoor air pollution with the highest level of PM2.5 (2.78 ± 17.8 mg.min−1).Wallace and Ott (2010)conducted a 3-year study in a variety of indoor environments in the United States including
https://doi.org/10.1016/j.neuro.2019.06.008
Received 23 April 2019; Received in revised form 14 June 2019; Accepted 24 June 2019
⁎Corresponding author at: Chemical and Aerosol Research Team, School of Engineering, Nazarbayev University, Nur-Sultan 010000, Kazakhstan. E-mail address:[email protected](M. Amouei Torkmahalleh).
Available online 26 June 2019
0161-813X/ © 2019 Elsevier B.V. All rights reserved.
two occupied homes, one test home, two cars as well as 22 restaurants. They found that cooking using gas or electric stoves and toaster ovens were among the major sources of UFP exposure with peak concentra-tions up to more than 100,000 particles/cm3. Among different cooking activities, such as boiling, stewing, oven cooking, microwaving, toasting, sautéing, grilling, charbroiling, and frying, the highest particle emission was registered to frying (McDonald et al., 2003;Nasir et al., 2013;See and Balasubramanian, 2008,2006;He et al., 2004).
Several factors including cooking additives (Amouei Torkmahalleh et al., 2013,2017b;2017d), meat (Amouei Torkmahalleh et al., 2017c; Gorjinezhad et al., 2017), cooking oil and cooking temperature (Amouei Torkmahalleh et al., 2012; Gao et al., 2013a, b; Buonanno et al., 2009), and cooking pan (Amouei Torkmahalleh et al., 2018; Wallace et al., 2014) contributed to the UFP and PM productions.
The particle mode diameter values (the diameter representing the highest particle concentration) during cooking were reviewed by Abdullahi et al. (2013)and reported to be between 20–100 nm. It was found that heating an electric stove itself without any cooking materials such as (pan, food, oils and additives) could be a source of UFPs smaller than 10 nm with the peak diameter around 6 nm (Wallace et al., 2008). Additionally, a very high particle number concentration (in the order of 106 particles/cm3) close to the cooking source is expected (Amouei Torkmahalleh et al., 2017a). Therefore, cooking in pans produces large concentrations of small particles offering higher surface areas which could in turn increase the risk of particle toxicity.
Several studies conducted in the literature addressing the translo-cation of different types of aerosol particles including gold, C-13, po-liovirus, and manganese oxide to the nervous system (Nel et al., 2006; Stone et al., 2017). It is suggested in the literature that one of the routes through which UFPs can reach the brain is the nasopharyngeal region (Elder et al., 2006). The particles are deposited on olfactory mucosa of the nasal region where they translocate by axonal transport along the olfactory nerve into the olfactory bulb which is a part of the brain in-volved in the sense of smell. From there, the particles have access to the brain tissue and the central nervous system (CNS), respectively (Lucchini et al., 2012). Another potential pathway through which the particles can reach the brain is the tracheobronchial and alveolar region where the inhalation into lungs is followed by the diffusion of particles into the blood circulation and further flowing into the brain. In this route, depending on the size, charge, chemistry, etc of the nano-particles, they can pass the Blood-Brain Barrier (BBB) and reach the brain (Calderón-Garcidueñas et al., 2007).
Electroencephalograph (EEG) is a device that detects and records the electrical brain activity generated by the cortex. EEG measures the brain’s voltage fluctuations in the neuron system of the brain resulted from an ionic current. EEG includes an electrode board with a set of separate channels that are connected to the electrodes placed on the scalp surface. Through these electrodes the electrical signals are re-ceived. The EEG method has been widely utilized to better understand brain related disease by comparing EEG signals of patients to those of healthy subjects. For example, Parkinson’s and Alzheimer's patients showed significant changes in the brain theta band compared to healthy control groups (Stevens et al., 2001, Prichep et al., 2006, andSoikkeli R et al., 1991).
To our knowledge, no peer-reviewed published study has previously examined the associated of short-term exposures to general indoor PM and cooking PM with measured activity in the human brain.
The main objective of this study was to investigate brain wave pattern changes associated with exposure to cooking aerosols for 12 healthy adults, using EEG. Previous exposure studies have identified factors in reducing the exposure to cooking UFPs and PM (Amouei Torkmahalleh et al., 2017a). However, no investigation exists in the literature to investigate if such reductions in exposure to the cooking UFPs and PM are sufficient to reduce its potential impact on human health. Although not yet fully understood if there is a link between exposure to cooking particles and brain diseases such as Alzheimer and
Parkinson, the present study might provide new insight for future re-search for diagnosis of UFP-related brain disorders.
2. Materials and methods
2.1. Study participants
Seventeen (10 female and 7 male, in average 22 years old) non-atopic, non-smoking, physically and mentally healthy adults residing in Babol city, Iran were invited to the cooking experiments with no re-muneration or benefits offered. The selected study participants were students and faculty. The physical and mental health conditions of the participants were evaluated using a questionnaire. The weight of the participants ranged from 42 to 83 and the average BMI of the partici-pants was 22.66. Thus, no overweighed participant was selected as such participants have low grade inflammation and altered cognition (Lasselin et al., 2016). The health condition of the study participants were evaluated using a questionnaire asking the following matter: To-bacco consumption (cigarettes, electronic cigarettes, shisha, etc), drug consumption, any medical pills, neurological discomfort associated with the nervous system, level of stress in life, pulmonary sensitivity or pulmonary disease (cough, asthma, lung disease, swelling, etc). As a result, 17 sets of experimental data were obtained from the exposure assessment study. However, among the 17 study participants, 12 of them (seven female participants with the average age and BMI of 25 and 21.3, respectively, and 5 male participants with the average age and BMI of 33 and 19.92, respectively.
Six participants older than 18 years and younger than 25 and six participants older than 25 years) whose average age was 22 were se-lected for further analyses of EEG measurements. Before providing written consent, all study participants were given information about the objectives of the study, cooking recipe, and the instruments used during the study. The study participants were given a questionnaire to learn about their cooking habit (gas vs. electric stove). They were asked to have sufficient rest before the test particularly before the experiments conducted in the morning. To eliminate the effects of stress on the brain activities, the study participants attended the experiments on a day that they had no stress and anxiety, and took no medications or exams. This study did not increase study participant exposure to cooking aerosols beyond their normal cooking activities. The study participants were tasked to frying ground beef on an electric stove in an experimentally controlled house setting, of which they consumed as a replacement for one of their regular meals which required cooking.
2.2. Experimental design
During the controlled experimental study, all windows and doors were closed to eliminate the transport of outdoor contamination into the experimentally-controlled houses. However, indows and doors were left open between experiments to reduce indoor particle concentrations to background concentrations. Four size fractions of PM mass con-centrations (PM1, PM2.5, PM4, PM10, and total PM), UFP number con-centrations, meat temperature, oil temperature, indoor temperature, and relative humidity (RH) were recorded continuously before the cooking (background), during cooking and after cooking. The sampling port of the PM instrument was located approximately at the breathing zone of the participants to assess their exposure. New and clean gloves were used to prepare the cooking materials before each experiment to assure hygienic conditions. Typically, three persons, including a re-search participant, were present during the experiments. The EEG brain activity was monitored at three steps during the experiments with participants’ eyes closed. The experiments were initiated at time of arrival to the test house, with EEG measurements taken 20 min before cooking (step 1), at the end of cooking (step 2) which corresponds to maximum particulate concentrations, and 30 min after the termination of cooking (post-cooking or step 3)- during the period when particulate
matter is decaying and background conditions are returning. During EEG tests, study participants were seated on a chair and remain still to replicate resting. The duration of each EEG test was five minutes. In the periods between EEG measurements, study participants were resting and in an upright position. All electrical appliances were unplugged and operated on battery power to prevent interference with EEG measure-ments.
Heart rate (HR), systolic blood pressure (SBP) and diastolic blood pressure (DBP) were measured after each of the three EEG tests. Measurements were taken according to criteria provided in the docu-ment “Recommendations for Blood Pressure Measuredocu-ment in Humans and Experimental Animals proposed by American Heart Association Council on High Blood Pressure Research” (Pickering et al., 2005).
Low-fat ground beef meat was purchased for the experiments to reduce overall cooking emissions as higher fat contributes to particle production (Amouei Torkmahalleh et al., 2017d). The experiments were conducted in a one-bedroom apartment which included a kitchen equipped with an electric stove. The kitchen’s dimension was 21.77 m3 with a height of 275 cm, length of 355 cm and width of 223 cm. No mechanical ventilation was operated while cooking. One hundred grams of the meat was mixed with 20 g of shredded onions, one gram of salt, one gram of pepper, and one gram of turmeric. The seasoned meat was then divided into three 40 g pieces of rounded meat (pan-kebabs) in preparation for the experiments. A PTFE-coated aluminum pan that was 25 cm in diameter was heated in an electric stove at a medium heat setting. After heating the empty pan for two minutes, 21 mL sunflower oil was poured into the pan. After eight minutes of the start of the experiment (six minutes after the addition of the oil), the three pieces of kebab were placed into the pan. At minutes 11, 14 and 17, the pan-kebabs were turned over with a wooden spatula. The stove was swit-ched off after 20 min and at minute 25 the window was open. Sampling continued until the concentration reached background (at minute 50). Figure S1 shows the test house where the experiments were conducted. 2.3. Exposure assessment
A TSI (St. Paul, MN, USA) IAQ Model 7545 instrument was used to measure CO2concentration, indoor temperature, and humidity. A TSI DustTrak DRX Model 8533 was used to simultaneously monitor PM1, PM2.5, PM4, and PM10. The DustTrak's logging interval was one second. A TSI condensation particle counter (CPC) Model 3007, capable of measuring particle number concentrations down to 10 nm (105 parti-cles/cm3), was employed with a logging interval of one second. The CPC 3007 counts the particles up to 3 × 10⁴-4 × 10⁴ particles/cm3. However, the accuracy of the counter decreases beyond 1 × 10⁴ par-ticles/cm3, requiring a correction. An Aerasense (Netherlands) NanoTracer capable of quantifying particle number concentrations up to 106 particles/cm3 for UFPs down to 10 nm was utilized. The NanoTracer provides the average particle diameter and estimates the particle surface area concentration based on a user-defined particle density. In this study we assumed the particle density to be 1 gm/cm3. A digital thermometer (Model 54IIB, Fluke, Everett, USA) was employed to measure the temperature of the oil and the temperature of the meat at its surface during cooking. The thermometer is capable of measuring temperatures in the range of −200 to 1372 °C using a K type probe. A K type probe (THS-103–020, ThermoWorks, USA) was employed in this study. All instruments were operated in close proximity to the stove to measure the exposures to the study participants while they were cooking, except for the NanoTracer which was placed in the living room where study participants stayed during the post-cooking period. 2.4. Physiological responses
The brain electrical waves were recorded using quantitative elec-troencephalography (QEEG) (Brain Master Discovery 24 amplifier) at different sites of the scalp. An electro-cap (eci) fitted with 19 scalp
electrodes (Fp1, Fp2, F3, F4,C3, C4, P3, P4, O1, O2, F7, F8, T3, T4, T5, T6, Fz, Cz, and Pz) was placed on the head according to the 10–20 international systems. Two electrodes were placed at the left and right ears as a linked-ear reference (Rotondi et al., 2016). The EEG mea-surements were taken at 256 Hz. The online filter with 0.1–40 Hz band pass filter was applied. Five minutes resting-state EEGs with study participants’ eyes closed were recorded during the three steps (before cooking, at the immediate end of cooking and after cooking). The Neuro-guide® software was used for pre-processing. The visual selection was first utilized by an expert to avoid eye blinking, muscle and cardiac artifacts and then, the automatic artifact rejection algorithm based on z-scores was applied. Thirty four seconds of artifact free signals were reserved for each step to compute the relative power of the signals. The EEG data were processed offline by Neuroguide software for six fre-quency bands including Delta (1–3.5 Hz), Theta (4.5–7 Hz), Alpha (7.5–12 Hz), Beta1 (12–15 Hz), Beta2 (15–17.5 Hz), and Beta3 (18–25 Hz). Then, we considered the percentage of a given power in any band relative to the total power as relative power (RP). The brain is divided into several lobes including frontal (right and left), temporal (right and left), central, parietal and occipital. Each lobe is represented by several electrodes, and the average of the RP of these electrodes was recorded as the average RP over the given lobe. Electrodes F4, F8 and Fp2, electrodes F3, F7, Fp1, electrodes T4, T6, electrodes, T3, T5, electrodes C3, C4, Cz, electrodes P3,P4,Pz, and electrodes O1,O2 re-presented right frontal, left frontal, right temporal, left temporal, cen-tral, parietal, and occipital lobes, respectively.
Blood pressures and heart rates were monitored using a 10 series blood pressure monitor Model BP786 N (Omron, USA). This digital blood pressure monitor is capable of recording systolic blood pressure (SBP), diastolic blood pressure (DBP) and heart rate (HR).
2.5. Data analysis
The Friedman test was utilized in our study given that data for the relative power (RP) values of the brain was not normally distributed The Friedman test is a non-parametric statistical tool employed to measure the same characteristic on each subject at different time or under several different conditions (Friedman, 1937).
If the Friedman test showed statistically significant differences, we run a post hoc test which indicates which means are different. In our experiments, we employed the Wilcoxon Test as our post-hoc test (Wilcoxon, 1945).
Since Dusttrak DRX employs a laser scattering method, the esti-mated PM concentrations by this instrument need to be corrected using a correction factor (CF) obtained through the gravimetric mass mea-surements. In this study, the CF value of 0.7 for frying the ground beef was obtained fromDacunto et al. (2013).
Hameri et al. (2002)studied the particle detection efficiency for the CPC TSI model 3007. It was reported that a correction needs to be made to CPC measurements for the concentration range of 105 – 4 × 10⁵ particles/cm3. Equation 1 presents the correction. This correction was applied to all CPC measurements higher than 105particles/cm3in this study.
y = 6 × 10−19x4– 10-12x3- 4 × 10-8x2+ 0.9 x + 9660.1 1 where x is the CPC measured concentration above 105particles/cm3, and y is the corrected concentration (particles/cm3).
3. Results
3.1. Exposure assessment
Fig. 1presents the average oil temperature variations with time during the frying of the beef pan-kebabs. Time zero inFig. 1 corre-sponds to the moment that the pan was placed on the stove and the
stove was switched on. When the oil was poured into the pan, the temperature of the oil reached 70 °C quickly because the pan was al-ready heated for two minutes. The temperature of the oil increased steadily with two different rates. During the first seven minutes of the experiments, the temperature of the oil increased approximately from 70 °C to 140 °C. At minute 8, the three pieces of pan-kebabs were placed into the pan. They were already taken out from the fridge and kept at room temperature during the experiments until frying at minute 8. Placing the pan-kebabs on the pan produced a slight drop in the oil temperature and altered the rate of the temperature rise. The oil tem-perature increased to approximately 157 °C at minute 20 when the stove was switched off. Then, the oil temperature dropped to almost 70 °C within 10 min. The oil temperature variations were reproduced with a small standard deviation during the 17 experiments, suggesting that there was very limited variability in the heating system of the stove and it consistently produced reliable and repeatable outputs during all
experiments.
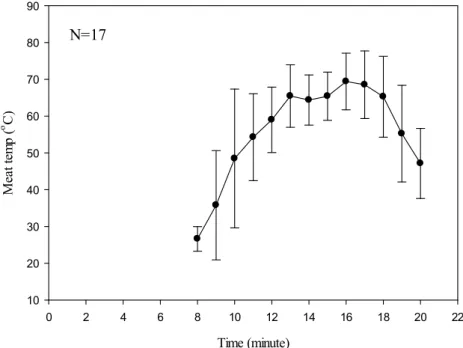
Fig. 2. Meat temperature variations with time during frying pan-kebab using an electric stove
From the time the meat pieces were placed in the pan at minute 8, the meat temperature at its surface increased from 25 °C (room tem-perature) to approximately 52 °C at minute 11, while the oil tempera-ture was almost constant. At minute 11 the meat was turned for the first time. The heating continued until the meat temperature reached ap-proximately 62 °C at minute 14. time and the meat pieces were turned for the second time. Heating continued until the temperature reached approximately 65 °C at minute 17, at which point the meat pieces were flipped for the third time. From minute 17,the temperature was de-creased until it reached approximately 45 °C at minute 20, at which time the stove was switched off. At this time, the meat was well-done and thermal equilibrium was established between the oil and the meat at 69 °C. However, since the room temperature above the pan was only
Fig. 1. Oil temperature variations with time during frying pan-kebab using an electric stove.
Fig. 2. shows the meat temperature changes with time during the frying pan-kebab.
approximately 30 °C from minute 16, then the surface of the meat re-leased heat to the environment. This observation is consistent with the increasing trend observed for the indoor air temperature above the pan from minute 16 to minute 20 (Figure S2), where the meat temperature dropped while the indoor air temperature above the pan continued to increased. The convective heat transfer to the environment decreased the meat temperature to approximately 45 °C within three minutes.
Figure S2 presents the temperature change above the pan at the breathing zone representing the indoor air temperature at that height. It shows that the indoor air temperature above the pan continued to in-crease. The room temperature was recorded to be approximately 27 °C before the start of the experiments at time zero. The indoor air tem-perature underwent three temtem-perature regimes. For the first 8 min be-fore the addition of the meat pieces, the rate of the temperature in-crease was larger as compared to the rate during the period of the meat frying. The air temperature gradually increased during the meat frying until minute 20, at which time the stove was switched off. After this moment the air temperature remained almost unchanged until the end of the experiments, which followed a mild decrease.
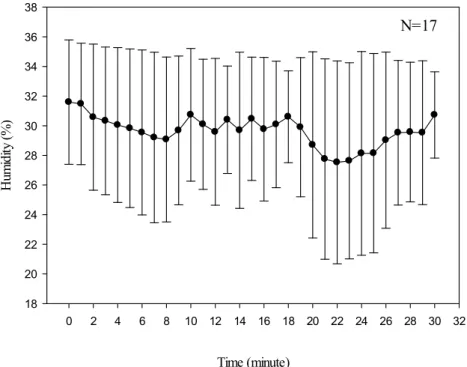
Fig. 3 shows the temporal variations of relative humidity (RH) above the pan at the breathing zone. The RH value at time zero (background) was recorded approximately 32%. The RH decreased continually for the first 8 min of the experiments. At minute 8, the RH was recorded to be 28%. This decrease in RH was likely due to the increased indoor air temperature over this period (Fig. 3). However, at minute 8 when the meat pieces were placed into the pan, the RH slightly increased even as the room temperature continued to increase. This observation could be attributed to the released moisture from the meat at the elevated temperature the water evaporation from the oil itself could contribute to the increased RH and the subsequent fluc-tuations. The RH fluctuated afterward until minute 17 when the meat was turned for the third time. At this time point, the RH was recorded to be approximately 31%. Then, the RH decreased to approximately 27% at minute 22 due to the continuous increase of the indoor air tem-perature. Afterwards, the RH increased towards the end of the experi-ments as the oil cooled down and the room temperature declined.
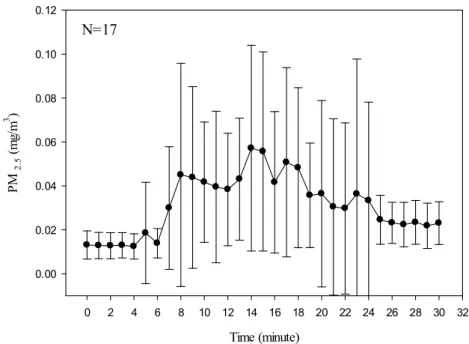
Fig. 4 presents PM2.5 concentration variations with time in the breathing zone. When the empty pan was heated for the first two minutes, no contribution to PM concentration was observed. This
observation is consistent with the findings ofAmouei Torkmahalleh et al. (2018) andWallace et al. (2014). The heated empty pan con-tributes to particle number concentration rather than particle mass concentration (Wallace et al., 2014). The PM concentration remained almost unchanged until the oil temperature reached 140 °C at minute 6. The PM2.5 concentration increased approximately from 0.018 to 0.048 mg/m3between minutes 6 and 8 of the experiments. However, at minute 8 when meat was added to the oil, the PM2.5 concentration dropped. This decreasing trend continued until minute 12 when the PM2.5 concentration reached approximately 0.038 mg/m3. Between minute 8 and minute 12, during which the PM concentration declined, several influential factors for PM concentration changed. These factors include but are not limited to oil temperature, meat temperature, meat water content (which affects indoor RH), and surface area of the oil and meat (Amouei Torkmahalleh et al., 2017a). PM concentration increases with oil and meat temperature. In our experiments, meat temperature increased from minute 8 to minute 12 (Fig. 2) and oil temperature was almost constant (Fig. 1) Thus, an increased PM concentration would be expected rather than the observed decreasing trend (Fig. 1).
Furthermore, bubble burst at the surface of the oil may have oc-curred. When water in oils evaporates it forms bubbles of oil that burst at the oil surface generating many smaller droplets (Dua and Hopke, 1996) that contribute to PM mass concentration. Direct evaporation of the water from the meat surface contributes to PM as well. An increased of RH over this period (Fig. 3) could be due to these phenomena.
Nevertheless, none of the discussed factors support the observed decreasing trend of PM concentration between minute 8 and 12, in the current study. There could be another critical factor prevailing the other factors including oil and meat temperature, water evaporation and bubble bursts. When the three pieces of the meat were added to the oil, the surface area of the oil available for the evaporation of the oil constituents were replaced with the meat surface area. It is critical to understand which component of frying (oil vs. meat) is more influential in particle emission. The data fromBuonanno et al. (2011)andAmouei Torkmahalleh et al. (2017a) show that a heated oil produces more particles compared to heated meat. Thus, a plausible reason for the reduction in PM concentration between minute 8 to minute 12 could be the replacement of oil surface with meat surface. From minute 12 to minute 14, when the meat was turned for the second time, the PM
concentration increased.
In contrast to the first flipping, during the second flipping some oils could be absorbed to the top and bottom surfaces of the meat. Thus, no opportunity would exist for a decline in PM concentrations. Additionally, during this period oil and meat temperatures continued to increase, adding to particle emissions. However, no bubble bursts from the oil or water evaporation from the meat would be expected as the oil and meat temperatures were sufficiently high (between 130 °C to 139 °C and between 52 °C to 62 °C, respectively) such that one could assume no water was left in the oil and meat for bubble bursts and evaporation, respectively. The RH showed no change in this period, confirming this concept.
Finally, during the third flipping (minute 14 to minute 17) and to-wards the end of the experiments (minute 20), the PM2.5concentration continually decreased from approximately 0.055 mg/m3to 0.035 mg/ m3. After 30 min of the experiments, the PM concentration almost reached the background level (0.025 mg/m3). The decay in PM con-centration could be due to the continuous reduction in the amount of oil and its surface area during frying. The oil partly evaporated and partly was absorbed into the meat. The meat surface was well cooked and therefore there was limited opportunity for particle emission from the surface of the meat.
Previous studies showed that frying meat produces particles with concentrations in the order of 105particles/cm3(Zhang et al., 2010; Jorgensen et al., 2013;Yeung and To, 2008;Dennekamp et al., 2001; Amouei Torkmahalleh et al., 2017d).Zhang et al. (2010)conducted a controlled study to understand the influence of stove type on PM2.5and particle number concentrations emitted during frying chicken. Their results showed that while the ventilation was off and the heating level was at medium, frying chicken on an electric stove resulted in particle number and mass concentrations to be 0.35 × 10⁵particles/cm3and 10 μg/m3, respectively. The heating duration was reported to be 28 min (Zhang et al., 2010).Buonanno et al. (2011)obtained 2.8 × 10⁵ par-ticles/cm3 and 2.7 × 10⁴ particles/cm3 particle concentration from frying bacon and other pork meat, respectively. Similar experiments were done byZhang et al (2010). They observed a total particle number concentration from 5 nm to few microns using a water-based Con-densation Particle Counter (Model 3785, TSI Inc). The authors reported 6.04 × 10⁵particles/cm3UFP concentration from frying chicken.
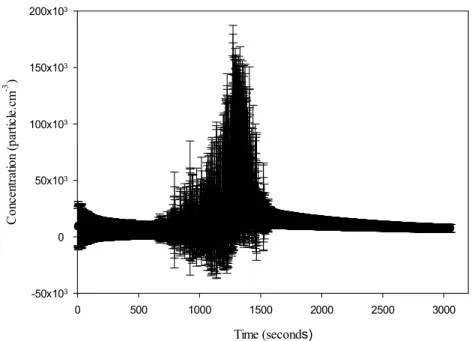
Fig. 5presents the average (N = 17) UFP concentration variations (1 s logging intervals) for 51 min of the experiments for the frying
pan-kebab using an electric stove. The first 20 min indicates the cooking time and the last 30 min indicates the post-exposure time. We can see that the initial background concentration is approximately 9.0 × 10³ particles/cm3,while the highest concentration was recorded to be ap-proximately 2.0 × 10⁵ particles/cm3. After approximately 27 min (1600 s) of the experiments, the background concentration was re-es-tablished. Figure S3 presents the 1-minute averaged UFP concentra-tions. The concentration rate reported inFig. 5and Figure S3 are dif-ferent due to the difdif-ferent logging intervals (1 s vs 1 min). The highest concentration reported to be 7.0 × 10⁴particles/cm3 (averaged over 1 min for 12 experiments) was reached with two minutes delay (at minute 22) after the completion of the cooking (when the stove was off). This delayed peak concentration can be explained by the coagu-lation of particles smaller than 10 nm that are below the detection limit of the CPC. However, due to the coagulation, the particles can grow to larger than 10 nm and be detected by the CPC. The average particle diameter and the total surface area concentration in the current study were estimated to be 52 nm and 26.7 μm2/cm3, respectively, implying the emission of UFPs. The range of PM and UFP concentrations reported in the literature reviewed by Abdullahi et al. (2013) varies from 8 × 10⁻³ to 1.40 mg/m3 and from 5.7 × 10³ particles/cm3 to 8.9 × 10⁶ particles/cm3, respectively. This review shows that frying pan-kebab using an electric stove in the current study could be con-sidered as low- exposure cooking, as compared to the literature. The wide range of variability observed in concentration values in the lit-erature could be influenced by the type of PM sources, ventilation conditions, the volume of the house, location of the sampling port, outdoor particle infiltration and environmental conditions such surface materials, indoor temperature and humidity.
Figure S4 presents the increases in CO2concentrations with time during the experiments using an electric stove. The CO2concentration continuously increased at all stages of the experiments from approxi-mately 720 ppm (background) to 820 ppm (when the stove was turned off). This trend continued until the end of the measurements when the concentration reached approximately 880 ppm. The CO2concentrations in this study are in agreement with those findings of Amouei Torkmahalleh et al. (2018)which were obtained during grilling ground beef. The results of the present study show no particular impact on CO2 concentrations when the meat is added or turned. In addition to the frying, the presence of the humans in the room could add to the ac-cumulation of CO2during the experiments.
Fig. 4. PM2.5changes with time above the pan at the breathing zone (N = 17) during the experiments using the electric stove.
3.2. Brain response
Table 1presents the average relative power (RP) values over the whole brain and among 12 study participants for each band at the three steps of the measurements. No statistically significant differences were recorded for all bands by almost all electrodes between step1 (before-cooking) and step2 (at the end of (before-cooking) (Table S1), except for Beta3 recorded by the electrode O2 (p = 0.021). Overall, compared to the background period (on average, approximately 15 μg/m3and 9.0 × 10³ particles/cm3) the brain showed no statistically significant changes in its wave patterns shortly after the exposure to the maximum con-centrations (in average 40 μg/m3 and 2.0 × 10⁵ particles/cm3). Nevertheless, 30 min after the end of cooking (step2), the brain showed further responses to the inhaled particles.Figs. 6, S5 and S6 present the RP changes for Beta3, Delta and Alpha bands, respectively, among steps 1, 2 and 3. Comparing step3 and step2, 1 electrode for Delta, 1 elec-trode for Beta1, 2 elecelec-trodes for Beta2, and 3 elecelec-trodes for Beta3 showed statistically significant changes in RP.
Further analyses on the effect of gender demonstrated that the ob-served differences in Alpha band values between step 1 and 3 were more male-driven rather than female-driven (Figures S7 and S8, re-spectively). Other words, the differences between the average RP values for male participants recorded by those electrodes which showed sta-tistically significant differences (F8, F4, T4) were larger compared to those of the female participants.Figs. 7and S9 show the average RP values for seven female and five male study participants, respectively, recorded by 19 electrodes for the Beta3 band at steps 1, 2 and 3. Out of 19 electrodes, three electrodes including F7, O2 and T3, showed on average statistically significantly different RP values between different exposure periods (Table S1). The differences observed by the three
electrodes for Beta3 band were again male-driven rather than female-driven as shown inFigs. 7and S9 due to small sample size, no statistical analyses for the effect of gender was conducted.
An analysis to better understand the impact of age on the brain revealed that electrodes that showed statistically significant differences (F7, O2 and T3) for Beta3 band were driven definitely by the partici-pants older than 25 years (Fig. 8). Again, no statistical analysis was done to investigate the impact of age on the brain due to small sample size.
Table S2 shows the results of the statistical analyses on different lobes of the brain including frontal, left frontal, right frontal, left temporal, right temporal, temporal, central, parietal and occipital ob-tained during the three steps of the EEG measurements (before-cooking, at the end of cooking and after-cooking). Overall, both slow (Delta and Alpha) and fast-wave (Beta3) activities experienced statistically sig-nificant changes on different lobes of the brain while no statistically significant changes were observed at all for Theta, Beta1 and Beta2 bands during the three steps of the experiments using the electric stove. The major changes occurred in the frontal and temporal lobes of the brain, with a tendency of greater change to the right side of the brain. We have identified four patterns in the brain activities in response to the inhaled particles. The first type (Type I) was associated with the events when the bands (mainly Delta and Alpha) showed statistically insignificant variations in RP between step 1 (before-cooking) and step 2 (end of cooking) of the measurements, suggesting no immediate changes in brain wave patterns due to exposure to cooking aerosol. However, within 30 min after the end of cooking (step 3), the impact on the brain waves’ pattern became more noticeable, with statistically significant differences observed in RP values between step3 and step 1. The second type of pattern (Type II) was noticed when again the bands showed statistically insignificant changes in RP between step1 (before-cooking) and step2 (end of cooking). However, with reductions in RP at step2 as compared to step1, a statistically significant difference was found between RP for step3 (30 min after the cooking) and step2 (end of the cooking). The Type II pattern was observed only for the fast-wave activity Beta3.
Figs. 9and S10 show the RP variations for the slow-wave (Delta) activity and the fast-wave (Beta3) activity over the right frontal and left frontal lobes of the brain, respectively. The RP values for Delta de-creased during the post-exposure period as compared to the two other steps (Type I). For left frontal Beta3 the RP increased during the
post-Fig. 5. 1-s average particle number concentration observed for 17 experiments using an electric stove.
Table 1
Average relative power (RP) values among 12 study participants over the whole brain.
Band/exposure time Step 1 Step2 Step3
Alpha 31.95 ± 16.05 34.04 ± 16.72 34.27 ± 16.61 Theta 17.99 ± 5.25 18.10 ± 5.14 18.20 ± 5.90 Delta 27.06 ± 9.53 25.92 ± 9.59 24.36 ± 8.35 Beta 1 7.93 ± 3.43 8.06 ± 3.44 7.88 ± 2.74 Beta 2 4.15 ± 1.24 4.18 ± 1.36 4.48 ± 1.54 Beta 3 7.83 ± 2.56 7.49 ± 2.57 8.16 ± 3.13
cooking period as compared to the two other steps (Type II). All of the experiments showed similar Type I and Type II patterns changes among the three steps as indicated.
The third type of pattern (Type III) was observed in the Delta band for frontal and temporal lobes, as shown by Figures S11 and S12. Again Delta showed statistically insignificant changes in RP between step 1 (before-cooking) and step 2 (end of cooking). Nevertheless, due to a sharp decrease in RP at step 3, this step was statistically significantly different compared to both steps 1 and 2. A Type IV pattern was as-signed to the Alpha band as shown inFig. 10. In this pattern, observed in the right temporal of the brain, a statistically significant change was observed between step 2 and step 1, suggesting an immediate response of the brain to inhaled particles.
Table 2presents activity bands at different lobes of the brain which experienced statistically significant changes among the three steps of the experiments and the percentage of the population that experienced such statistical changes. Among eight scenarios (Table 2) that showed statistically significant differences for different lobes of the brain, three scenarios were recognized as pattern Type I, two scenarios as Type II and Type III, and one scenario was registered as Type IV. Overall, both
slow-wave and fast-wave activities changed during the post-cooking period. The RP for the fast-wave Beta3 and slow-wave Alpha bands increased while the RP for the slow-wave Delta activity decreased.
Among all lobes, the frontal lobe showed statistically significant changes on Delta and Beta3 bands with Types II and III patterns. The right frontal showed a pattern Type I pattern for Alpha and Delta bands. A Type III pattern was observed for the left frontal lobe Beta3. The overall temporal lobe experienced Type I and Type III for Alpha and Delta bands, respectively. The Type IV pattern was associated with the left temporal lobe Alpha band. There was no significant changes in parietal, central and occipital lobes.
Overall, the changes in RP values for men were more significant compared to those for women for the Beta3 band at different lobes of the brain (Figures S13 and S14). This could be due to the preadaptation of women to cooking fumes as they may spend more time indoors than men and cook more often. Study participants older than 25 years were more susceptible to UFPs compared to those younger than 25. Figures S15 and S16 provide the recorded RP values (Beta3) for study partici-pants older than 25 years and younger than 25, respectively.
Fig. 6. Average RP values for all study participants recorded by 19 electrodes for the Beta 3 at steps 1,2, and 3.
Fig. 7. Average RP values for five male study participants recorded by 19 electrodes for the Beta3 at steps 1,2, and 3.
4. Discussions
UFPs could reach the brain via olfactory, axonal transport and ca-pillary direct transport. The nasal mucosa is highly vascularized for rapid absorption of chemicals and drugs. Both soluble and insoluble particles should be able to reach the brain through this pathway. The capillary transport is a faster and more effective pathway, and mainly insoluble particles should translocate to the brain through this pathway. The smaller UFPs the more effective in crossing the alveolar/capillary barrier (McMartin et al., 1987). Additionally, particles can affect the brain by inflammatory spillover to the Central Nervous System (CNS), which is mainly recognized by the production of cytokine in the blood (Balasubramanian et al., 2013;Elder et al., 2006). The translocation from blood to the brain was observed in animal studies as early as 1 h, 6 h and 1 day for, 195Au, 192Ir, and13C UFPs, respectively (Kreyling et al., 2017b,2002;Oberdörster et al., 2004). The kinetics of the UFP translocation to the brain through the olfactory bulb in rats was also addressed in the literature. Oberdörster et al. (2004) reported the transport of the elemental 13C UFPs (36 nm in diameter and at the concentration of 160 μg/m3) to the Olfactory bulb of rats within one day after the 6 -h exposure. A similar observation was made byElder et al. (2006) such that within 30 min after intranasally instilled ex-posure to Mn oxide by rats, 0.2% of the UFPs deposited in the olfactory
mucosa were translocated to the olfactory bulb, and this fraction in-creased to 6.8% after 24 h post-exposure (Elder et al., 2006).
Three major observations can be made using the results obtained during the electric stove experiments in the current study.
Firstly, the results showed that during the electric stove experiments almost no immediate significant changes to the brain were observed except for the Alpha band at right temporal lobe, while significant changes took place with a delay (up to 30 min) after the exposure to cooking aerosol.
Secondly, only the frontal and temporal lobes of the brain were responded while occipital, parietal and central lobes of the brain were not affected during electric stove experiments. Black Carbon (BC) emissions from cooking fumes were addressed in several studies, typi-cally when solid fuels were used (Rupakhetia et al., 2019;Buonanno et al., 2013a,b;Ravindra, 2019). However, no information is available regarding the emission rates of black carbon from different cooking components such as oil, meat, and gas flame during cooking. The major constitutes of the oil particles could be organic carbon (OC) (Amouei Torkmahalleh et al., 2017b). Also, it is not yet clear whether the oil particles are soluble or insoluble or both. Soluble particles should wash out from the body, while insoluble particles are more likely to trans-locate to the secondary organs. Another existing gap in the literature is the morphology of the cooking particles which helps to better
Fig. 8. Average RP values for study participants older than 25 (N = 6) recorded by 19 electrodes for the Beta3 at steps 1,2, and 3.
understand the particle transport in the respiratory system and also the particle translocation in the blood circulation.Buonanno et al., 2009, studied the morphology of particles from grilling using a gas stove. They reported the presence of the aggregates of particles with chain-like structures as the major structure. However, single spherical nan-ometer size particles were also observed. The aggregate structure of the
particles might be an obstacle to pass the blood-air barrier and also blood-brain barrier.
Assuming there exist insoluble UFPs among oil particles (for ex-ample black carbon) and also not aggregated, the translocation of such particles to the frontal and temporal part of the brain could occur via the olfactory pathway as well as the Anterior Cerebral Artery (ACA).
Fig. 10. RP values obtained for Alpha band on the right temporal lobe at steps1, 2, and 3. Table 2
Different types of brain wave patterns recorded at the different lobes.
Number Lobe Statistically significant
Before-During Statistically significant Before-After Statistically significant During-After Statistically increase ordecrease Pattern Type
1 Frontal – Delta Delta Decrease (83%) III
2 Frontal – – Beta3 Increase (67%) II
3 Right Frontal – Delta – Decrease (83%) I
4 Right Frontal – Alpha – Increase (83%) I
5 Left Frontal – – Beta3 Increase (75%) II
6 Temporal – Delta (92%) Delta (83%) Decrease III
7 Temporal – Alpha – Increase (92%) I
8 Right Temporal Alpha Alpha – Increase (75%) IV
Fig. 11. Changes in average SBP, DBP, and HR of the 12 participants at steps 1, 2, and 3.
The ACA arises from the internal carotid at nearly a right angle. It sends deep penetrating branches to supply the most anterior portions of the basal ganglia. It then sweeps forward into the interhemispheric fissure, and then runs up and over the genu of the corpus callosum before turning backwards along the corpus callosum. As it runs backwards it forms one branch that stays immediately adjacent to the corpus cal-losum while a second branch runs in the cingulate sulcus (just superior to the cingulate gyrus).
If we assume that oil UFPs are soluble or are aggregate that cannot enter the blood circulation, then the olfactory pathway could be the major pathway for UFPs to reach the brain. In this case, again the frontal and temporal lobes could be the main targets for the UFPs.
Thirdly, the fast-wave frequency band (Beta3) increased after ex-posure to cooking aerosol. These three major findings in the present study are consistent with the observations made byCruts et al. (2008). The authors exposed ten study participants to diesel engine (DE) for 1 h offering 1.2 × 10⁶particles/cm3(300 μg/m3), and studied the effect of the exposure on the study participants brain using EEG. The authors observed increases in fast-wave frequency bands (beta) at the frontal lobe while no changes occurred for slow-wave bands (delta, theta and alpha). The statistically significant changes mainly occurred during the post-exposure. Also, no changes to the parietal and central parts of the brain were observed.
It is certain that during the electric stove cooking, the exposure to UFPs until the second EEG did not affect the brain, which could be due to the relatively low concentration of UFPs up to minute 20, as shown byFigs. 5 and S3, although the PM2.5concentration already almost reached its peak at minute 15 (Fig. 4). The concentration of PM2.5was at the background level almost after the second EEG, and thus no ex-posure to particle mass occurred between the second and third EEG measurements. This observation demonstrates that particle number concentration could be more influential on human health than particle mass concentration.Figs. 5and S3 demonstrate that the participants were still exposed to particles even after the completion of the second EEG measurement (end of cooking), conducted at minute 20. As shown at minute 20, the UFP concentration continued to rise such that a de-layed peak in UFP concentrations was observed at minute 25. After-wards, particle decay commenced and ended at minute 30. The ex-posure to UFPs continued to take place during the decay period until the concentration reached the background level, approximately at minute 30. This was almost 20 min before the third EEG measurement. No statistically significant changes (p < 0.05) were observed in DBP, SBP, and HR of the participants during the three steps of the measurements (Fig. 11). This observation is consistent withCruts et al. (2008)who reported no changes in HR of the study participants ex-posed to DE.
Both gaseous compounds and UFPs might be responsible for the observed changes in the brain’s functions in the present study. However, the threshold concentrations at which the cooking gases and UFPs exert significant changes to the brain’s wave pattern are unknown. The produced gases could be smelled through the olfactory bulb and would be expected to alter the wave patterns of the brain in the frontal and temporal lobes. It was reported that olfactory sensitization to chemical stimulation is usually recognized by increases in the activity of the slow-wave bands such as Delta (Bell et al., 1999) and in Alpha (Bell et al., 2013). In this study, increases in Alpha were observed. However, Delta band activities decreased. Future research is needed to better understand the relative importance of exposure to the cooking gases and UFPs on brain activity. The current study was limited to measuring only CO2as a gas. The CO2measurements were intended to ensure that there was no gaseous compounds between the two cooking experiments which can interfere with experimental results. No inter-ference of CO2between the two following experiments was observed.
Increased activities of Delta and Theta are associated with vigilance (Coull, 1998). Frontal and parietal are most often associated with at-tentional tasks (Coull, 1998). Nevertheless, we observed decreases in
Table 3 Comparison between the diagnosed diseases using EEG, and other PM exposure studies with the present study. Disease Delta Theta Alpha Beta Comment Reference Alzheimer increase increase decrease decrease Occipital alpha is preserved. Increased slow-wave at left Temporal lobe – Amplitude and EEG power were measured Jeong et al. (2004) ; Micanovic and Pal (2014) ; Malek et al. (2017) Vascular Dementia (VAD) increase increase Temporal Rosén et al. (1997) ;Calzetti et al., 2002) Dementia with Lewy Bodies (DLB) increase increase Loss of Alpha Micanovic and Pal (2014) Obsessive–Compulsive Disorder (OCD) decrease Bucci et al. (2004) Parkinson increase increase decrease decrease Right temporal, left frontal, left temporal, left central and left occipital-relative power was measured. Malek et al. (2017) ; Soikkeli et al. (1991) ; Han et al. (2013) Schizophrenia increase Occipital, frontal and left temporal Mientus et al. (2002) Exposure to diesel exhaust No change No change No change increases in Beta2 Smoking -1 decrease decrease Increase (alpha2) Decrease (alpha1) increase Measurements on smokers Domino, 2003 Smoking-2 decrease decrease increase Measurements on smokers Golding, 1988 Smoking-4 increase Measurements after smoking-Only alpha band was reported Domino et al., 2009 Smoking-5 decrease decrease increase Measurements after smoking Knott, 1988 Cooking on electric stove decrease No change increase Increases in Beta3 The present study
the activities of the Delta and no changes in Theta, suggesting no effect on the brain due to boredom and lowered vigilance experienced by the study participants after an almost 80 min stay in the experimental apartment.
Table 3compares the results of the current study with other clinical exposure and neurodegenerative disorders diagnosed using the EEG. A lowering of brain activity based on EEG results was observed in neu-rodegenerative diseases (Table 3), including Alzheimer’s and Parkin-son’s such that delta and theta bands mainly increased and the beta band decreased. Exposure to electric stove cooking aerosol showed a reverse impact on the brain such that fast-wave frequency Beta3 in-creased and slow-wave frequency Delta dein-creased. However, it is pos-sible that the brain wave patterns for neurodegenerative disorder pa-tients may also change over the time as their diseases progress.
Exposure to diesel exhaust (DE) has shown increases in the fast-wave Beta, suggesting a similar pattern between exposure to DE and electric stove cooking aerosol with respect to fast-wave bands. However, the DE study reported no changes in slow-wave bands while the electric stove study observed decreases in slow-wave Delta. The greatest similarity in EEG patterns was observed between smoking studies and cooking using electric stove such that the both caused de-creases and inde-creases in several cases in the activity of the Delta and Alpha bands, respectively, and the fast-wave bands increased for both of them.
5. Conclusion
Exposure to aerosol (both UFPs and gases) from electric stove frying has a significant impact on human brain particularly on the frontal and temporal lobes. There is a 30 min delay on average in brain response. Also, gender is a key factor in the brain responses to the aerosol from electric stove frying. People with sustained exposures such as those likely present in occupational settings, or during prolonged home cooking are of concern given the long term effects due to chronic ex-posures.
We found that exposure to aerosol from electric stove frying showed similar patterns in the slow-wave (decreased) and fast-wave (increased) bands of the brain as those of smokers and also as those who were exposed to smoking aerosol. No similarity to neurodegenerative dis-eases in EEG patterns was observed. No definitive conclusion can be made on the pathways (blood circulation vs. olfactory pathway) for the particle translocation to the brain in the present study as some key information such as morphology and solubility of the frying particles are required.
Acknowledgment
The authors of this study would like to acknowledge Nazarbayev University for providing the Faculty Small Grant (No: 090118FD5315) to the authors of this manuscript to conduct this study.
Appendix A. Supplementary data
Supplementary material related to this article can be found, in the online version, at doi:https://doi.org/10.1016/j.neuro.2019.06.008.
References
Abdullahi, K., Delgado-Saborit, J., Harrison, R., 2013. Emissions and indoor concentra-tions of particulate matter and its specific chemical components from cooking: a
review. Atmos. Environ. 71, 260–294.
Amouei Torkmahalleh, M., Goldasteh, I., Zhao, Y., Udochu, N., Rossner, A., Hopke, P.,
Ferro, A., 2012. PM2.5and ultrafine particles emitted during heating of commercial
cooking oils. Indoor Air 22, 483–491.
Amouei Torkmahalleh, M., Zhao, Y., Rossner, A., Hopke, P., Ferro, A., 2013. Additive impacts on particle emissions from heating low emitting cooking oils. Atmos.
Environ. 74, 194–198.
Amouei Torkmahalleh, M., Ospanova, S., Baibatyrova, S., Nurbay, S., Zhanakhmet, G.,
Shah, D., 2018. Contributions of burner, pan, meat and salt to PM emission during
grilling. Environ. Res. 164, 11–17.
Amouei Torkmahalleh, M., Gorjinezhad, S., Unluevcek, H.S., Hopke, P.K., 2017a. Review of factors impacting emission/concentration of cooking generated particulate matter.
Sci. Total Environ. 586, 1046–1056.
Amouei Torkmahalleh, M., Gorjinezhad, S., Keles, M., Ozturk, F., Hopke, P.K., 2017b. Size segregated PM and its chemical composition emitted from heated corn oil. Environ.
Res. 154, 101–108.
Amouei Torkmahalleh, M., Kaibaldiyeva, U., Kadyrbayeva, A., 2017c. A new computer model for the simulation of particulate matter formation from heated cooking oils
using Aspen Plus. Build. Simul. 10 (4), 535–550.
Amouei Torkmahalleh, M., Gorjinezhad, S., Keles, M., Unluevcek, H.S., Azgin, C., Cihan, E., Tanis, B., Soy, N., Ozaslan, N., Ozturk, F., Hopke, P.K., 2017d. A controlled study
for the characterization of PM2.5emitted during heating ground beef meat. J. Aerosol
Sci. 103, 132–140.
Balasubramanian, S.K., Poh, K.W., Ong, C.N., Kreyling, W.G., Ong, W.Y., Yu, L.E., 2013. The effect of primary particle size on biodistribution of inhaled gold
nano-agglom-erates. Biomaterials 34 (22), 5439–5452.https://doi.org/10.1016/j.biomaterials.
2013.03.080.PMID: 23639527.
Bell, I.R., Szarek, M.J., Dicenso, D.R., Baldwin, C.M., Schwartz, G.E., Bootzin, R.R., 1999. Patterns of walking EEG spectral power in chemically intolerant individuals during
repeated chemical exposures. Int. J. Neurosci. 97 (1-2), 41–59.
Bell, I.R., Brooks, A.J., Howerter, A., Jackson, N., Schwartz, G.E., 2013. Acute electro-encephalographic effects from repeated olfactory administration of homeopathic remedies in individuals with self-reported chemical sensitivity. Alternm Ther Health
Med 19 (1), 46–57.
Bucci, P., Mucci, A., Volpe, U., Merlotti, E., Galderisi, S., Maj, M., 2004. Executive hy-percontrol in obsessive–compulsive disorder: electrophysiological and
neuropsycho-logical indices. Clin. Neurophysiol. 115 (6), 1340–1348.
Buonanno, G., Johnson, G., Morawska, L., Stabile, L., 2011. Volatility characterization of
cooking-generated aerosol particles. Aerosol Sci. Technol. 45, 1069–1077.
Buonanno, G., Morawska, L., Stabile, L., 2009. Particle emission factors during cooking
activities. Atmos. Environ. 43, 3235–3242.
Buonanno, G., Marks, G., Morawska, L., 2013a. Health effects of daily airborne particle dose in children: direct association between personal dose and respiratory health
effects. Environ. Pollut. 180, 246–250.
Buonanno, G., Stabile, L., Morawska, L., Russi, A., 2013b. Children exposure assessment to ultrafine particles and black carbon: the role of transport and cooking activities.
Atmos. Environ. 79, 53–58.
Calderon-Garciduenas, L., Franco-Lira, M., Torres-Jardon, R., Henriquez-Roldan, C., Barragan-Mejia, G., Valencia-Salazar, G., Gonzalez-Maciel, A., Reynoso-Robles, R., Villarreal-Calderon, R., Reed, W., 2007. Pediatric respiratory and systemic effects of chronic air pollution exposure: nose, lung. Heart, and brain pathology. Toxicol.
Pathol. 35 (1), 154–162.
Coull, J.T., 1998. Neural correlates of attention and arousal: insights from electro-physiology, functional neuroimaging and psychopharmacology. Prog. Neurobiol. 55
(4), 343–361.
Cruts, B., Driessen, A., van Etten, L., Törnqvist, H., Blomberg, A., Sandström, T., Mills, N.L., Borm, P.J., 2008. Exposure to diesel exhaust induces changes in EEG in human
volunteers. Part. Fibre Toxicol. 5:4.https://doi.org/10.1186/1743-8977-5-4.
Dacunto, P.J., et al., 2013. Real-time particle monitor calibration factors and PM2.5 emission factors for multiple indoor sources. Environ. Sci.: Processes Impacts 15,
1511.
Dennekamp, M., Howarth, S., Dick, C., Cherrie, J., Donaldson, K., Seaton, A., 2001. Ul-trafine particles and nitrogen oxides generated by gas and electric cooking. Occup.
Environ. Med. 58, 511–516.
Domino, E.F., 2003. Effects of tobacco smoking on electroencephalographic, auditory
evoked and event related potentials. Brain Cogn. 53 (1), 66–74.
Domino, E.F., Ni, L., Thompson, M., Zhang, H., Shikata, H., Fukai, H., Sakaki, T., Ohya, I., 2009. Tobacco smoking produces widespread dominant brain wave alpha frequency
increases. Int. J. Psychophysiol. 74 (3), 192–198.
Dua, S., Hopke, P., 1996. Hygroscopic growth of assorted indoor aerosols. Aerosol Sci.
Technol. 24, 151–160.
Elder, A., Gelein, R., Silva, V., et al., 2006. Translocation of inhaled ultrafine manganese oxide particles to the central nervous system. Environ. Health Perspect. 114 (8),
1172–1178.https://doi.org/10.1289/ehp.9030.
Friedman, Milton, 1937. The use of ranks to avoid the assumption of normality implicit in
the analysis of variance. J. Am. Stat. Assoc. 32 (200), 675–701.
Gao, J., Cao, C., Wang, L., Song, T., Zhou, X., Yang, J., Zhang, X., 2013a. Determination of size-dependent source emission rate of cooking-generated aerosol particles at the
oil-heating stage in an experimental kitchen. Aerosol Air Qual. Res. 13, 488–496.
Gao, J., Cao, C., Zhang, X., Luo, Z., 2013b. Volume-based size distribution of accumu-lation and coarse particles (PM0.1-10) from cooking fume during oil heating. Build.
Environ. 59, 575–580.
Golding, J.F., 1988. Effects of cigarette smoking on resting EEG, visual evoked potentials
and photic driving. Pharmacol Biochem Behave 29 (1), 23–32.
Gorjinezhad, S., Kerimray, A., Amouei Torkmahalleh, M., Keles, M., Ozturk, F., Hopke, P.K., 2017. Quantifying trace elements in the emitted particulate matter during cooking and health risk assessment. Environ. Sci. Pollut. Res. - Int. 24 (10),
9515–9529.
Hameri, K., Koponen, I., Aalto, P., Kulmala, M., 2002. The particle detection efficiency of
the TSI-3007 condensation particle counter. Aerosol Science 33, 1463–1469.
Han, C.X., Wang, J., Yi, G.S., Che, Y.Q., 2013. Investigation of EEG abnormalities in the
early stage of Parkinson’s disease. Cogn. Neurodyn. 7 (4), 351–359.
He, C., Morawska, L., Hitchins, J., Gilbert, D., 2004. Contribution from indoor sources to particle number and mass concentrations in residential houses. Atmos. Environ. 38,
3405–3415.
Jeong, J., 2004. EEG dynamics in patients with Alzheimer’s disease. Clin. Neurophysiol.
115 (7), 1490–1505.
Jorgensen, R., Strandberg, B., Sjaastad, A., Johansen, A., Svendsen, K., 2013. Simulated restaurant cook exposure to emissions of pahs, mutagenic aldehydes, and particles
from frying bacon. J. Occup. Environ. Hyg. 10, 122–131.
Knott, V.J., 1988. Dynamics EEG changes during cigarette smoking. Neuropsychobiology
19 (1), 54–60.
Kreyling, W.G., Semmler, M., Erbe, F., Mayer, P., Takenaka, S., Schulz, H., Oberdorster, G., Ziesenis, A., 2002. Translocation of ultrafine insoluble iridium particles from lung epithelium to extrapulmonary organs is size dependent but very slow. J. Toxicol.
Environ. Health Part A 65 (20), 1513–1530.
Kreyling, W.G., Holzwarth, U., Haberl, N., Kozempel, J., Wenk, A., Hirn, S., Schleh, S., Schaffler, M., Lipka, J., Semmler-Behnke, M., Gibsen, N., 2017b. Quantitative bio-kinetics of titanium dioxide nanoparticles after intratracheal instillation in rats: (Part
3). Nanotoxicology 11 (4), 454–464.
Lasselin, J., Magne, E., Beau, C., Aubert, A., Dexpert, S., Carrez, J., Layé, S., Forestier, D., Ledaguenel, P., Capuron, L., 2016. Low-grade inflammation is a major contributor of
impaired attentional set shifting in obese subjects. Brain Behav. Immun. 58, 63–68.
Long, C., Suh, H., Koutrakis, P., 2000. Characterization of indoor particle sources using
con- tinuous mass and size monitors. J. Air Waste Manage. Assoc. 50, 1236–1250.
Lucchini, R.G., Dorman, D.C., Elder, A., Veronesi, B., 2012. Neurological impacts from inhalation of pollutants and the nose-brain connection. Neurotoxicology 33 (4),
838–841.
Malek, N., Baker, M.R., Mann, C., Greene, J., 2017. Electroencephalographic markers in
dementia. Acta Neuro Scand 135, 388–393.
McDonald, J., Zielinska, B., Fujita, E., Sagebiel, J., Chow, J., Watson, J., 2003. Emissions from charbroiling and grilling of chicken and beef. J. Air Waste Manage. Assoc. 53,
185–194.
McMartin, C., Hutchinton, L.E., Hyde, R., Peters, G.E., 1987. Analysis of structural re-quirements for the absorption of drugs and macromolecules from the nasal cavity. J.
Pharm. Sci. 76, 535–540.
Micanovic, C., Pal, S., 2014. The diagnostic utility of EEG in early-onset dementia: a systematic review of the literature with narrative analysis. J. Neural Transm. 121,
59–69.
Mientus, S., Gallinat, J., Wuebben, Y., Pascual-Marqui, R.D., Mulert, C., Frick, K., Dorn, H., Herrmann, W.M., Winterer, G., 2002. Cortical hypoactivation during resting EEG in schizophrenics but not in depressives and schizotypal subjects as revealed by low
resolution electromagnetic tomography (LORETA). Psychiatry Res. 116, 95–111.
Nasir, Z., Colbeck, I., 2013. Particulate pollution in different housing types in a uk
sub-urban location. Sci. Total Environ. 445–446, 165–176.
Nel, A., Xia, T., Madler, L., Li, N., 2006. Toxic potential of materials at the nanolevel.
Science 311 (5761), 622–627.
Oberdörster, G., Sharp, Z., Atudorei, V., Elder, A., Gelein, R., Kreyling, W., Cox, C., 2004. Translocation of ultrafine particles to the brain. Inhalation Toxicology International
Forum for Respiratory Research. 16 (6–7), 437–445.
Pickering, T.G., Hall, J.E., Appel, L.J., Falkner, B.E., Graves, J., Hill, M.N., Jones, D.W., Kurtz, T., Sheps, S.G., Roccella, E.J., 2005. Recommendations for blood pressure measurement in humans and experimental animals: part 1: blood pressure
measurement in humans: a statement for professionals from the Subcommittee of Professional and Public Education of the American Heart Association Council on High
Blood Pressure Research. Circulation 111 (5), 697–716.
Ravindra, K., 2019. Emission of black carbon from rural households kitchens and as-sessment of lifetime excess cancer risk in villages of North India. Environ. Int. 122,
201–212.
Rosén, I., 1997. Electroencephalography as a diagnostic tool in dementia. Dement.
Geriatr. Cogn. Disord. 8 (2), 110–116.
Rotondi, F., Franceschetti, S., Avanzini, G., Panzica, F., 2016. Altered EEG resting-state effective connectivity in drug-naïve childhood absence epilepsy. Clin. Neurophysiol.
127 (2), 1130–1137.
Rupakhetia, D., Oanha, N.T.K., Rupakheti, M., Kumar, R.S.H., Panday, A.K., Puppala, S.P., Lawrence, M.G., 2019. Indoor levels of black carbon and particulate matters in relation to cooking activities using different cook stove-fuels in rural Nepal. Energy
Sustain. Dev. 48, 25–33.
See, S., Balasubramanian, R., 2006. Physical characteristics of ultrafine particles emitted
from different gas cooking methods. Aerosol Air Qual. Res. 6, 82–92.
See, S., Balasubramanian, R., 2008. Chemical characteristics of fine particles emitted from
different gas cooking methods. Atmos. Environ. 42, 8852–8862.
Soikkeli, R., Partanen, J., Soininen, H., Paakkonen, A., Riekkinen, P., 1991. Slowing of
EEG in Parkinson’s disease. Electroencephalogr. Clin. Neurophysiol. 79 (3), 159–165.
Stone, V., Mark, R.M., Martin, J.D.C., Alison, E., Nicholas, L.M., Peter, M., Roel, P.F.S., Ulla, V., Wolfgang, G.K., Keld, A.J., Thomas, A.J.K., Per, E.S., Peter, H., Antonio, P., Andrea, D.V.-R., Armelle, B.-S., João, P.T., Lang, T.C., Flemming, R.C., 2017. Nanomaterials versus ambient ultrafine particles: an opportunity to exchange
tox-icology knowledge. Environ. Health Perspect.https://doi.org/10.1289/EHP424.CID:
106002.
Wallace, L., Howard-Reed, C., 2002. Continuous monitoring of ultrafine, fine, and coarse particles in a residence for 18 months in 1999-2000. J. Air Waste Manage. Assoc. 52,
828–844.
Wallace, L., Ott, W., 2010. Personal exposure to ultrafine particles. J. Expo. Sci. Environ.
Epidemiol. 21, 20–30.
Wallace, L., Emmerich, S., Howard-Reed, C., 2004. Source strengths of ultrafine and fine
particles due to cooking with a gas stove. Environ. Sci. Technol. 38, 2304–2311.
Wallace, L., Ott, W., Weschler, C., 2014. Ultrafine particles from electric appliances and cooking pans: experiments suggesting desorption/nucleation of sorbed organics as
the primary source. Indoor Air 25 (5), 536–546.
Wallace, L., Wang, F., Howard-Reed, C., Persily, A., 2008. Contribution of gas and electric stoves to residential ultrafine particle concentrations between 2 and 64 nm: size distributions and emission and coagulation rates. Environ. Sci. Technol. 42,
8641–8647.
Wilcoxon, Frank, 1945. Individual comparisons by ranking methods. Biom. Bull. 1 (6),
80–83.
Yeung, L., To, W., 2008. Size distributions of the aerosols emitted from commercial
cooking processes. Indoor Built Environ. 17, 220–229.
Zhang, Q., Gangupomu, R., Ramirez, D., Zhu, Y., 2010. Measurement of ultrafine particles and other air pollutants emitted by cooking activities. Int. J. Environ. Res. Public