Simulation of higher harmonics generation in tapping-mode atomic force microscopy
O. Sahin, and A. Atalar
Citation: Appl. Phys. Lett. 79, 4455 (2001); doi: 10.1063/1.1429296 View online: http://dx.doi.org/10.1063/1.1429296
View Table of Contents: http://aip.scitation.org/toc/apl/79/26 Published by the American Institute of Physics
Articles you may be interested in
Higher-harmonics generation in tapping-mode atomic-force microscopy: Insights into the tip–sample interaction Applied Physics Letters 76, 3478 (2000); 10.1063/1.126683
Compositional mapping of surfaces in atomic force microscopy by excitation of the second normal mode of the microcantilever
Applied Physics Letters 84, 449 (2004); 10.1063/1.1642273
Higher harmonics imaging in tapping-mode atomic-force microscopy Review of Scientific Instruments 74, 5111 (2003); 10.1063/1.1626008
Spectroscopy of the anharmonic cantilever oscillations in tapping-mode atomic-force microscopy Applied Physics Letters 77, 3293 (2000); 10.1063/1.1325404
Accurate formulas for interaction force and energy in frequency modulation force spectroscopy Applied Physics Letters 84, 1801 (2004); 10.1063/1.1667267
Equivalent point-mass models of continuous atomic force microscope probes Applied Physics Letters 91, 053101 (2007); 10.1063/1.2767173
Simulation of higher harmonics generation in tapping-mode
atomic force microscopy
O. Sahina) and A. Atalar
Electrical and Electronics Engineering Department, Bilkent University, Bilkent, 06533 Ankara, Turkey 共Received 21 June 2001; accepted for publication 18 October 2001兲
In tapping-mode atomic force microscopy, nonlinear tip–sample interactions give rise to higher harmonics of the cantilever vibration. We present an electrical circuit to model the atomic force microscope cantilever with its first three flexural eigenmodes. An electrical circuit simulator is used to simulate the tapping-mode operation. Amplitude and phase responses of the third flexural eigenmode are obtained for different sample properties. It is found that amplitude and phase of higher harmonics depend highly on sample properties. © 2001 American Institute of Physics.
关DOI: 10.1063/1.1429296兴
Tapping-mode atomic force microscopy has a great po-tential in mapping material properties at the nanometer scale. Phase images obtained while the tip is scanned across the sample shows significant material contrast.1 Though not complete, a reasonably good understanding of the sources of relative phase shifts has been established. The relation be-tween energy dissipation in tip–sample contact and phase difference between the driving force and the tip motion makes it possible to map energy dissipation,2,3 which is a material dependent quantity. The mechanism of energy dis-sipation is not fully understood yet, however, several at-tempts have been made. These models relate phase contrast to wetting properties of different materials4 or sample stiff-ness and tip–sample attractive forces.5All these models are quite complicated and we end up in a situation where we have more unknowns than equations to characterize the ma-terials. For the purpose of imaging material properties, a dif-ferent approach came from Stark and Heckl6suggesting the use of higher harmonics to probe the anharmonic tip–sample interaction. In this technique, a single or a group of higher harmonics of the cantilever motion is filtered and the result-ing signal is utilized for imagresult-ing purposes. It is also shown that contact time can be estimated from these signals. The main advantage of using higher harmonics is the increased contrast and sensitivity to variations in properties of the sample.7A good understanding of higher harmonics genera-tion is therefore crucial.
Here, we propose an equivalent electrical circuit in order to simulate higher harmonics generated in tapping mode with the help of a circuit simulator,HSPICE.8The electrical model we used in this work is similar to the previously described model.5We added two more resonators to represent two of the higher order modes. The complete model is depicted in Fig. 1. It is worth mentioning that the effects of the driving force on higher order modes are neglected, which is a rea-sonable assumption for high Q cantilevers. These modes are excited with the tip–sample interactions. In our electrical circuit, each loop on the left-hand side represents one of the eigenmodes of the cantilever–tip system and right-hand side
loop represents the sample. Capacitances represent the effec-tive spring constants 共K兲 of the eigenmodes and the sample with the numerical equality K⫽1/C. Inductances represent the effective masses ( M⫽L). Therefore, charges in each ca-pacitance represent the displacement of that mode and their summation C1V1⫹C2V2⫹C3V3 represents the total
dis-placement of the tip. Similarly, the sample surface level is represented with the charge in the capacitance of the right-hand side loop with the relation CVC. The resistances
rep-resent the damping of the eigenmodes with the relation Q
⫽(L/C)1/2/R. Diamond-shaped symbols stand for voltage
controlled voltage sources and F(Vt⫺Vs) represents the
force of interaction between the tip and sample. Note that the interaction force F depends on voltages instead of charges
共charges represent the displacement兲. This is becauseHSPICE
does not allow charge controlled voltage sources. To over-come this difficulty, we introduced two extra voltage con-trolled voltage sources Vt and Vs, whose voltages are
nu-merically equal to the charges共see Fig. 1兲 and we defined the interaction force F with respect to Vt and Vs. Adjustable
a兲Electronic mail: [email protected]
FIG. 1. Equivalent electrical circuit of the cantilever–tip system. Each loop on the left-hand side represents one of the eigenmodes of the cantilever–tip system and the right-hand side loop represents the sample. Diamond-shaped symbols stand for voltage controlled voltage sources and F(Vt⫺Vs) repre-sents the force of interaction between the tip and sample. Adjustable voltage source V0 is used to adjust the rest position of the cantilever. Vt and Vs represent the positions of the tip and the sample, respectively.
APPLIED PHYSICS LETTERS VOLUME 79, NUMBER 26 24 DECEMBER 2001
4455
voltage source V0 is used to adjust the rest position of the
cantilever. The first resonance f1 is at 15.92 kHz with a
quality factor Q of 250, the second resonance f2 is at 5.4f1 with a quality factor Q2 of 450 and the third resonance f3 is at 15.4f1 with a quality factor Q3 of 450. We chose the resonant frequencies of the higher eigenmodes as a noninte-ger multiples of f1, which is the general situation for most of
the cantilevers used in experiments.10To complete the speci-fications of the cantilever, the equivalent spring constants of each mode must be given. These parameters are needed to determine the amplitude of the oscillations. In order to esti-mate the equivalent spring constants of the higher order modes, we use the formula for rectangular cantilevers11
Kn K1⫽
冉
fn f1冊
2 . 共1兲Here, Kn, fn, K1, and f1 are the effective stiffness and resonance frequencies of the nth and fundamental modes, respectively. Together with these values and Eq. 共1兲, we chose the values 10, 29, and 225 N/m for the effective spring constants of the first three flexural vibration modes. We con-struct the electrical equivalent circuit with these mechanical parameters and the relations between the electrical circuit and mechanical model parameters presented in our previous work.5 In addition to the cantilever and tip, a feedback cir-cuitry, which is not shown in Fig. 1, is used to fix the am-plitude of the oscillations to the set-point amam-plitude of 80 nm. 共The ratio of set-point amplitude to free amplitude is
0.64兲. This circuit adjusts the voltage V0 of the dc source in
Fig. 1 to ensure the constant swing of the oscillations of the tip.
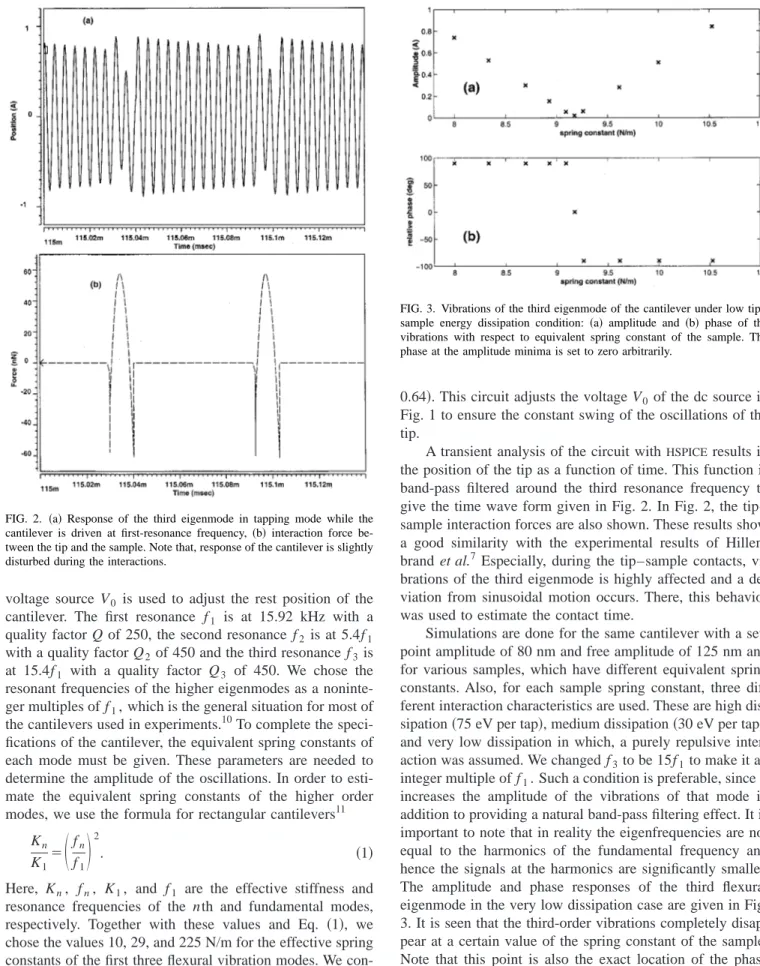
A transient analysis of the circuit withHSPICEresults in the position of the tip as a function of time. This function is band-pass filtered around the third resonance frequency to give the time wave form given in Fig. 2. In Fig. 2, the tip– sample interaction forces are also shown. These results show a good similarity with the experimental results of Hillen-brand et al.7 Especially, during the tip–sample contacts, vi-brations of the third eigenmode is highly affected and a de-viation from sinusoidal motion occurs. There, this behavior was used to estimate the contact time.
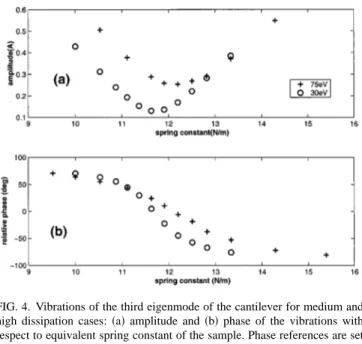
Simulations are done for the same cantilever with a set-point amplitude of 80 nm and free amplitude of 125 nm and for various samples, which have different equivalent spring constants. Also, for each sample spring constant, three dif-ferent interaction characteristics are used. These are high dis-sipation共75 eV per tap兲, medium dissipation 共30 eV per tap兲, and very low dissipation in which, a purely repulsive inter-action was assumed. We changed f3to be 15f1 to make it an
integer multiple of f1. Such a condition is preferable, since it
increases the amplitude of the vibrations of that mode in addition to providing a natural band-pass filtering effect. It is important to note that in reality the eigenfrequencies are not equal to the harmonics of the fundamental frequency and hence the signals at the harmonics are significantly smaller. The amplitude and phase responses of the third flexural eigenmode in the very low dissipation case are given in Fig. 3. It is seen that the third-order vibrations completely disap-pear at a certain value of the spring constant of the sample. Note that this point is also the exact location of the phase jump of 180°. Since the amplitude varies around zero, am-plitude measurements will be an efficient way to probe sample properties. A rough estimate gives that a stiffness variation of 15% results in 1 Å amplitude variation. It is reported that in some cases the quality factor of the third eigenmode can be as high as 900, which means a further gain of 2 in resolution.9 Note that, if the cantilever position is
FIG. 2. 共a兲 Response of the third eigenmode in tapping mode while the cantilever is driven at first-resonance frequency,共b兲 interaction force be-tween the tip and the sample. Note that, response of the cantilever is slightly disturbed during the interactions.
FIG. 3. Vibrations of the third eigenmode of the cantilever under low tip– sample energy dissipation condition: 共a兲 amplitude and 共b兲 phase of the vibrations with respect to equivalent spring constant of the sample. The phase at the amplitude minima is set to zero arbitrarily.
measured with the conventional optical detection method, the output signal depends on the slope of the cantilever which is higher in higher order vibration modes. Therefore, a good signal to noise ratio can be expected.
For the dissipative interactions, amplitude and phase re-sponses are plotted in Fig. 4. It is seen that the third-order vibrations do not go to zero. As a consequence, the ampli-tude variations around the minimum are not sensitive to the sample stiffness variations. These time phase shift measure-ments become more useful to probe the sample variations. For the medium dissipation case about 6° of phase shift is expected for a stiffness change of 1%. The high sensitivity of the third flexural eigenmode is because the contact time and
the period of the vibrations of the third flexural mode are nearly equal. We note that there is a relation between the contact time and the number of higher order modes that are efficiently excited. The smaller the contact time, the greater the number of higher order modes that are excited. In most materials, contact times are around 5%–10% of the main period, which corresponds to the periods of 10th to 20th harmonics. The third resonance is typically located at these frequencies. In very stiff or compliant samples, contact times can be as high as 12% or as low as 2% of the main period.12 In those cases, other flexural modes can be more suitable for imaging.
To summarize, we have presented an equivalent electri-cal circuit to model and simulate the higher harmonics gen-eration in tapping mode. The simulation results show that the third flexural vibration mode is highly sensitive to tip– sample interaction. Amplitude and relative phase shifts of these higher order vibrations could provide an opportunity to map material variations across the sample.
1
R. Garcia, J. Tamayo, and A. S. Paulo, Surf. Interface Anal. 27, 312 共1999兲.
2J. P. Cleveland, B. Anczykowski, A. E. Schmid, and V. B. Elings, Appl. Phys. Lett. 72, 2613共1998兲.
3
J. Tamayo and R. Garcia, Appl. Phys. Lett. 73, 2926共1998兲.
4M. Luna, J. Colchero, and A. M. Baro´, Appl. Phys. Lett. 72, 3461共1998兲. 5O. Sahin and A. Atalar, Appl. Phys. Lett. 78, 2973共2001兲.
6R. W. Stark and W. M. Heckl, Surf. Sci. 457, 219共2000兲. 7
R. Hillenbrand, M. Stark, and R. Guckenberger, Appl. Phys. Lett. 76, 3478 共2000兲.
8
HSPICE: Avant! Corporation, 46871 Bayside Parkway, Fremont, CA 94538. 9U. Rabe, K. Janser, and W. Arnold, Rev. Sci. Instrum. 67, 3281共1996兲. 10K. Yamanaka and S. Nakano, Jpn. J. Appl. Phys., Part 1 35, 3787共1996兲. 11
Details of this equation and modeling of the higher order modes are unpublished.
12J. Tamayo and R. Garciao, Langmuir 12, 4430共1996兲. FIG. 4. Vibrations of the third eigenmode of the cantilever for medium and
high dissipation cases: 共a兲 amplitude and 共b兲 phase of the vibrations with respect to equivalent spring constant of the sample. Phase references are set arbitrarily.
4457