DOI: 10.1002/cav.1806
R E S E A R C H A R T I C L E
A group-based approach for gaze behavior of virtual crowds
incorporating personalities
Umut A˘gıl
U˘gur Güdükbay
Department of Computer Engineering, Bilkent University, Bilkent 06800, Ankara, Turkey
Correspondence
U˘gur Güdükbay, Department of Computer Engineering, Bilkent University, Bilkent 06800, Ankara, Turkey.
Email: [email protected]
Abstract
Predicting interest points of virtual characters and accurately simulating their gaze behavior play a significant role for realistic crowd simulations. We propose a saliency model that enables virtual agents to produce plausible gaze behav-ior. The model measures the effects of distinct saliency features implemented by examining the state-of-the-art perception studies. When predicting an agent's interest point, we compute the saliency scores by using a weighted sum func-tion for other agents and environment objects in the field of view of the agent for each frame. Then, we determine the most salient entity for each agent in the scene; thus, agents gain a visual understanding of their environment. Besides, our model introduces new aspects to crowd perception, such as perceiving char-acters as groups of people and applying social norms on crowd gaze behavior, effects of agent personality on gaze, gaze copy phenomena, and effects of agent velocity on attention. For evaluation, we compare the resulting saliency gaze model with real-world crowd behavior in captured videos. In the experiments, we simulate the gaze behavior in real crowds. The results show that the proposed approach generates plausible gaze behaviors and is easily adaptable to varying scenarios for virtual crowds.
K E Y WO R D S
crowd simulation, gaze behavior, gaze copy, interest point detection, perception, saliency
1
I N T RO D U CT I O N
Real-time crowd simulation has been of great interest for years, and creating highly realistic virtual crowds is a challenging topic in the area of computer graphics. Currently, with the advancement in computer science and technology, virtual scenes that contain hundreds of agents acting in a crowd can be simulated in real time, and behaviors of these agents play a major role in improving the realism of the simulation. Most of the studies about crowd behavior are related to path planning, collision avoidance, autonomous agents, social interactions among groups, and personality models.
Characters move, walk, run, fight, and interact more realistically with evolving studies; however, gaze behavior remains as a lacking area in these simulations. Especially, in video games, even in the most popular ones, such as Assassin's Creed, Elder Scrolls, and The Witcher series (cf. Figure 1), gaze behavior of non-playable characters (NPCs) looks unre-alistic. In animation movie production, artists need to determine the interest points (IPs) of virtual characters, which are then adjusted frame by frame. In addition, working with crowds of large size brings a trade-off between realism and computational costs. Despite these problems, there are only a few studies dealing with the analysis and synthesis of gaze behavior.
Comput Anim Virtual Worlds. 2018;29:e1806. wileyonlinelibrary.com/journal/cav © 2018 John Wiley & Sons, Ltd. 1 of 26 https://doi.org/10.1002/cav.1806
FIGURE 1 Gaze behavior in popular computer games: Assassin's Creed (®Ubisoft, 2014), Elder Scrolls V: Skyrim (®Bethesda, 2011), and The Witcher 3 (®CD Projekt RED, 2015). Top row: agents look only forward or in random directions. Bottom left: NPCs continuously look at the player character. Bottom right: a scene where events, animations, and gaze behavior are preadjusted
The purpose of this research is to provide a new gaze behavior model for virtual crowds. The proposed approach focuses on crowd simulation in virtual environments, preferably where characters are viewed at a close range in the final rendered scene. Our proposed model is implemented as a module that can be attached to the Unity game engine.
In simulating crowds where characters are aware of their environment and other characters have a significant impact on enhancing realism, navigation and path planning algorithms can ensure this awareness up to a certain point by ensuring that the characters avoid collisions with each other or with scene objects. However, in the current literature, most com-puter games simulating crowds neglect the implementation of virtual characters' gaze behavior or apply preadjusted gaze animations to characters. Figure 1 shows examples of gaze behavior in three popular games where the two top images show characters that just look forward, the bottom left image contains NPCs that look at the player agent continuously, and the bottom right image shows a scene with preadjusted event and animations where passing agents direct their gaze to the predetermined area.
In the state-of-the-art techniques, gaze behavior of virtual agents can be simulated realistically by using physical proper-ties of individual agents to some extent. However, we believe that when simulating crowds, considering agents as groups of people and simulating their behavior in this way add more realism to simulations. If an agent walks in a group, proper-ties of the group may affect the interest that the agent will receive from the viewer agents. Also, walking alone or within a group can alter the attention directed to the viewed agent. Another effect that comes with the group-based approach is that agents who belong to the same group can copy each others' gaze behavior and try to look at the same targets. Therefore, we wanted to use this group-based approach in our gaze behavior model.
Another part we want to improve is giving personality to agents, which has a strong impact on determining their gaze behavior. For example, we can expect that a shy agent will be less eager to look at a salient entity than nonshy agents. Because being salient means being different from the crowd, we need to describe the features of crowd norms. Imple-menting adjustable and extendible crowd norm settings will let us simulate different types of crowds by just adjusting the norms.
In the development of animation movies, gaze behavior of characters is generally manually adjusted by an animation artist, by setting the gaze direction in certain frames. Certainly, artists can predict where the characters should look at; however, doing this process manually can be time consuming. Besides, a computational model could realistically predict IPs, which can be used as a baseline for gaze behavior. We aim to increase the realism of crowd simulations by proposing a gaze behavior model for the virtual characters in the scene. Especially, aiming to address the mentioned problems, the proposed approach focuses on predicting IPs and gaze duration for characters during run time. We aim to address the following research questions:
• How do the characters in virtual crowds decide their IPs and become aware of their environment?
• By using a computational behavior model, can we generate realistic gaze behaviors similar to the ones obtained from real videos?
The contributions of the paper are as follows:
• We propose a computational model of IP detection in real-time crowd simulations incorporating psychology, cognitive science, and computer graphics.
• We introduce a group-based approach for IP detection in which all characters belong to a group even if they walk alone. This approach yields a realistic implementation of perception of humans in groups1and performance improvement. • We incorporate the effects of the characters' personality to their gaze behavior. Users can alter the gaze behavior of a
character by adjusting the shyness and curiosity parameters.
• We incorporate a gaze copying mechanism where the members of a group are affected by each other's staring behavior. • We examine the human visual system and the causes of attention shifts in crowds, and we shape our model accordingly.
We apply an ensemble encoding mechanism1,2and incorporate the impact of walking speed on gaze behavior.3 • We propose a model with adjustable parameters that allow designing the scenes with different crowd norms, where
each norm represents a distinct society. A different crowd norm means that gaze behaviors and reactions of characters change from crowd to crowd such that a salient entity in a scene may not be that salient in another scene.
• We develop a gaze behavior framework that can be added as a plug-in to game engines (e.g., Unity4).
2
R E L AT E D WO R K
2.1
Saliency in computer graphics
Human visual attention can simply be considered as the cognitive process to concentrate on a visual object. It has been studied for a long time by psychologists and cognitive scientists. The results obtained have been put to use in computer graphics studies and applications to improve the quality of rendered images5,6 and to simulate virtual humans more
realistically.7,8
When a person looks at a scene, the brain cannot perceive the whole scene and analyze it instantly; instead, only the area within a two-degree range from the center point can be focused.9Next, the object identification stage starts, and attention
is directed serially to each object in a display.10It is indicated that the combination of two processes, which are bottom
up and top down, forms human visual attention mechanism.11The bottom-up process is a stimulus-driven attention and
depends on the properties of the objects. Human gaze is involuntarily directed toward the salient area, which possibly has a higher importance for that character. To give an example, the movement of a running man in a pedestrian group with slow pace can be a sign of danger. It is simply a difference of an area from its surroundings. The top-down process is a goal-driven process and can be thought as dependent on given tasks or the prior knowledge of the viewer. It also takes a role in determining longer term cognitive strategies.12
As one of the earliest methods, Itti et al.13applied bottom-up visual attention model on 2D images to compute saliency.
The result is called saliency map, in which each pixel reflects a saliency value, that is, how much the area possibly grabs attention. Saliency maps can successfully predict the attention scores of a scene at a time from the viewer's perspective. On the later studies, different features such as flickering,11motion,11and depth14are included to saliency map
compu-tations. On the other side, visual attention is not determined by just the incoming inattentive reflexes that resulted from bottom-up process. The studies of Longhurst et al.15 and Cater et al.9 are examples of different models that simulate
top-down processes.
Sundstedt et al.16pointed out that the pure bottom-up process is not sufficient to compute a person's gaze. They apply
psychophysical experiments using a computer game to show that saliency maps are weak in task-oriented scenarios. Itti argued that the bottom-up and top-down processes are not mutually exclusive, and the features of one can be integrated to those of the other.17Judd et al.18used face detection algorithms along with saliency maps. They use the idea that the
human visual system searches for faces initially when they look at images. Another study14combined these two processes,
in which bottom-up factors computed with saliency maps and top-down factors are computed by the spatial context of objects. When the object is close to the screen, it has a high saliency score. They compute saliency scores of objects instead of regions, which are what we use in our model.
2.2
Crowd simulations and crowd models
Computer simulations study the masses and try to predict their behavior because computer graphics technologies make it possible to generate multiple virtual characters. Reynold's model with boids19is one of the earliest successful works in this
area. Moreover, modeling of crowds improves progressively, and different aspects are studied in detail such as collision avoidance,20autonomous agents,21behaviors,22or personalities.23
Our work is especially related to the behavior of crowds, so we need to mention crowd models briefly. Alongside with physical crowds, which are people gathered in the same place, our main concern is primarily related to psychological crowds, in which individuals share a common social identity, and their behavior can change with the social norms.24
According to Templeton et al.,24state-of-the-art psychological crowd models can be divided into two categories: mass approaches and small group approaches. In mass crowd approaches, individuals are considered as part of a large gathering. One subtype of this approach, “homogeneous mass”, assumes that all entities in the crowd have the same properties and share the same goal. The work of Fang et al.25is an example of homogeneous mass approach, which simulates an egress
situation and analyzes crowd densities. The other subtype is “mass of individuals” that carry different properties. For example, Shi et al.26assigned different attributes to individual agents to generate more realistic simulations. The second
category, small group approach, basically depends on the idea that crowds are formed by small groups and that the models represent intergroup relations. This approach has a significant impact on the development of our study. The methods in this category can be divided into three subtypes: nonperceptual groups, perceptual groups, and cognitive groups.
To begin with, “nonperceptual groups” approaches consider groups as a homogeneous ensemble of individuals with identical properties. Entities that constitute the group act together as they are a big single entity. Groups preexist and members do not have intragroup interactions. Dogbe27assumed that groups are formed with a small numbers of members
who already know each other and tend to move together. In “perceptual groups” approaches, the main difference is that group members are aware of other members of their own group. Social norms are involved in determining group behavior, and individuals may change the group where they belong (e.g., the work of Qiu et al.28). The remaining approaches,
“cognitive groups”, are similar to “perceptual groups”, with one difference: individuals that share common properties are gathered in the same group. Moreover, these properties can change during the simulation, and this may result in new groups (e.g., the work of Park et al.29).
In addition to these grouping types, personalities of characters play an important role in structuring the behavior of the crowd. By using Eysenck's three-factor personality model, Guy et al.30 developed a mapping between
person-ality descriptors and simulation parameters to generate heterogeneous crowd behaviors. Durupinar et al.23 assigned
personalities to virtual characters with respect to the Openness, Conscientiousness, Extroversion, Agreeableness, and Neuroticism (OCEAN) personality model.31Then, they examined how small groups and global crowd behavior are
influ-enced by changing the personality parameters. According to the Big Five personality traits, personality dimensions are defined as “openness to experience”, “conscientiousness”, “extraversion”, “agreeableness”, and “neuroticism”. In the pro-posed approach, shyness and curiosity parameters are used to reflect personality, which can be related to “extraversion” and “neuroticism” for shyness and “openness to experience” for curiosity.
Another aspect that we take into consideration is the effects of cultural differences on crowd behaviors. Fridman et al.32
and Favaretto et al.33investigated cultural effects on crowd behaviors and showed that cultural differences affect
pedes-trian movement behaviors, such as personal space and speed. They defined cultural parameters for pedespedes-trian movement according to their observations.
Ond˘rej et al.34proposed a vision-based approach for crowd steering and collision avoidance. In their method,
charac-ters are considered as individuals and detect collisions by using the visual stimuli of virtual agents. Dutra et al.35described
a general-purpose control scheme for steering synthetic vision-based agents in crowds and cost functions for evaluat-ing the danger perceived by the individuals in an incident. Paravisi et al.36 used computer vision techniques to extract
example trajectories from real videos and inserted these trajectories into the simulations to generate accurate steering behaviors of crowds. Rodrigues et al.37simulated steering behaviors of groups of characters using the space colonization
algorithm. Queiroz et al.38,39proposed a human facial animation framework that generates realistic and dynamic facial
animations with respect to the user's face and detected responses. The gaze behavior of the user alters the gaze behavior of the animated character. They utilized computer-animated movies to describe gaze expressions in their model.
McDonnell et al.40assessed the realism of crowds with the perception of crowd variety. Hoyet et al.41presented a method
to improve the visual quality of crowd animations where collisions occur. They studied perceived collisions in the crowd, especially the animations that increase realism in collision avoidance.
2.3
Attention models and applications on crowds
Simulating attention in virtual characters is a highly challenging task. There are varying studies that aim to model atten-tion behavior realistically. Chopra-Kullar et al.42did one of the earliest works on this area (where to look), which uses
bottom-up features and computes gaze shifts with respect to these features. Later, Kim et al.43 proposed a model that
uses both bottom-up and top-down attention mechanisms. They used features of objects such as position, orientation, and velocity to generate attention scores for the objects in the visual field of the virtual agent. As a different approach, Itti et al.44and Peters et al.45used saliency maps to reach the same goal.
Ruhland et al.46reviewed the studies about eye and gaze animations for virtual agents. They analyzed the movement of
eyeballs, eyelids, and head and discussed the methods to model and animate them. They examined studies about visual attention in virtual and real environments. Another area they investigated is the relationship between emotions and gaze behavior, which is related to our implementation of personality–gaze relationship in virtual crowds. They analyzed the works that aim to detect emotional states from gaze behaviors of characters, and we simulate the effects of personality on gaze behavior.
Bailly et al.47focused on the speech and gaze aspects of the face-to-face interaction between naive human viewers and
either a human conversational partner or a virtual conversational agent. They performed experiments to analyze how speech activity and mutual gaze patterns affect each other during face-to-face interactions. Oyekoya et al.8 used four
intrinsic saliency attributes, proximity, eccentricity, orientation, and velocity, to determine interests of characters in scene objects. They combined these attributes to obtain a final saliency score, which is used to direct attention. Simply, the object with the highest score grabs attention. They compared their work with random gaze model and gaze tracker data and observed that their method generates results that are highly correlated to gaze-tracking outputs. Even though simulating crowds is not the goal of this study, it has a considerable impact on our work, especially with its saliency scoring method. Kokkinara et al.48implemented a model that simulates gaze interaction between the agents in crowds, which can be
autonomous virtual agents or user-controlled virtual agents. However, being in a crowd as individuals or belonging to groups in the crowd has different psychological effects that can alter behaviors of characters, which are missing in this model. Narang et al.49suggested a model that combines navigation and gaze behavior to increase the realism of virtual
characters. They achieve increased believability when they include gaze behavior to their navigation model.
Another study, and maybe the one that mostly inspired us in the motivation and development stages, belongs to Grillon et al.7 They simulated gaze behavior in crowd characters. Their approach runs as an extra layer to an existing
crowd simulation where the IPs of characters can be directed to static objects or other characters in the scene. For static objects in the scene, they assigned metainformation that defines interestingness, and depending upon this property, the objects attract attention. Along with it, they assigned different levels of interest to characters so that some of them attract more attention than the others. They also implemented the field-of-view feature, so only the entities that stay in this field can be viewed by the agent. They used a scoring function to form a set of constraints for determining gaze behaviors of agents and enforced these constraints with a gaze inverse kinematics solver. Although we use this study as a baseline, we include additional features: (a) We take grouping into account for perception and gaze behavior, (b) assign personality traits to characters, and (c) implement adjustable crowd norms. In this way, we can easily alter the criteria for gaze shifts and obtain heterogeneous gaze behaviors.
2.4
Human visual system and gaze behavior
We analyze representative studies about human visual system and perception in human psychology, especially the studies that investigate the relation between personality and gaze behavior. Other studies50–52advocated that personality
dimen-sion of extraverdimen-sion has been related to gaze behavior. According to Iizuka et al.,53extraverts are more likely to maintain
longer gazes than introverts while listening during social interaction. Kendon et al.51 stated that extraverts look at the
other person more often than introverts while speaking during a conversation. In addition, Iizuka et al.54demonstrated
the effects of shyness on gaze behavior. From such studies, we can conclude that the individual differences in extraversion appear to be related to maintaining eye contact during interaction, whereas shyness is related to gaze avoidance.
According to psychological studies on perception,1,2with ensemble encoding mechanism, humans perceive a group of
people as a single entity by inspecting the abstract features of the group's appearance, which grants a faster and more precise inspection than inspecting each individual one by one. Other studies1,55–57suggested that viewers perceive groups
of people or objects by effectively extracting the summary information from the whole group, and this information can even be generated within a short gaze time.58,59The features that are perceived as the average of the group by individuals
are direction,60,61speed,62orientation,63and size.64
We examine the relationship between movement speed and gaze behavior. According to Wang et al.,65pedestrians gaze
the target fixation duration is decreased with increasing walking speed. In other studies,66,67it is demonstrated that with
a high load of physical exercise, inattentional blindness affects the individuals, and they fail to notice some of the events or objects. Chabris et al.68 suggested that the attention of people decreases while they are running after a target. Their
experiments show that 56% of the participants cannot notice the preprepared event while they are chasing the target. Furthermore, other studies69,70suggested that with increasing speed of the viewer, peripheral vision and spatial perception
decrease, and the degree of concentration escalates.
2.5
Discussion
We describe the similarities and key differences to the prior art, especially the work of Grillon et al.7and Oyekoya et al.8
Similar to these approaches, we use a weighted sum scoring function by using the physical properties of agents such as proximity, periphery, and speed. When we analyze the work of Grillon et al7 and Oyekoya et al.,8 we observe that
the parameters proximity, periphery, orientation, and velocity are necessary for realistic IP detection. We also use these parameters in our scoring function and compute the scores of these parameters by finding the ratios with respect to their minimum and maximum values. Different from the state-of-the-art techniques, our approach provides the following to improve the gaze behavior of the characters:
1. Personality. Both of the approaches proposed by Grillon et al.7 and Oyekoya et al.8 do not include personalities in their computational models, which can cause significant differences in the behavior of characters. For example, a shy person tries to avoid looking at other pedestrians, wherease a not-shy person moves his or her gaze through other characters frequently. We admit that there are discussions on how shyness is related to personality traits; a shy person is not necessarily an introvert. It is related to either low extraversion71 or neuroticism.72We choose shyness instead
of introversion or neuroticism and apply it to change gaze behavior. When the proposed framework is used within a crowd model including personality traits, the shyness parameter can be associated with extraversion or neuroticism levels of the character.
2. Crowd norms. As studies described in other studies32,33suggested, cultural differences have an impact on pedestrian
behaviors. When simulating the behavior of crowds, including societal effects has a positive impact for generating real-istic results.24As an example, crowd norms can alter the decisions of characters; thus, different norms cause different
gaze behavior. As an improvement to the previous models, we added social norm parameters to simulate the cultural differences in the crowds, which help decide how different a character is from the crowd that we simulate.
3. Group-based approach. Although we simulate the gaze behavior of individuals in crowds, the proposed model is inspired by both nonperceptual group and perceptual group approaches24; hence, it can be considered a hybrid model.
In real-life examples, it is uncommon to observe crowd characteristics where all the agents walk as a single entity in the environment.73–75Studies on crowds suggest that up to 70% of people in the street prefer to walk in groups.76We
assume that groups in the crowd preexisted, that is, they are friends or family members and are attracted to move together unless the group size is one. In addition to this, social norms of the scene, which are preadjusted, have an impact on IP decisions of characters. When the crowd consists of groups, simulating the perception of groups using the ensemble coding principle will generate more realistic results than considering each agent as individuals.1,2,55–57
In addition to realism concerns, the small group approaches bring computational performance improvement to the framework. The number of entities to look at decreases from the number of characters to the number of groups. In our framework, we know that each group contains at least one character, so the number of comparisons for a character to detect IP will decrease in general.
4. Gaze copy. Using group-based approach in crowd perception simulation enabled us to implement gaze copy mech-anism for the group members. As we implemented the ensemble encoding mechmech-anism where agents perceive other agent groups as a single entity, the reverse—gaze copying—is also an important feature to realistically simulate crowd gaze behavior. When an agent is staring at an object in the scene, other agents that see her/him tend to look at that object.
3
S I M U L AT I N G I P D ET EC T I O N A N D GA Z E B E H AV I O R
The proposed approach, which runs as an extra layer on Unity game engine, consists of two main steps: IP detection and applying gaze shifts to characters. In Step 1, the process is completed in three stages. First, the user needs to adjust
the parameters of entities in the scene. Second, we compute the properties that will be used in saliency scoring. Third, we compute the saliency scores and predict IPs for each character. Step 2 has two stages. The first stage calculates the gaze states of characters using the predicted IPs, and the second stage generates head animations depending on the gaze duration factor. Before going into detail, we need to clarify the crowd organization and group behavior that we used.
Group organization of crowd.Our simulated crowds consist of individual pedestrian agents, each of which belongs to a group. Because our target is simulating the crowd in a street on a normal day, we use the word group for characters that have sociological relations between them, that is, they know each other and do not stay together incidentally. The group size ranges from one to five in the current implementation of the framework. Even when an agent is walking alone, we consider it as a member of a group, whose member count is one.
Perception of group by virtual characters.With the implementation of ensemble encoding, virtual characters perceive groups, not the individuals within the groups. The properties of groups are determined by averaging the values of members' properties.
3.1
IP detection
To determine IPs in real time for saliency computations, we need to assign certain attributes to entities in the scene so that we can make comparisons to find the most salient point. These assigned attributes are displayed in a parametric form and need to be adjusted by the user before running the program. Also, this process facilitates the generation of heterogeneous crowd behavior (e.g., some characters walk faster than others). The attributes assigned to characters and nonhuman objects differ by their definition or usage. However, as a common trait, they all range between 0 and 1.
Characters in the model have both physical and psychological attributes. Physical attributes, which are height, speed, and attractiveness, result in behavioral and physical variety in the crowd. Moreover, their other purpose is to allow the model to compute relative saliency parameters such as proximity and velocity. On the other hand, psychological attributes such as shyness and curiosity have a direct effect on a characters' gaze decisions. We use them as threshold values for char-acters to determine whether it should look at a salient point or not. Adjustable attributes of nonhuman objects are speed, attractiveness, and type. From these attributes, we compute a single parameter, distinctiveness, and use it in saliency comparisons.
Because characters and nonhuman objects have different properties and roles in the scene, we compute their saliency scores in distinct processes. In these processes, we compute individual scores that are necessary for computing the total score that represents saliency of an entity.
Characters perceive groups as single entities; hence, we use the term agent–group instead of agent–agent. The param-eters used are proximity, periphery, velocity, orientation, attractiveness, and height. The studies of Grillon et al.7 and
Oyekoya et al.8 and our observations on real-world crowd video examples motivated our choice of these six criteria as
parameters to the scoring function.
Proximity. For an agent, as the distance to an object or another agent decreases, the tendency for the agent to look at them increases. Due to the functionality of human visual system, closer objects seem larger than the ones that are far away. Also, objects behind the closer one are occluded and are hard to see.
Periphery. Human visual system is more active for the motions occurring in peripheral vision than the ones occurring out of this area. The attention is maximum when the object is entering periphery.
Orientation. An agent will be more attentive to objects that come through to it because in subsequent time steps, the object will be closer than the ones that are far away.
Velocity. Difference in velocity values grabs the attention of an agent. Generally speaking, objects with high velocity are salient; however, if the speed of the crowd norm is high, then a slowly moving object may be salient.
Attractiveness. Different from the above four criteria, attractiveness is a top-down saliency feature. As the attractive-ness of a character differs from the crowd norm's attractiveattractive-ness, the chances that it grabs attention are higher. Again, the crowd norm is an important factor in the resulting score.
Height. We choose this criteria because height is one of the most obvious physical properties that we can detect in a crowd. We consider an agent with a height value different from the norms of the crowd as salient.
We use the parameters proximity, orientation, velocity, and distinctiveness in agent–object saliency computation. As being the only parameter different from the agent–group saliency parameters, distinctiveness reflects the center-surround
mechanism used in saliency map computations. As the object becomes different from the neighboring objects, it grabs more attention. The distinctiveness parameter cannot be set by the user; it is computed as a function of the object type and attractiveness.
3.2
Saliency scoring
This module uses character groups and nonhuman objects that the agent can see as input and returns the most salient entity for the agent. It computes the scores for each saliency parameter of each entity (character groups and nonhuman objects), calculates a total saliency score for each entity, and selects the entity with the highest saliency for each agent. The pseudocode for saliency scoring is given in Algorithm 1.
' ' '
3.2.1
Determining viewed groups and objects
Because of the nature of human visual system, only the entities that are visible to the agent can visually attract the viewer. We have two lists for each character, “viewedGroups” and “viewedObjects”, which store groups and objects visible to each agent at time t, respectively. The viewed groups and objects are determined by three culling processes (cf. Algorithm 2), which provide input to the saliency scoring algorithm (Algorithm 1).
Proximity culling.For an agent, only the groups that stay at a distance are accepted, and the others are eliminated. We represent this distance by “maxViewDistance” parameter, meaning that agents cannot direct their gaze to other agents that are farther than the value of this parameter. The value of this parameter can be assigned with respect to properties of the scene.
Orientation culling.From the entities that passed the proximity test, we eliminate the ones that stay out of the visual angle of the agent. According to Strasburger et al.,77human peripheral angle ranges from 60◦up to nearly 180◦. We choose
the angle as 160◦, which is used as 80◦to the right and 80◦to the left of the agent's forward direction.
Occlusion culling.For the remaining viewed entities, we perform visibility tests for each agent to find out if these entities are occluded by another entity. We do this by ray casting from agents to the viewed entities. If the hit distance is shorter than the distance between the agent and the tested entity, then it is occluded by another object, which means that the agent cannot see the target entity. For this reason, we remove that group from the viewed groups list of the agent.
By doing these culling processes, we define a realistic field-of-view area for agents and improve computational perfor-mance with reduced number of comparisons. Even though there are more than 100 groups in the scene, an agent usually compares four or five groups at maximum in a single step.
3.2.2
Agent–group saliency scoring
In this step, we compute the total saliency scores of the viewed groups of agent a and choose the most salient one as “salientGroup”. To obtain the total saliency score, we first need to compute the individual scores of all saliency criteria, which are proximity, orientation, periphery, velocity, attractiveness, and height.
1. Given the agent's position pa, and the group's position pg, we compute the proximity score, Sp, as
S𝑝(t) = dm−dag dm ,
(1) where dagis Euclidean distance between two position vectors paand pg, and dmrepresents the maximum distance that agent a will stop looking after. Subtracting dagfrom dmensures that the closer agents have higher proximity scores. We divide the score by dmto normalize the value to the range [0, 1].
2. The velocity score, Sv, is based on the relative velocity of the group with respect to the crowd norm, and we compute it as
Sv(t) = ||vg−va|| − sn
max((Smax−sn), (sn−Smin)).
(2) The difference between the velocity of the viewed group (vg) and the velocity of the agent (va) gives the relative velocity. We compute the velocity score by subtracting the speed of the crowd norm from the magnitude of the relative velocity. We normalize the velocity score by dividing it by the maximum of (Smax−sn)and (sn−Smin); confirm Table 1.
3. The orientation score, So, is the relative direction of the group with respect to the agent, and we compute it as
So(t) =(𝜋
2 −𝛼 )
TABLE 1 Parameters for saliency scoring dm Maximum distance that an agent can see dag Euclidean distance between agent a and group g Smax Maximum pedestrian speed in crowd
Smin Minimum pedestrian speed in crowd
Sn Speed value of crowd norm pa 3D position of agent a pg Average 3D position of group g
pe 3D position of entity e (can be group or object) pt Target gaze position
fda Forward direction of agent a fdg Average forward direction of group g 𝛼 The angle between fdaand the vector pg−pa 𝛽 The angle between fdaand fdg
Cs The coefficient to simulate impact of speed on gaze behavior
For an agent, groups that have opposite directions will produce higher scores than those having similar directions. As the angle𝛼 increases, the orientation score decreases because the target is at the edge of periphery. To normalize So(t)
to the range [0, 1], we divide the score by (𝜋 × 𝜋
2) and take its square root. Moreover,𝜋 and
𝜋
2are the maximum values𝛽
and𝛼 can take because the orientation culling process eliminates groups that are located behind the agent (cf. Table 1). 4. We compute the periphery score, Spe, for evaluating groups that enter peripheral view cone as
S𝑝e(t) =(𝜋
2 −𝛽 )
𝛼. (4)
The minimum value of𝛽 and the maximum value of 𝛼 reflect the case where group g enters the periphery of
agent a. The normalization of Spe(t)is the same as the normalization of So. 5. We compute the attractiveness score, Sa, as
Sa(t) = ⎧ ⎪ ⎨ ⎪ ⎩ |ag−an| 1−an , if ag≥ an 0, otherwise , (5)
where agis the average attractiveness of group g, and anis the attractiveness value of the crowd norm. Sarepresents the relative attractiveness of the target group with respect to the crowd norm. The attractiveness property is in the range of [0,1].
6. We compute the height score, Sh, as
Sh(t) = ||h g−hn||
4𝜎 , (6)
where hgis the average height of the group, hnis the height of the crowd norm, and𝜎 is the standard deviation of the height in the crowd. We assume that the height value is normally distributed. Shis the z-score of hgdivided by 4𝜎, which indicates how much hgis different from hn.78The resulting value is in the range [0,1].
It should be noted that the equations for attractiveness, speed, and height scores use the absolute value of the differ-ences between the agent's parameters and the crowd norm parameters. This means that both a highly attractive agent and an agent with low attractiveness score—similar to a drunken man lying on the street—can be salient. The same applies for the speed and height.
We combine the individual scores as a single scalar value for each entity. The weighted sum function takes the individual saliency scores and generates a total saliency score, which is in the range [0, 1], as follows:
S(t) = Ca (
W𝑝S𝑝+WvSv+WoSo+W𝑝eS𝑝e + WaSa+WhSh )
where Wp, Wv, Wo, Wpe, Wa, andWhrepresent the predefined weights of six saliency criteria, which are proximity, velocity, orientation, periphery, attractiveness, and height, respectively. The weights of each subscore can be set by the user or set randomly as long as the sum of them is equal to 1. Cais a coefficient that corresponds to factors that affect the gaze behavior of agent a, which are speed and losing interest.
3.2.3
Agent–object saliency scoring
Because nonhuman objects have different properties from agent groups, computing saliency scores of objects requires the scoring of distinct criteria. However, the process is similar to agent–group saliency scoring. The criteria are proximity, velocity, orientation, and distinctiveness. The computations of proximity, velocity, and orientation scores are the same as the ones for the agent–group saliency scoring process (cf. Equations 1–3, respectively).
We compute the (unnormalized) distinctiveness score S′as
S′=
∑n i=1xi
x𝑗 , (8)
where n is the number of different object types that exist in the decided radius of object o, xiare the number of objects of each type, and xjis the number of objects of object o's type. This distinctiveness score is inversely proportional to the frequency of the object type, that is, the less frequent an object type is, the higher the score it gets. We normalize the distinctiveness score dividing the unnormalized value by the sum of the scores, as follows:
Sd= S ′ ∑n i=1S ′ i . (9)
We compute the total agent–object saliency score as
S(t) = Ca (
W𝑝S𝑝+WvSv+WoSo+WdSd )
, (10)
where Wp, Wv, Wo, andWd represent predefined weights of the four saliency criteria, which are proximity, velocity, ori-entation, and distinctiveness, respectively. Similar to the agent–group process, the sum of weights is equal to one, and Ca (Ca=Cs·Ci) is a coefficient that corresponds to factors that affect the gaze behavior of agent a.
The first parameter, Cs, represents the impact of walking speed on gaze behavior. We use the second one, Ci, to determine how fast an agent loses his or her interest on the salient entity. According to other studies3,66–68 and our observations
on videos of real crowds, the walking speed of an agent is inversely proportional with his or her motivation to look. As an example, running pedestrians look at the environment much less than slowly walking pedestrians. Not many studies show how much the speed affects the gaze behavior. According to our observations, we take the ratio of people to notice a salient event as 1.0 while walking at a speed less than or equal to 1 m/s and as 0.50 while running at 5 m/s. We linearly interpolate between these ratios for the intermediate speeds. We compute this effect as
Cs(t) = { 1 − 0.5 va vm−1.0, if va≥ 1 1, if va<= 1 , (11)
where vais the velocity of agent a, and vmis the maximum velocity defined in crowd norm. Ciis used as a coefficient to determine the total score by including the agent's interest. While the agent a is actively looking at an entity e, we decrease the score of e relative to a as the agent loses his or her interest (cf. Algorithm 5).
3.3
Adjusting gaze
We repeat saliency score computation process for all groups and objects viewed by the agent. After computing the total saliency scores, we determine the entity with the highest combined saliency score as the IP. The entity can be a group or a nonhuman object. When there exists only one entity e in the visual area of agent a, entity e gets the maximum saliency score. However, if e is not salient enough, agent a should not direct her gaze through e. To determine if an agent would look at an entity, we use two personality traits, shyness and curiosity, for the agent. The user needs to specify these values for each agent within the range [0, 1]. Shyness is simply the threshold for an agent to look at other agents. An agent with a high shyness value (introvert) looks at other groups much less than the agent with a low shyness value
TABLE 2 Parameters for gaze adjustment
Ci The coefficient to simulate the agent to lose her interest
minDur The minimum duration that an agent has to look after starting a gaze process maxDur The maximum duration that an agent can hold its gaze on the same target ΔTime The duration between current frame and the previous frame
Se The salient entity that the agent will direct his or her gaze through pat The vector from pato pt
rotAngle The angle to rotate head of agent in y-axis
(extrovert). We compare the score of the salient entity with the shyness threshold of the agent. If the score is higher than the threshold, the agent starts to look at the salient entity. The shyness threshold for an agent a is drawn from a normal distribution with the mean shynessaand the standard deviation shynessa∕3. The use of the curiosity parameter is similar; it determines whether an agent finds the salient object interesting or not (cf. Algorithm 3).
We execute gaze shifting with respect to the decided gaze state. The decision mechanism have the following four different states:
1. State 0. Look at front: In this state, the agent looks forward. We compute the target position as the summation of two vectors: pt=pa+fda.
2. State 1. Look through the direction of group: In this state, the agent looks in front of the group's center of mass: pt =
pg+fdg.
3. State 2. Look at a salient group: The target position is the average position of the salient agent group. 4. State 3. Look at a salient object: The target position is the position of the salient object.
We consider State 0 and State 1 as the default (idle) gaze behavior because the agents are not interested in the envi-ronment. When we decide the default gaze behavior, we select one of these two states randomly with the probabilities of
State 0and State 1 that are 0.7 and 0.3, respectively. State 2 and State 3 are active gaze behaviors, in which some entities in the environment grab attention. After deciding the gaze state, we apply gaze animation to the agent. Table 2 describes the parameters for gaze adjustment.
3.3.1
Gaze copy
When deciding the gaze of agents, another important process, gaze copying, takes place. Gaze copying is the result of the group behavior of crowds. When an agent is staring at an object in the scene, other agents that see her or him tend to look at that object. According to Gallup et al.,7926.9% of passersby adopt the gaze direction of the pedestrians who are already
staring. We include this feature in the model as intragroup gaze copying mechanism (cf Algorithm 4). The members of the same group are affected by each other's staring behavior. We determine this case randomly with a probability of 0.3.
However, in the case where multiple agents are staring at multiple entities, the decision gets complicated. To solve this problem, we choose the entity that is stared at by more agents as the staredOne entity. For example, in a group of four pedestrians, two of them are staring at object obj1 and one of them is staring at object obj2. Then, the remaining agent
starts looking at obj1if she copies the gaze. Moreover, in the case where the staring member counts are equal, we choose
3.3.2
Gaze shifting
The process is simply computing the required rotation angle and rotating the head object until it faces the target position, as follows: rotAngle = ∠ ( ⃗ 𝑓da, ⃗𝑝at ) , (12)
where ⃗𝑓dais the forward direction of agent a,𝑝⃗atis the vector from pt (target position), and pais the position of agent
a). After this step, agent a starts to look at tp, and gaze shifting is completed. Because we compute saliency scores and perform gaze shifting comparisons at every frame, characters automatically shift their gazes without delay.
3.3.3
Gaze duration
After an agent starts to look at another agent, if it does not stop looking after some time, then the model would generate unrealistic behavior. On the contrary, if an agent changes its gaze frequently, for example, in every 3-4 frames, again, this would generate unlikely motions. We specify the minimum and maximum gaze durations to solve this problem.
Minimum gaze duration (minDur).This is the amount of time that agent a must hold its gaze before shifting it to another object. We set the value of this parameter to 0.5 s to generate realistic gaze shift behaviors.
Maximum gaze duration (maxDur).This is the amount of time that agent a can hold its gaze before it loses its interest for the current salient entity. We set the parameter to approximately 6 s. However, losing interest does not occur instantly; instead, characters lose their interest slowly in time. So, maxDur parameter does not work as minDur, which changes gaze state sharply. We use another parameter, Ci, to simulate losing interest, which decreases at every time step, to be multiplied with the saliency scores (cf. Equations 7 and 10).
Algorithm 5 depicts the adjustment of interest coefficients for determining the gaze duration. When agent a looks at an entity e, Ciof e with respect to a decreases while those of other entities increase. After some time, the score of e will be lower than the thresholds of a (shyness/curiosity) or another entity's score, which causes a to automatically shift its gaze.
Can see any entity? Start/End
Compute saliency scores
Look at front or through direction of group Max score higher than threshold? Looked for minimum duration? Looked for minimum duration? Yes
Look at salient entity Yes No No No Yes Yes No FIGURE 2 Gaze decision logic
3.4
Implementation details
To construct a scene in which virtual crowd moves and gaze behavior of characters can be displayed, we prepare virtual scenarios in the Unity game engine4with respect to the videos that we shot in Middle East Technical University campus
market area. The crowd in the campus area can be considered as a closed group, compatible with the requirement for “crowd norm” property used in the proposed model.
Because the main goal of the proposed model is to predict IPs, we animate gaze by just rotating the character's head. We compute the rotation angle and apply the rotation to the head of the character. To achieve path finding, we assign NavMesh agent component to virtual characters. With the help of this component, agents can avoid each other and other moving or static obstacles while walking toward their target.
We determine the behaviors of agents with predefined rules and scoring functions as a result of the interaction with the environment and other agents. Figure 2 depicts the gaze behavior decision logic of an agent as a flowchart. In the diagram, “Start” represents the idle state where the agent stands before starting to a new action or after finishing the previous action. We first check the group component that the agent belongs to find out whether there exist any entities in the field of view of the agent's group. If there exist no entities, the agent's gaze enters the default gaze state, in which he or she looks in front or through the forward direction of the belonging group. However, if there are scene entities in the field-of-view area of the agent, then we compute the saliency scores of these entities. We compare the maximum score with the threshold values, shyness for groups and curiosity for objects. If the score passes the threshold, then the agent starts to look at the salient entity. Otherwise, she enters the default gaze state. For both cases where the agent looks forward or at the salient entity during the minimum gaze duration, the agent preserves his or her state. However, when the duration ends, the end state is reached.
4
E VA LUAT I O N A N D R E S U LT S
We record videos of people and analyze their gaze behavior. Along with the videos, we construct a virtual scene using Unity 3D game engine and simulate test scenarios in this virtual scene. We show that just by altering the parameters of characters and crowd norms, human gaze behavior can be simulated realistically. We execute the navigation process of virtual agents with the nav-mesh agent component of Unity and generate animations with the Unity locomotion package.
4.1
Scenarios
To verify the IP detection and gaze behavior of virtual crowds, we perform a series of simulations for predetermined scenarios. The purpose of these simulations is to validate the proposed gaze behaviors by comparing them with the gaze behavior of people appearing in the real videos. We recorded the videos used in the experiments in the same place in two different days. Please see the supplementary video for a comparison of the gaze behaviors of agents in the simulated videos with the real videos for various scenarios.
In the proposed model, mainly 10 different features have the impact on the gaze behavior of agents. We test each of these features in different scenarios and compare them with the corresponding videos to demonstrate their effects on attention. We set the physical parameters of the agents, such as speed and height, relative to each other. We set the maximum view distance for an agent to 15 m. In most of the scenes, we use the same values for crowd norm parameters and for the parameters that are not emphasized. Besides, the crowd norm parameters and weights used in our scenarios are determined experimentally and are suitable for the area in which we recorded the videos. They may differ depending on the location of the crowd and the scene under consideration. The default values for the parameters speed, attractiveness, and height are 1.0, 0.3, and 1.65, respectively. The default values for the weights of speed, proximity, orientation, periphery, height, and attractiveness are 0.12, 0.14, 0.12, 0.12, 0.20, and 0.30, respectively. For the personality properties, we set shyness and curiosity parameters by observing the gaze frequency and duration of agents in the real videos. Agents with relatively high gaze frequency and long gaze duration are assumed to have low shyness value.
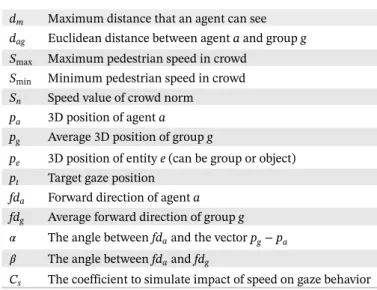
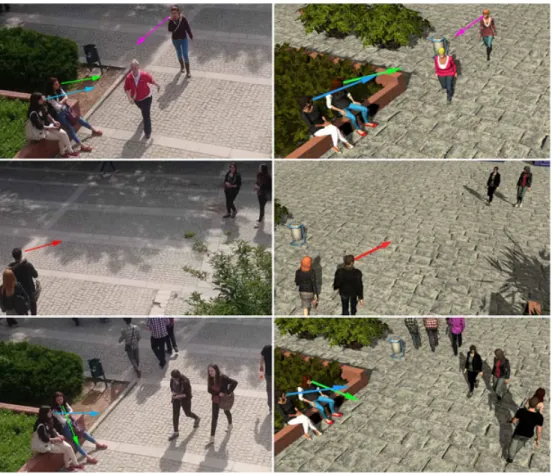
In the first scenario, we examined the effects of proximity, periphery, and shyness features. In the video, the walking female agent grabs attention for two reasons: she got closer to the male agents and she enters their peripheral view. Our implementation simulates this scenario with similar gaze behavior (cf. Figure 3). Male agents look at the female agent when she got closer and entered their periphery. To test the effects of these parameters, we set the weights of proximity and periphery parameters to zero in the second run of the simulation. As expected, none of the agents directs their gaze toward the female agent with this change. Then, we set the weight of proximity to its initial value but increase the weight of periphery to 0.8, to see the changes when periphery has more effect on gaze. With this configuration, male agents look at the female agent only when she is on the edge of their peripheral angle. After that, we increased the shyness value of the male agent to 0.6, to show that even with high periphery weight, shyness can prevent an agent to look at the salient target. In the next scenario, we examined the effects of agent velocity and orientation. In the video, a female agent with high velocity runs from the left side to the right side of the scene. Within all the agents, the running female agent is the
FIGURE 3 Effects of proximity, periphery, and shyness. Top left: video, top middle: simulation, top right: periphery and proximity weights = 0, bottom left: periphery weight = 0.8, and bottom right: periphery weight = 0.8; male agent shyness = 0.6
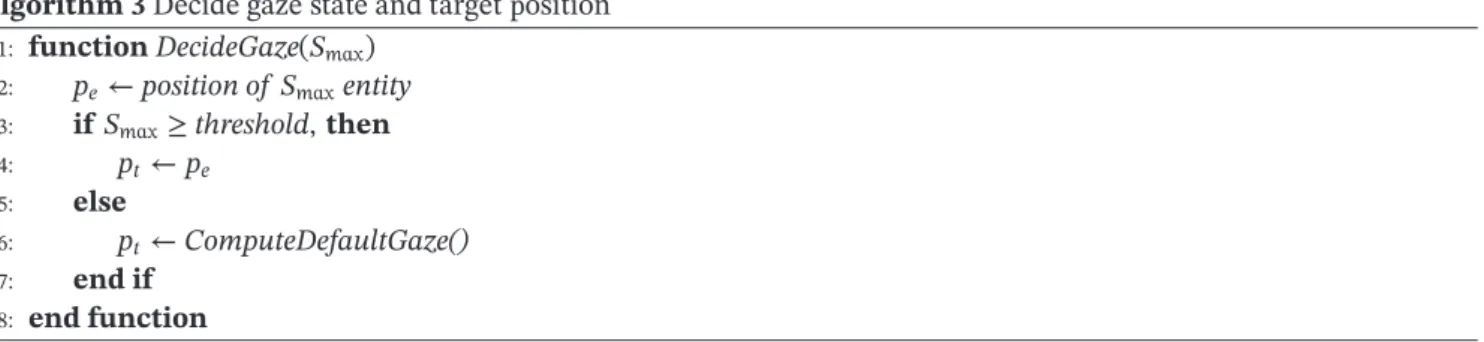
FIGURE 4 Effects of agent velocity. Top left: video, top right: simulation, bottom left: velocity weight = 0, and bottom right: orientation weight = 0.8
FIGURE 5 Effects of agent attractiveness. Left: video, middle: simulation, and right: agent's attractiveness = 0.4
most salient entity. Most of the other agents look at her while she runs without performing any gaze shifts. With the implementation of the proposed model, we obtain gaze behavior similar to the real video. In the simulation, three of the pedestrian agents look at the running female agent while she is running. Because velocity decreases the agent's gaze intention, the female agent looks only at her front. To demonstrate the effect of velocity, we run the simulation with
velocityWeightparameter set to zero. In this case, the running female agent cannot not grab attention from the crowd (cf. Figure 4). Afterwards, we test how orientation affects this scene, so we increase the orientation weight parameter of the scene. As a result, the agents prioritize the targets that stay closer to the center of their views.
Another scenario aims to show the effects of attractiveness parameter. In the captured video, an attractive female agent walks through the left side of the scene, and a male agent directs his gaze toward her. In the virtual scene, we set the female agent's attractiveness parameter to 0.8, which is quite a high value. In this condition, due to the attractiveness score of the female agent, she grabs attention. However, when we decrease the attractiveness parameter to 0.4, which is still above the crowd norm for this scenario, the female agent cannot grab attention (cf. Figure 5).
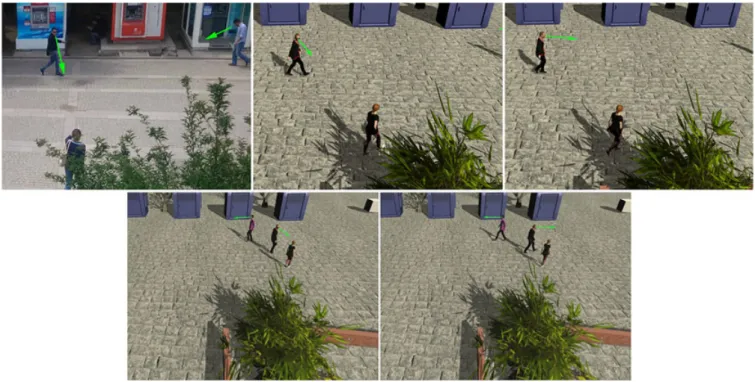
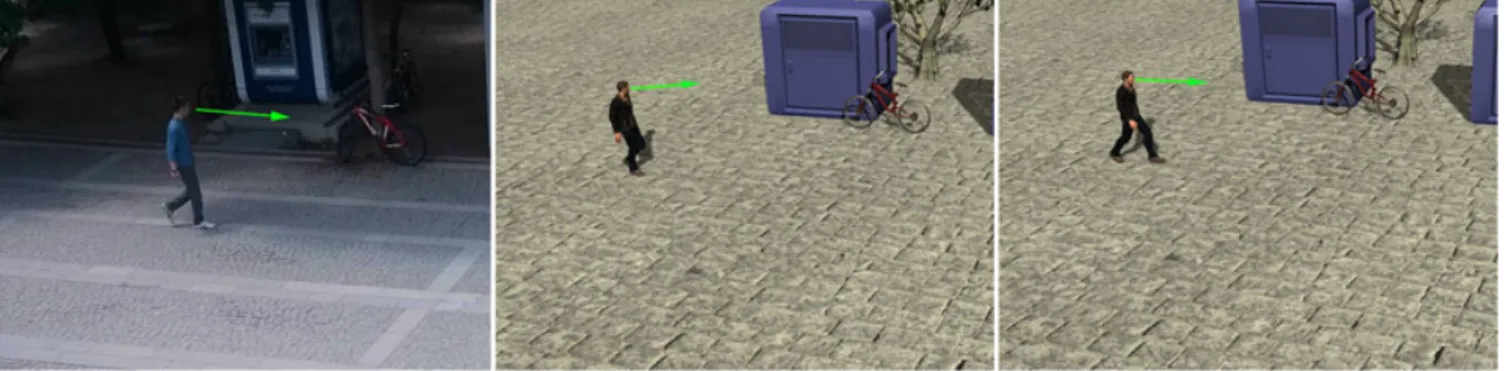
With another scenario, we aimed to indicate the impact of distinctiveness parameter of nonhuman objects. In the video, the bicycle is the most salient entity in the scene, and so, the agent passing by directs his gaze toward the bicycle. We generate a similar gaze behavior in the simulation with the use of the distinctiveness parameter (cf. Figure 6). In the neighborhood of the bicycle object, it is the only object with type vehicle. Other than the bicycle, there are automated teller machines and trees, whose types are building and vegetable, respectively. Being a rare type of object in the neighborhood results in a high distinctiveness score for the bicycle, which makes it the most salient entity for the agent. In the second run, we set the weight of distinctiveness parameter to zero, and as a result, the agent does not look at the bicycle.
The next scenario demonstrates the gaze copy phenomena between the agents. In the video, we can observe the gaze copy behavior on the sitting couple. First, the male agent looks at one of the passing agents, then the female agent sitting
FIGURE 6 Effects of object distinctiveness. Left: video, middle: simulation, and right: distinctiveness weight = 0
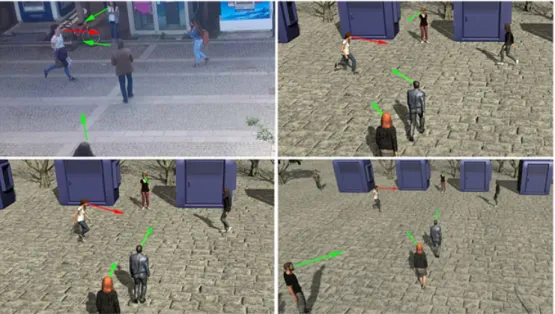
FIGURE 7 Still frames showing the effects of gaze copy. Top row: video frames, middle row: simulation frames, and bottom row: female agent shyness = 0.2
next to him copies this behavior and starts to look at the same passing agents. In the simulation, we generate the gaze copy phenomenon by setting the male agent's shyness parameter to 0.3 and the female agent's shyness parameter to 0.7. This results in a situation where the male agent is more attentive than the female agent. Because they are in the same group, the female agent copies the gaze behavior of her group member, as seen in Figure 7. In this case, one of the reasons that causes the gaze copy is the high shyness value of the female agent. When we decrease the shyness of the female agent, she looks at the salient agent without triggered gaze copy feature.
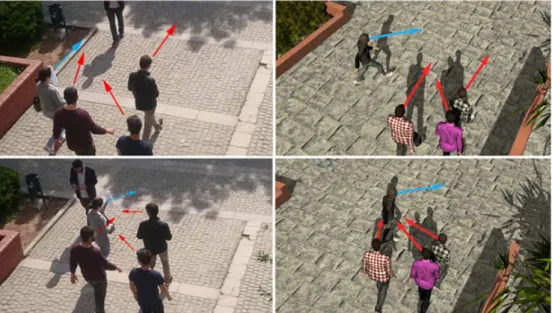
With another scenario, we show the effect of the periphery feature where the agents gaze at the other agents in their periphery. In Figure 8, the first row shows frames from the real video, and the second row shows frames from the simulation results.
We show the effects of height and proximity in the same scene. We increase the weight of height and proximity in order. When the weight of height is increased, the male agents tend to look at the tall male agent who walks through them. However, when the weight of proximity is increased, the agents prefer to look at the closest targets, as seen in Figure 9.
FIGURE 8 Effects of periphery. Left column: the real video, and right column: the simulation result
FIGURE 9 Effects of object height and proximity together with periphery. Left: height weight = 0.4, and right: proximity weight = 0.4
FIGURE 10 Effects of grouping factor. Left: female agents belong to the same group, and right: each female agent has own group
The next scenario shows the grouping effect with a generated virtual scene. In this scene, there are two female agents: one with a high attractiveness (0.7) value and the other with a low attractiveness value (0.2); the crowd norm attractiveness value is set to 0.2. When these two female agents are in the same group, the average score of the group is used for saliency score computation because of the ensemble coding mechanism. There is a shy male agent with a shyness value of 0.45. The average saliency score of the female group is not enough to grab the attention of the male agent (cf. Figure 10, left). However, when each female agent walks individually, that is, they are not in the same group, the attractive female agent grabs the attention of the male agent (cf. Figure 10, right).
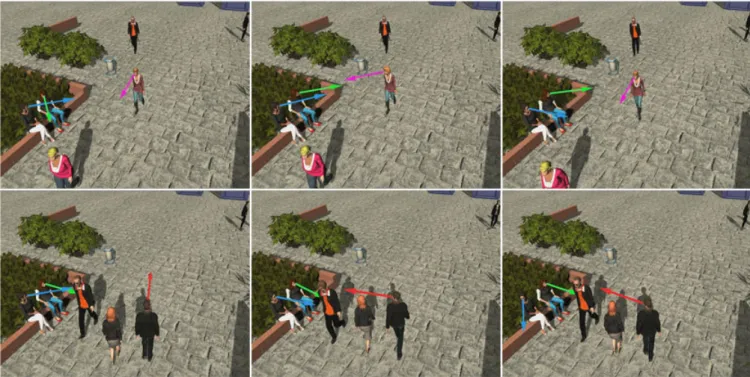
The last scenario demonstrates the effectiveness of the proposed model by simulating a relatively long video. With this scenario, we also observe the effect of low speed by looking at sitting female agents; they change their gaze more frequently than the moving agents. In Figure 11, the images on the left column belong to the captured video frames, and the images on the right column belong to the simulation frames. Using the same setting, we also show the effects of a change applied
FIGURE 11 Still frames from a 40-s video. Left column: the real video, and right column: the simulation result
FIGURE 12 Effects of increased crowd norm attractiveness. Top: standard simulation, and bottom: crowd norm attractiveness = 0.8
on crowd norms. We set the crowd norm attractiveness to 0.8. As a result, the agents with low attractiveness become more salient than the agents with high attractiveness, as seen in Figure 12. Finally, we test the effects of proximity and orientation parameters (cf. Figure 13). When we increase the weight of proximity, the agents tend to look at the closest agents to themselves. Then, we increase the weight of orientation. As expected, agents prioritize the targets that stay closer to the center of their views.
FIGURE 13 Left: standard simulation, middle: increased proximity weight, and right: increased orientation weight
These scenarios demonstrate the capabilities of the proposed approach. Some of the scenarios especially aim to demon-strate the key differences of our approach from the state-of-the-art techniques. In the first scenario, we indicate the effects of shyness parameter along with other parameters (cf. Figure 3). Although the female agent gets high proximity and periphery scores, the increased shyness value of the male agent prevents him to look at her. In the fifth scenario, we show how gaze copy feature causes an agent to look at a specific target (cf. Figure 7). The saliency score of the target agent can-not pass the threshold of the viewer agent without the gaze copy feature. Lastly, in the eighth scenario, we can see how the group-based approach and its implementation using ensemble encoding alter an agent's gaze behavior. In this case, the overall group properties prevent the attractive group member to grab attention.
4.2
Performance
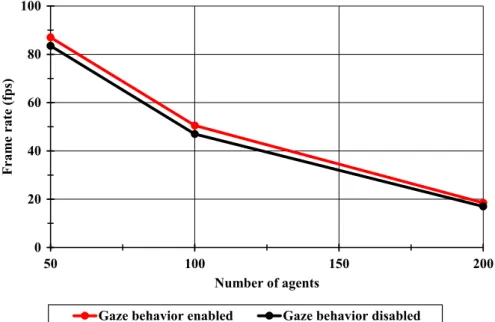
To test the scalability of the framework, we run simulations containing 50, 100, and 200 agents on a PC with Intel Core(TM) i5-4590 3.30GHz CPU, 8GB RAM, and Nvidia GeForce GTX 970 graphics processor. Figure 14 shows a simulation with 100 agents, where we first disable gaze copy behavior scripts (top) and then enable them (bottom).
Figure 15 depicts the frame rates (frames per second) for different number of agents where gaze behavior scripts are disabled and then enabled. The graph demonstrates that the effect of IP scoring on the frame rate is quite small compared with other computational costs. We can see that from the difference between the two recorded frame rates, one is with IP scoring and the other one is without IP scoring.
4.3
User perception study
In order to validate our approach and learn how the features used in the model are understood by a viewer, we conducted a user perception study. The perception study was performed as an online video evaluation in which 58 participants volunteered to take place. The participants are between 20 and 30 years old; 12 participants are undergraduate students, 9 are university graduates, and the remaining are graduate students.
In the perception study, we asked the participants two categories of questions (cf. Gaze Simulation Perception Study document in the Supplementary Material). The first category requires participants to evaluate the realism of the simula-tion videos. For this part, they watched eight video couples. A video couple consists of a recorded real video and a virtual video that simulates the real video. We asked the participants to rate the realism of gaze behavior in simulation videos
FIGURE 14 A crowd simulation with 100 agents. Gaze behavior scripts are first disabled (top) and then enabled (bottom). When the gaze behavior script is enabled, the agents on the bottom left look at the salient object, bicycle. The agents on the top left either look at the teddy bear or look at each other depending on the proximity and periphery scores of teddy bear. The ones on the middle mostly look at the teddy bear
0 20 40 60 80 100 50 100 150 200 F r am e r ate (fps) Number of agents
Gaze behav or enabled Gaze behav or d sabled
FIGURE 15 Frame rates in frames per second (fps) for different number of agents with and without gaze behavior
from 1 to 5, considering that the real-world videos get 5 points. We used the scenarios described in Section 4.1. The first seven videos demonstrate the effects of parameters attractiveness, periphery, proximity, speed, shyness, gaze copy, and distinctiveness. The last video demonstrates the combination of multiple parameters. After watching each of eight video couples, users were asked the question: Please rate the realism of the gaze behavior in the simulation video from 1 to 5. The
TABLE 3 The results of the one-tailed t test on the first part of the perception study showing the users' assessment of the realism of the simulation videos
Feature Mean Standard tstatistic p Decision at
𝜶 level = 0.05
Attractiveness 4.534 0.649 6.266 < 0.0001 Fail to Reject Periphery 4.275 0.846 2.476 0.0163 Fail to Reject Proximity 4.413 0.644 4.884 < 0.0001 Fail to Reject Speed 4.315 0.841 2.853 0.0060 Fail to Reject Shyness 4.327 0.774 3.218 0.0021 Fail to Reject Gaze copy 4.344 0.799 3.279 0.0018 Fail to Reject Distinctiveness 4.534 0.834 4.876 < 0.0001 Fail to Reject Combined 4.500 0.793 4.802 < 0.0001 Fail to Reject
TABLE 4 The results of the one-tailed t test on the second part of the perception study showing how much a viewer can perceive the impact of a specific feature
Feature Observed zstatistic p Decision at
frequency 𝜶 level = 0.05
Periphery 75.4 3.869 0.0001 Fail to Reject Proximity 70.2 3.077 0.0021 Fail to Reject Height 71.9 3.336 0.0009 Fail to Reject Speed 91.2 6.275 < 0.0001 Fail to Reject Shyness 80.7 4.676 < 0.0001 Fail to Reject Gaze copy 78.9 4.402 < 0.0001 Fail to Reject Distinctiveness 87.7 5.742 < 0.0001 Fail to Reject Grouping factor 75.4 3.869 0.0001 Fail to Reject Crowd norm 70.2 3.077 0.0021 Fail to Reject
The answers that evaluate the realism are Likert-scale ratings, and we use their mean values. By using the mean and standard deviation values, we applied one-tailed t test for each question. Our hypothesis was that the average score given for the realism of gaze behavior in simulation videos would be higher than 4.0 over 5.0.
• H0: The average score for realism≥ 4.0 • Ha: The average score for realism< 4.0
This analysis shows that for the questions about scoring the realism of gaze behavior in simulation videos, the scores are statistically significant with p< 0.05 for all questions. The results of the one-tailed t test on the first part of the perception study are shown in Table 3.
The second category of questions aims to evaluate how much a viewer can perceive the impact of a specific feature in the simulation. In the second part of the study, participants were asked to watch nine videos and answer a question after watching each video. We assess the impacts of the following features: periphery, proximity, height, speed, shyness, gaze copy, distinctiveness, grouping factor, and the crowd norm. For each question, there is only one correct answer, and a user can pick only one of the five choices. We looked at the rate of correct answers. From Table 4, we notice that the viewers can perceive the effects of given specific features in the simulation with a high success rate. Because the sample size is larger than 30 (58 participants), we conducted one-tailed t test for each question. Our hypothesis was that more than 50% of the population would perceive the feature that was emphasized, meaning that they would choose the right answer among five choices.
• H0: The proportion of perceiving the feature≥ 0.5 • Ha: The proportion of perceiving the feature< 0.5