Full Terms & Conditions of access and use can be found at
https://www.tandfonline.com/action/journalInformation?journalCode=rael20
Applied Economics Letters
ISSN: 1350-4851 (Print) 1466-4291 (Online) Journal homepage: https://www.tandfonline.com/loi/rael20
Performance of the efficient frontier in an
emerging market setting
Aslihan Altay-Salih , Gülnur Muradoglu & Muhammet Mercan
To cite this article: Aslihan Altay-Salih , Gülnur Muradoglu & Muhammet Mercan (2002)
Performance of the efficient frontier in an emerging market setting, Applied Economics Letters, 9:3, 177-183, DOI: 10.1080/13504850110054067
To link to this article: https://doi.org/10.1080/13504850110054067
Published online: 07 Oct 2010.
Submit your article to this journal
Article views: 47
Performance of the e cient frontier in an
emerging market setting
A S L I H A N A L T A Y - S A L I H , G UÈ L N U R M U R A D O G L U{* and M U H A M M E T M E R C A N{
Bilkent University, Faculty of Business Administration, 06533 Ankara, Turkey,
{Manchester School of Accounting and Finance, East Booth Street, M13 9PI,
Manchester, UK {Yapi Kredi Bankasi, YapiKredi Plaza, Maslak, Istanbul, Turkey.
This study applies the Markowitz analysis to the Istanbul Stock Exchange and empirically investigates the performance of this tool in an emerging market setting. The results show that during the early years of establishment of an emerging stock exchange, an active strategy of mean variance portfolio, investing with monthly balancing, outperforms the passive strategies. However, at later stages the capital market liberalization changes market participants. Together, with the increase in foreign participation and integration of the market with the rest of the world, the performance of means variance e cient portfolios detoriate. The study also reports that the strategy is not eVective during ®nancial crisis.
I . I N T R O D U C T I O N
Investment decision centres around two important ques-tions. The ®rst question is the selection of assets. Second question is how much money should one allocate into each asset. Markowitz (1959) study answers both questions in an intuitive way. His technique, which is known as the mean-variance portfolio analysis, is based on the basic trade-oV facing the investor: risk versus expected return. A portfolio is said to be e cient, if it yields the maximum return given the level of risk. Then the investor chooses among a set of e cient portfolios, called the e cient frontier, according to his/her preferences for risk and return. The idea is intuitive and appealing and the tech-nique requires a straightforward maximization procedure. Besides, all that is needed to estimate the e cient frontier is the past asset returns. Therefore, since its introduction, over the past few decades, mean-variance analysis has always been a major tool for security selection, asset allo-cation and, performance evaluation for practitioners.
Academic concern was intensive as well. Besides theor-etical contributions, empirical and methodological papers
contributed a lot to the development of the mean-variance analysis. However, almost all of the academic work is focused on the developed markets, especially the US mar-ket. The empirical evaluation of the mean variance analysis in developed markets dates back to 1967 (Cohen and Pogue, 1967). In order to show that the e cient frontier clearly dominated the randomly generated portfolios and was not dominated by the mutual funds. Later many studies concentrated on the practical usage of and metho-dological issues about the mean variance analysis in devel-oped markets. For example, Jabson and Korkie (1981), Alexander and Francis (1986), Frost and Savarino (1988), Michaud (1989), Best and Grauer (1991), Jorion (1992), Chopra and Ziemba (1993) studied the eVects of input estimation errors on the practical usage of the mean variance analysis.
This empirical study analyses the time series perform-ance of mean variperform-ance e cient portfolios in an emerging market setting. The underlying dynamics of an emerging economy is quite diVerent from its mature counterparts. These markets are better characterized by frequent and rapid changes in the fundamentals of their economic and
Applied Economics Letters ISSN 1350±4851 print/ISSN 1466±4291 online # 2002 Taylor & Francis Ltd http://www.tandf.co.uk/journals
DOI: 10.1080/13504850110054067
177 * Corresponding author. E-mail: [email protected]
®nancial settings, triggered by recurrent structural changes caused by the integration of these markets with the rest of the world. Practitioners and academicians in mature markets have used the Markowitz portfolio optimization model, extensively as a tool for security selection and asset allocation. This popular model is theoretically proven and easy to implement. After many years of extensive use, the model is a familiar tool for the international investor. Therefore the performance of this model in a rapidly changing emerging market environment, where return and volatility modeling is problematic, is of interest for the global portfolio manager as well as the academicians.
In this study, stocks traded at Istanbul Stock Exchange (ISE), the eighth largest market in Europe, are used to construct the e cient frontiers since the establishment of ISE ± i.e. during the 1986±1997 period. Assuming that the investor reconstructs the portfolios on a monthly basis, monthly stock returns are used to estimate the e cient frontier. For each month, the prior 24 months are used to construct the variance covariance matrix, and to esti-mate the expected returns. This methodology tries to account for the time varying return distributions observed in emerging markets as documented in Bekaert et al. (1998). Using overlapping periods, the monthly time series of e cient frontiers was obtained.
The performance of the e cient portfolios was evaluated by using two benchmarks. First, for each month an e cient portfolio was chosen that matches the risk of the ISE-100 Index. Then ex-post performance of this portfolio is com-pared with the performance of the ISE-100 index and IFC-Turkish index. Next, for each month the minimum risk portfolios were chosen and their returns compared with that of the risk free rate. If the risk free rate was greater than the minimum risk portfolio return, one invested in the risk free rate, otherwise one invested in the minimum risk portfolio. The same exercise was repeated for the maxi-mum risk portfolio. The ex-post performance of these port-folios were evaluated considering their Sharpe ratios, and the ISE-100 index as a benchmark.
The results demonstrate that the performance of the mean variance e cient portfolio is better than ISE-100 and IFC Turkish indices during the early years of the exchange between 1989±1993. However, with the increase in foreign participation and higher integration of the market with the rest of the world, coupled with a severe currency crisis in 1994, the performance of mean-variance e cient portfolios detoriated after 1993.
Accordingly, the paper is organized as follows. Section II discusses the data and methodology in detail. Section III discusses the results, and Section IV is devoted to the con-clusions and future research ideas.
I I . D A T A A N D M E T H O D O L O G Y
The monthly price series for all the companies trading in Istanbul Stock Exchange (ISE), the ISE-100 index, and the IFC-Turkish index between 1986±1997 is obtained from the Datastream. All the monthly returns are calculated using the end of month closing prices denominated in Turkish lira. The monthly price series are adjusted for cash and stock dividends, and right oVerings. In order to avoid problems due to thin trading only the companies that ranks among the ®rst 100 in terms of trading volume are included in our data set.1
Rtˆ
pt¡ pt¡1
pt¡1 …1†
Following the standard theoretical model of Markowitz (1952), for each month expected return E…Ri†, variance
…¼ii†, and covariance …¼ij† of the particular stock with the
other stocks are calculated using data from the prior 24 months. A stock must have at least prior 20 months of data to be included in that month’s sample of stocks. The following, familiar, formulizations of portfolio return and variance is used to generate e cient portfolios that have minimum risk for any given level of return.
E…Rp† ˆ R0W VAR…Rp† ˆ W0SW 10W ˆ 1 and wi> 0 …2† E…Rp†R0W VAR…Rp† ˆ W0§W 10W ˆ 1 and wi> 0 …3†
where R is …1 £ N† row vector of expected returns, W is the (NX1) column vector of weights held in each asset, andS is the …N £ N† variance-covariance matrix, and …wi> 0† ensures that short selling is not permitted, as it is extremely di cult to short sell stocks in Turkey. This constrained optimization problem is solved using an optimizer, which employs the critical line algorithm as outlined in Markowitz (1991) to ®nd the e cient frontier.
I I I . R E S U L T S
The study ®rst reports results pertaining to comparisons of the mean-variance e cient portfolios and the two
bench-178
A. Altay-Salih et al.
1
mark indices. In order to make comparisons meaningful, the mean variance e cient portfolio (MV) that has the same variance with the ISE-100 index is chosen. The active investment strategy is to invest in the MV portfolio at the beginning of the month, sell all our position at the end of the month, invest in the next months MV portfolio, and ignore the transactions costs. This way we update our inputs every month by including the most recent develop-ments in the market.
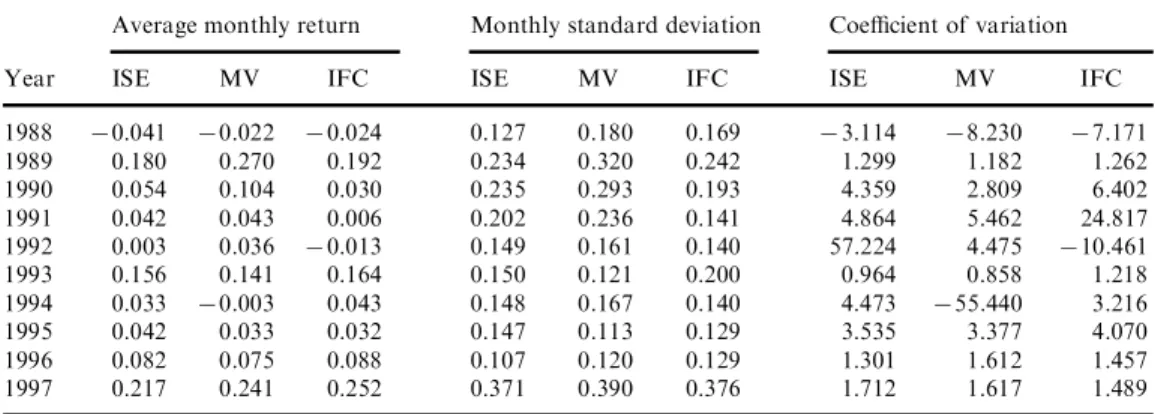
Ex-post returns for the above strategy and the two pas-sive strategies of investing in the benchmark ISE-100 index and IFC -Turkish Index for the whole period are calculated and reported in Table 1. For the period covering the years 1988 through 1992, MV portfolios have the highest expected return for ®ve consecutive years. This shows that our active strategy beats the passive strategies with comparable risk bearing, i.e. the investments in the ISE-100 index and IFC Turkish Index. However, after 1993 two passive strategies of investing in the indices outperform the MV portfolios. Coe cient of variations, measure of risk per unit of return, also show that the active MV strategy has the lowest level of risk in 1989, 1990, 1992, 1993 and 1995. In 1994 MV strategy performs very badly. It must be mentioned here that in 1994 Turkey has gone through a major ®nancial crisis that caused structural changes in market dynamics of ISE.2
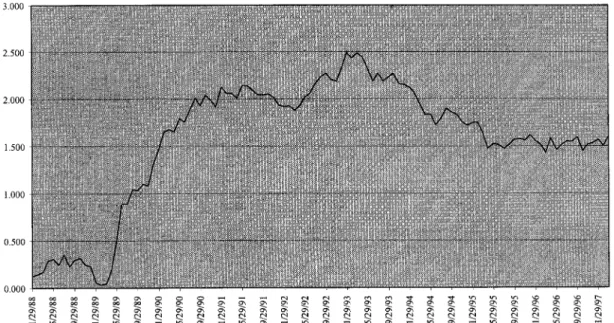
Fig. 1 shows the cumulative returns an investor would have obtained in excess of ISE-100 Index, by following the MV strategy, throughout the research period from 1988 to 1997. Note here that the investor does not bear any additional risk by investing in the MV strategy rather than investing in the ISE-100 Index. As can be seen
from Fig. 1 if an investor were to follow this strategy during the period Jan 1989 through March 1993, he/she would have earned 244% more than the ISE-100 index. However if the investor were to follow same strategy after March 1993 he/she would have made 83% less than the alternative passive strategy of investing in ISE-100 index. What could be the reason for such a drastic change in the performance of this strategy?
Fig. 3 shows the foreign investment in US Dollars in the Istanbul Stock Exchange.3 Over the research period two important events happened during 1992 and 1993 in the history of the exchange that increased the foreign partici-pation. The ®rst one is the acceptance of the ISE as a full member of the FIBV (Federation Internationale des Bourses de Valeurs) on October 1992. The second one is the recognition of the ISE by the United States Securities and Exchange Commission as a `Designated OV-Shore Securities Market’. On October 1993. After these two im-portant milestones, foreign participation has increased from 10% in 1993 to 56% of the total market capitalization towards the end of 1997.
Increased foreign participation mainly in the form of institutional investors, actually increased both the quality of the available information and the sophistication level of the market participants. As Turkey became more inte-grated with the world markets through foreign par-ticipation, past information alone become insu cient to construct input estimates of expected returns and variance-covariance matrix estimates. The same point is also made for the developed markets in many academic studies.4
Table 1. Ex-post comparison of mean variance e cient portfolios with ISE-100 and IFC Turkish index
Average monthly return Monthly standard deviation Coe cient of variation Year ISE MV IFC ISE MV IFC ISE MV IFC 1988 70.041 70.022 70.024 0.127 0.180 0.169 73.114 78.230 77.171 1989 0.180 0.270 0.192 0.234 0.320 0.242 1.299 1.182 1.262 1990 0.054 0.104 0.030 0.235 0.293 0.193 4.359 2.809 6.402 1991 0.042 0.043 0.006 0.202 0.236 0.141 4.864 5.462 24.817 1992 0.003 0.036 70.013 0.149 0.161 0.140 57.224 4.475 710.461 1993 0.156 0.141 0.164 0.150 0.121 0.200 0.964 0.858 1.218 1994 0.033 70.003 0.043 0.148 0.167 0.140 4.473 755.440 3.216 1995 0.042 0.033 0.032 0.147 0.113 0.129 3.535 3.377 4.070 1996 0.082 0.075 0.088 0.107 0.120 0.129 1.301 1.612 1.457 1997 0.217 0.241 0.252 0.371 0.390 0.376 1.712 1.617 1.489 Notes: (1) MV portfolio is the e cient portfolio that has the same ex-ante variance with the ISE-100 index (2) The monthly standard deviations for each year are calculated from the monthly e-post returns for each portfolio.
(3) The coe cient of Variation (CV) is obtained by dividing the ex-post standard deviation with the ex-post average monthly return.
(4) 1997 covers only ®rst three months of that year.
2
See Muradoglu et al. (1998) for a detailed analysis of the crisis at ISE.
3This information is obtained from the Istanbul Stock Exchange Web Site. www/.ise.org 4
Apart from foreign participation, Turkey has gone through a major ®nancial crisis in 1994. Therefore infor-mation that is contained in the prices before 1994 might very well be irrelevant for the forecasts after 1994. Taking this into account, two years of past data might be too long for an emerging market like Turkey where the character-istics of asset returns can change rapidly.5
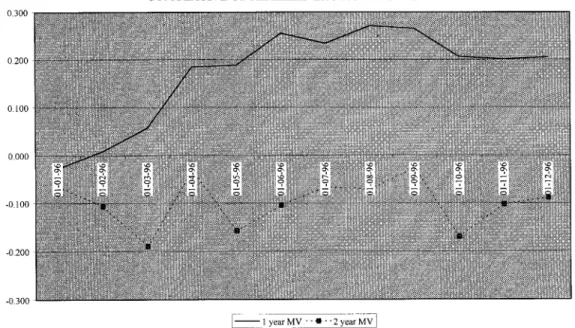
Hence, a test is conducted for the eVect of estimation period on the performance of the MV, by using a diVerent estimation horizon for inputs. This experiment is done for 1996 using an estimation period of the past 12 months, the same MV strategy is employed and compared with the results obtained from an estimation period of past 24 months. 1996 was chosen as the test period, as the perform-ance of MV analysis during 1996 with two years of past data is inferior to the passive strategies, besides the input estimation period 1995, is not contaminated with the eVects of the crisis.
Fig. 2 depicts the cumulative returns in excess of ISE-100 obtained from the MV analysis with two diVerent estima-tion horizons. The solid line is the MV analysis conducted with the estimation period of past one year, dotted line is the same analysis with an estimation period of past two years. The performance of the MV strategy changes dras-tically with the introduction of the shorter one-year estima-tion period. The shorter estimaestima-tion period of one year, which uses more recent data, supplies better inputs for the MV analysis.
Bekaert et al. (1998), argue that the standard mean vari-ance analysis is problematic in emerging markets as the
return distributions are not normal and cannot be com-pletely characterized by mean and variance alone. They document that there is signi®cant time varying skewness and kurtosis in these returns. The distributional character-istics of excess returns from the MV strategy are reported in Table 2 along with those of the ISE-100 and IFC indices. These statistics are reported for the whole period and two sub-periods. In the ®rst sub-period the MV strategy is suc-cessful in the second period the performance of the MV strategy is inferior to passive strategies. Our results show that for all the periods, all three strategies exhibit positive skewness and excess kurtosis, the MV strategy has the highest positive skewness for all the periods, which is desir-able as investors have a preference over positive skewness. Turkish market is also characterized by high risk free rates, therefore market timing or appropriately switching between the ®xed income securities and the equities might create higher returns for portfolio managers. Therefore, two ad hoc strategies were created. This ®rst (second) strat-egy is devised for an investor with a lower (higher) risk aversion parameter and is called the minimum (maximum) risk strategy.
Minimum Risk Portfolios (MinRP) are constructed as follows: At the beginning of each month expected returns for e cient portfolios are calculated. The expected return of the minimum risk portfolio on the e cient frontier is compared with the expected risk-free rate. If the expected return on the minimum risk portfolio is greater, one invests in the minimum risk portfolio, if not we invest in the risk-free rate. Maximum Risk Portfolios (MaxRP) are
con-180
A. Altay-Salih et al.
Fig. 1. Cumulative returns of the mean variance e cient portfolios in excess of ISE-100
5
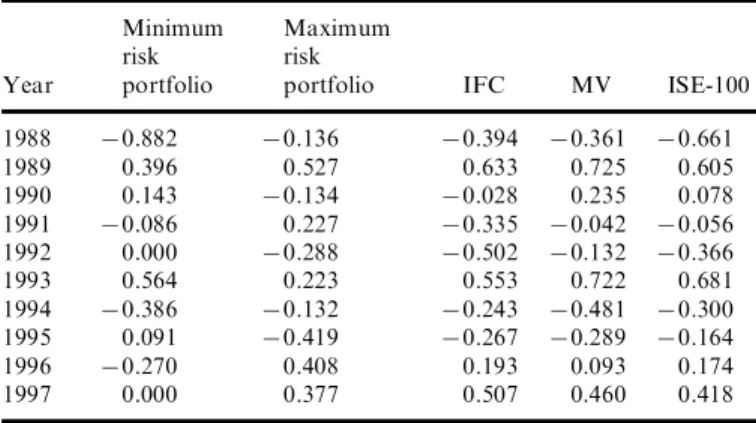
structed similarly. If the expected return on the maximum risk portfolio is greater, one invests in the maximum risk portfolio, if not, one invests in the risk-free rate. Realized average monthly returns and standard deviations of these two strategies are reported in Tables 3 and 4 respectively. The Sharpe Ratios for these strategies along with the active MV strategy and passive ISE-100 and IFC Turkish Indices are given in Table 5. Sharpe ratios are calculated by divid-ing average monthly returns in excess of the risk free rate with the monthly standard deviations. The results show that within these 10 years 30% of the time MV strategy, 40% of the time MaxRP, 10% of the time IFC, 20% of the time MinRP outperformed other strategies.
I V . C O N C L U S I O N S
The results show that during the early years of an emerging market, an active strategy of mean variance portfolio investing with monthly balancing outperforms the passive strategy that invests in indices. However, with the increase in foreign participation and higher integration of the market with the rest of the world, the performance of mean variance e cient portfolios detoriated.
Fig. 2. Cumulative excess returns of the mean variance e cient strategy with two diVerent estimation periods
Table 2. Descriptive statistics
ISE-100 IFC MV 1988±1997 March Mean 0.07 0.06 0.08 Median 0.023 0.026 0.037 Standard Deviation 0.185 0.185 0.218 Skewness 1.019 1.109 1.026 Kurtosis 1.462 1.548 1.402 1988±1993 March Mean 0.05 0.04 0.09 Median 0.004 70.001 0.018 Standard Deviation 0.201 0.195 0.254 Skewness 1.143 1.148 0.912 Kurtosis 1.392 1.242 0.399 1993 April±1997 March Mean 0.08 0.09 0.06 Median 0.072 0.049 0.043 Standard Deviation 0.161 0.170 0.161 Skewness 0.910 1.282 0.900 Kurtosis 2.018 2.873 3.652
Table 3. Average monthly returns from minimum risk portfolios
Minimum risk Minimum risk Risk-free portfolio portfolio
Year rate returns st. deviation 1988 0.043 70.024 0.076 1989 0.038 0.056 0.045 1990 0.036 0.063 0.190 1991 0.053 0.040 0.154 1992 0.057 0.057 0.003 1993 0.053 0.121 0.119 1994 0.078 0.031 0.121 1995 0.066 0.075 0.103 1996 0.064 0.050 0.064 1997 0.062 0.062 0.003 Average monthly
return for the
period 1988±1997 0.054 0.052 0.111 Number of months
invested in risk
free-rate 52 out of 111
Notes: minimum risk portfolios are constructed as follows: at the beginning of each month, expected returns from e cient portfolios are calculated. If the expected return from minimum risk portfolio is greater than the expected risk free rate, we invest in the minimum risk portfolio. Otherwise we invest in the risk free rate.
The analysis after 1993 showed that the estimation per-iod for the inputs is extremely important in an emerging market setting. As the study is trying to forecast future expected returns, variances and covariances from the his-torical data, in an environment where structural breaks occur frequently, shorter estimation periods yield better results. The results demonstrated that, even two years of past data is too long for the estimation of the inputs and that better performance was achieved with one year of past data.
Finally, Markowitz framework is an extremely powerful tool for e cient processing of limited information in the form of past prices. However, the quality of the processed information is crucial for the practical usage of this meth-odology. This issue becomes even more important for emerging markets where past data might be contaminated with drastic changes in the characteristics of the asset returns. Further research is expected to concentrate on the improvement of portfolio selection and asset allocation techniques in emerging markets.
R E F E R E N C E S
Bekaert, G., Erb, C. B., Harvey, C. R. and Viskanta, T. E. (1998) Distributional characteristics of emerging market returns and asset allocation, Journal of Portfolio Management, 102±16.
182
A. Altay-Salih et al.
Table 4. Average monthly returns from maximum risk portfolios
Maximum risk Risk-free Maximum risk portfolio Year rate portfolio returns st. deviation 1988 0.043 0.018 0.183 1989 0.038 0.170 0.249 1990 0.036 0.011 0.181 1991 0.053 0.141 0.389 1992 0.057 70.004 0.213 1993 0.053 0.107 0.242 1994 0.078 0.017 0.458 1995 0.066 70.012 0.186 1996 0.064 0.173 0.270 1997 0.062 0.321 0.689 Average monthly
return for the
period 1988±1997 0.054 0.076 0.293 Number of months 0 out of 111
invested in risk free-rate
Notes: maximum risk portfolios are constructed as follows: at the beginning of each month, expected returns from e cient portfolios are calculated. If the expected return from maximum risk portfolio is greater than the expected risk free rate, one invests in the minimum risk portfolio. Otherwise one invests in the risk free rate.
Table 5. Performance comparisons with Sharpe ratios
Minimum Maximum risk risk
Year portfolio portfolio IFC MV ISE-100 1988 70.882 70.136 70.394 70.361 70.661 1989 0.396 0.527 0.633 0.725 0.605 1990 0.143 70.134 70.028 0.235 0.078 1991 70.086 0.227 70.335 70.042 70.056 1992 0.000 70.288 70.502 70.132 70.366 1993 0.564 0.223 0.553 0.722 0.681 1994 70.386 70.132 70.243 70.481 70.300 1995 0.091 70.419 70.267 70.289 70.164 1996 70.270 0.408 0.193 0.093 0.174 1997 0.000 0.377 0.507 0.460 0.418 Notes: (1) Sharpe ratios presented in this table are calculated by dividing (Average Monthly Ex-post return ± Average Monthly Realized Risk free rate) with the Monthly Standard Deviation
Best, J. M. and Grauer, R. R. (1991) On the sensitivity of mean-variance-e cient portfolios to changes in asset means: some analytical and computational results, The Review of Financial Studies, 4, 315±42.
Chopra, V. K. and Ziemba, W. T. (1993) The eVects of errors in means, variances and covariances on optimal portfolio choice, Journal of Portfolio Management, 19, 6±11.
Cohen, K. J. and Pogue, J. A. (1967) An empirical evaluation of alternative portfolio selection models, Journal of Business, 40, 166±93.
Francis, J. C. and Alexandar, G. J. (1986) Portfolio Analysis, Prentice Hall.
Frost, P. A. and Savarino, J. E. (1988) For better performance: constrain portfolio weights, Journal of Portfolio Management, 15, 29±34.
Jabson, J. D. and Korkie, B. (1981) Putting Markowitz theory to work, Journal of Portfolio Management, 7, 70±4.
Jorion, P. (1992) Portfolio optimization in practice, Financial Analyst Journal, 48, 68±74.
Markowitz, M. H. (1991) Portfolio Selection: E cent Diversi®-cation of Investments, Blackwell Publishers.
Michaud, R. (1989) The Markowitz optimization enigma: is `opti-mized’ optimal?, Financial Analysts Journal, 45, 31±42.
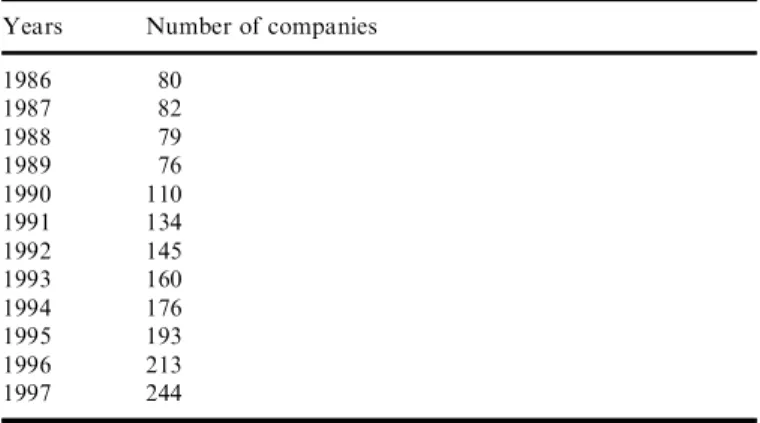
A P P E N D I X
Table A1. Number of companies traded on the ISE
Years Number of companies 1986 80 1987 82 1988 79 1989 76 1990 110 1991 134 1992 145 1993 160 1994 176 1995 193 1996 213 1997 244