POLYPHASE ADAPTIVE FILTER BANKS FOR SUBBAND DECOMPOSITION
Omer.
N.
Gerek, A . Enis
Cetin
Billtent University, Dept.
of
Electrical and Electronics Engineering,
Billtent, Ankara TR-06533, Turkey
E-mail: [email protected]
.edu.tr
Phone: (90) 312-266 4307 Fax: (90) 312-266 4126
ABSTRACT
Subband decomposition is widely used in signal processing applications including image and speech compression. In most practical cases, the goal is t o obtain subband signals that are suitable for d a t a compression. In this paper, we present Perfect Reconstruction ( P R ) polyphase filter bank structures in which the filters adapt t o the changing input conditions. This leads t o higher compression results for images containing sharp edges, text, and subtitles.
1. ADAPTIVE PREDICTION FILTERS I N POLYPHASE FORM
Consider the simple two band P R polyphase decomposition structure shown in Figure 1 in which the filter
Pi
can beFigure 1: Polyphase analysis and synthesis structure either linear or nonlinear [1],[2]. This structure has a simple
(1)
transform matrix: -P1(.)
p = [ : 1
]
A good PI filter would be the one that can predict the sam- ples of z z ( n ) as close as possible. In binary image coding, successful coding results are obtained by selecting PI as a median filter [3]. In [4], the PI is chosen as a FIR low-pass and a median filter pair which are interchanged according to characteristics of the input signal. In this paper, the adaptive
FIR
filters and adaptive order statistics filters are used in the filter bank and image coding algorithms are de- veloped based on the resulting structure. In all cases, the inverse of the P matrix in Eq. (1) is given as:1 Pl(.)
. - I = [ 0 1
]
A predictor should be adaptive for image and video sig- This reasoning
nals as they are unstationary in nature.
0-7803-4455-3/98/$10.00 0
1998
IEEE
Figure 2: Adaptive s t r u c t u r e a l y s i s stage
Figure 3 : Adaptive structure synthesis stage
leads t,o the polyphase structure shown in Fig. 2 in which the prediction filter adapts itself t o minimize the highband signal zh(12). In this way, unnecessary information in z z ( n )
is removed and an uncorrelated signal is transmitted to the receiver. This is especially useful when there are sharp transition regions in an image such as subtitles, text and graphics.
The polyphase adaptive filter bank structure is shown in Figures 2, 3 . In this figure, the signal ~ 2 ( n ) is predicted from z 1 ( n ) (or from the even samples of z ( n ) ) as follows:
N M
h ( n ) = a m ( n - k ) = a 4 2 n - 2 k ) ( 3 )
k = - N k = - N
where the filter coefficients a k ’ s are updated using an LMS-
type algorithm [5],[6], and the subsignal x h is given by
z h ( n ) = .Z(.) - P l ( z 1 ) = zZ(n) - 22(n). (4)
Since z h ( n ) corresponds to the error signal in the adapta- tion algorithm, the decoder can also update the filter coeffi- that the P R property is preserved as long as the same adap- tation strategy is used in both encoding and decoding.
Another choice for PI is the adaptive Order Statistics
(OS) filter [7]-[lo]. Similar to the adaptive FIR case, the OS filters can be adapted by minimizing the subsignal Z h
using an adaptation strategy.
cients without any side information. I t can easily be shown
2. MULTICHANNEL EXTENSIONS
OF
THE BASIC ADAPTIVE FILTER BANK The structure in Fig. 1 and 2 can be extended to contain cascadedPR
blocks as follows:where the filters
P I ,
G I , P2,.. .
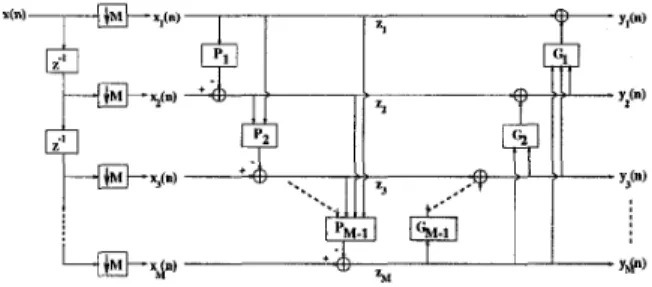
can be linear, nonlinear or adaptive. In this way, the upper and lower branch subsig- nals can be filtered a number of times. The inverse matrix is given asMultichannel and multidimensional extensions are also possible in a straightforward manner. An example of the P R multichannel extension is illustrated in Fig. 4. In this
Yp)
Figure 4: Multi-band analysis structure
figure, an
M
band decomposition with two cascadedPR
building blocks is illustrated. The P R property of this struc- ture can be proved easily. In the analysis stage,
z1 = 2 1
zi = x i
-
P i - i ( ~ i - i ) ,i
= 2 , 3,...,
M ~i = Z ,+
G;(z;+i),i
= 1 , 2,...,
M - 1 Y M = ZM(7)
The corresponding P matrix for this example can be given as :
T h e outputs,
xi,
of the synthesis filters are t h e same as the polyphase components, x i , of the analysis filter bank. Notice that there are no restrictions on the filtersP
i
andG , for perfect reconstruction.
Figure 5: Multfband analysis structure - 2 Another multichannel extension structure is illustrated in Fig. 5. The previous structure was considering the near- est polyphase component value of the input d a t a stream. However, the structure in Fig. 5 is using increasing amount of polyphase component values for prediction as you go from up t o down in the figure. The analysis and synthesis equa- tions for this structure can be given as follows.
Analysis:
21 = 2 1
2 , = xt
-
I't-1,e-l (-Pe-~,e-2(-P1-3,1-3(. * * (-PI,]))))-
~t-l,1-2(-P1-3,1-3(.. - ( - P 1 , 1 ) ) ).
.
.
.
.
.
-
Pe.-l,l, i = 2 , 3,...,
M
xe-
P , - I ( Z I , Z Z ,...,
21-1) - - Y M = Z M y1 = zI+
G ~ ( Y M,...,
y e t i ) ,i
= 1,2,...,
M
-
1 (10) Synthesis: 21, Z M 2 1i
= 1 , 2,...,
M-
1 zl = yI - G 2 ( y ~ ,...,
y 1 + i ) =-
-
= Y M-
-:f
= 21X I
= z1+
P , - ~ ( Z I , Z ~,...,
z,-I = x 2 , i = 2 , 3,...,
M (11) This later structure also yields analysis matrices which can be composed to upper and lower triangular matrices _ . - 1-Pi
0 0...
1 0 0 0...
with elements containing Pi's and Gi's only. In this struc- ture, for predicting zi's, the number of data used is in- creased with increasing indexi.
Conversely, more zi sam- ples are used for predicting v i ' s when the index z is small..
.
.
The computational and analysis complexity of this struc- ture is high as compared to the structure in Fig. 4. Fur- thermore, no coding gain Over the structure in ~ i5 has ~ .been observed for the structure in Fig. 4. 0
0 0 1
-Pz
1 -P3 0-jx[?
. . .
!z
;
;::I
[
.
.
.
.
.
.
.
.
.
.
.
( 8 )
The P R can be achieved with any choice of the nonlinear operators as the
P
matrix can be inverted regardless of the filters Pi's and Gi's. This leads to the following synthesis equations:3. CODING GAIN ANALYSIS
Z h = Z M
z;
= Y i - Gi(zl+i) = za,i
= M - 1,...,
1 The structure in Fig. 2 can be considered as a transforma-x: = 2 1 - - 2 1 tion on the input signals x1 and xz. For an appropriate
.:
= z;+
P i - ] ( 2 ; - l ) = zi+
P i - I ( Z i - 1 ) =xi
transform, the goal is to minimize the total variance of the transform coefficients. It has been shown in [12] that if theV-48
1
coefficients before transformation are quantized at an av- erage bit rate
R,
the PCM quantization variance can be stated aswhere c2 is a scaling factor proportional to the quantizer performance factor [ l a ] , and
02
is the variance of the in- put signal. Similarly, if the transform coefficients are also quantized at the same rate, R, then the minimum transform domain quantization variance becomes(12) 2 -2R 2 &CM = 2 45 40 m 35 c z L 3 0 - 25 20 (13) 2 - 2 R U:,TC = 6 2 ( u l U 2 )
The ratio of a : , p c M to u ; , T C gives the coding gain:
-
-
-
-
-
The maximization of the gain term is equivalent to min- imization of the variances of the transform domain coeffi- cients. The transform matrix in Eq. (1) shows that trans- form domain output xi corresponding to the input
x1
is identically equal to the input signal. In this case, we can maximize the coding gain only by minimizing the varianceOf
Xh.
The adaptive LMS algorithm minimizes the mean squared error at the output, hence it minimizes the variance u,”. This minimization, therefore, maximizes the coding gain at each sample point. Since our OS adaptive algorithm also uses LMS type adaptation, the same variance minimization arguments hold.
In our simulations, the normalized LMS algorithm is used with normalization factor
11x1
11’.
With different choices of the norms (L1, L 2 , and L”), different convergence per- formances are observed [13]. The L1 and L2 norms proved to perform good for most images.4. SIMULATION STUDIES
The two dimensional extension of the proposed scheme is obtained by separately applying the one dimensional adap- tive filter bank to the image data in a separable manner. The filter support, however, is chosen to exploit two dimen- sional characteristics better. The filter support is illustrated in Fig. 6.
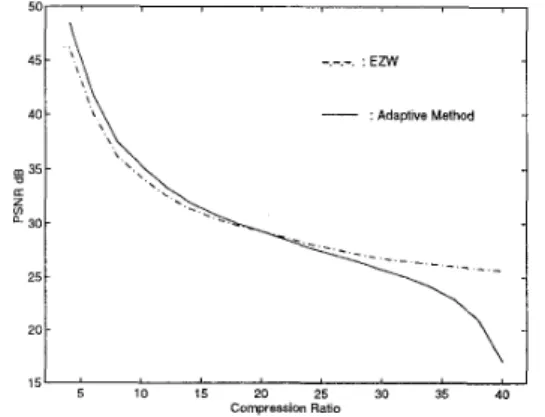
At compression ratios from 1:l to 30:1, the adaptive al- gorithm produces acceptable outputs at the synthesis stage. Especially for the images with sharp variations, this algo- rithm gives better PSNRs at CR from 1: to 15:l. Due to corrupting the synthesis filter adaptation at lower bit rates, the reconstructed image starts getting deteriorated more than the conventional wavelet quantization after compres- sion ratios of 15:l. The synthesis stage starts to diverge after the CRs around 30:l. The CR/PSNR plot for the adaptive algorithm applied to the first image in Table 1 is shown in Fig 7. A quick remedy to avoid the divergence of
501 I
_ _ _
. . . : E m - : Adaptwe Method\
5
Ib1;
20 25 30 ;5 4‘0 Compression RatioFigure 7: EZW versus adaptive method a t different CR’s
the the synthesis stage at very low bit rates is to substitute a fixed filter in the place of the adaptive filter whenever the bit rate is too low.
The 672x560 “barbara” image was compressed to 1
bits/pixel at a PSNR of 35.88dB with the adaptive OS type prediction filter. This PSNR is also comparable to the conventional EZW compression scheme which produces 35.90dB PSNR. Furthermore, our algorithm produces per- ceprtually better images with eliminated ringing effects at the edges.
A set of various images have been compressed using the adaptive algorithm. Some of these images are presented in Table 1.
The coding results of these images in Table 1 at lbpp are presented in table 2.
On the average, our algorithm outperforms the EZW for images with sharp variations. More robust adaptation algorithms for lower bit rates will be studied M a future
work.
Figure 6: Two dimensional separable prediction.
In all of the simulations, we used the Embedded Ze- roTree (EZT) coder to encode the transform coefficients [14]. Due to the characteristics of this coder, the best coding re- sults were obtained by tree-structured two-band decompo- sitions.
Table 1: Test images.
Call-for-papers(*)
I
36.96I
36.87I
Imaae DescriDtionI
EZWI
AdaDtive FIRI
AdaDtive OSI
36.99 \ I Sci_Tech2(
*)
Tourism1 Tourisma(*)
Tourism3 T R m a d * ) 3 1.6 1 31.60 31.65 30.18 30.12 30.19 28.02 27.92 28.07 32.23 32.18 32.31 31.86 31.70 31.92 News0I
34.14I
34.15@-stable random processes,” IEEE- ISCAS’97, Hong Kong, June 1997.
[7] Gonzalo.
R.
Arce andM.
Tian, “Order-statistic filter banks,” IEEE Transactions on Image Processing, 5, June 1996.[8] I. Pitas and A. Venetsanopoulos, “Adaptive filters based on order statistics,” IEEE Trans. Signal Pro- cessing, vol. 39, Feb. 1991.
[9] P. Salembier, “Adaptive rank order based filters,”
EURASIP Signal Processing, 27( 1):l-25, April 1992. [lo]
P.
Salembier andL.
Jaquenoud, “Adaptive morpho-logical multiresolution decomposition,” I n Dougherty Gader, editor, Image Algebra and Mathematical Mor- phology, volume 1568, pages 26-37, San Diego, USA, July 1991.
[ll] S-M. Phoong, C. W. Kim, P.P Vaidyanathan, R. Ansari, “A new class of two channel biorthogonal filter banks and wavelet bases,” IEEE Trans. Signal Proc.,
vo1.43, No.3, pp. 649-665, March 1995.
34.16
Table 2: Experiment results ( P S N R ) of test images a t 1 bpp. News1
I
32.19I
32.055 .
REFERENCES
[l]
F. J.
Hampson and J. C. Pesquet, “A nonlinearsubband decomposition with perfect reconstruction,”
IEEE Int. Symp. on Image Proc. 1996.
[2] Omer N. Gerek, Metin Nafi Giircan, A. Enis Cetin, “Binary Morphological Subband Decomposition For Image Coding,” IEEE Int. Symp. on Time-Frequency
and Time Scale Analysis, 1996.
131 Omer
N.
Gerek,A.
Enis Getin, “Binary nonlinear sub- band decomposition structures for textual image com- pression,” Int. symp. on Nonlinear Signal and Image Processing, NSIP’97, Sep. 1997.[4] 0. Egger, W. Li, and M. Kunt, “High Compression Im- age Coding Using an Adaptive Morphological Subband Decomposition,” Proc IEEE, vol. 83, no. 2, pp.272-287, Feb. 1995.
[5] 0. Arikan, A. E. Getin, Engin Erzin, ‘Adaptive Fil- tering for non-Gaussian stable processes,’ IEEE Signal Processing Letters, vol. 1, No. 11, pp. 163-165, Novem- ber 1994.
[6] Giil Aydin, 0. Tanrikulu, A. Enis Getin, “Robust least mean mixed norm adaptive filtering algorithms for
V-483
32.23
N. S. Jayant,
P.
Noll, Digital Coding of Waveforms,Englewood Cliffs,
N J ,
Prentice Hall, 1984.S. C. Douglas, “A family of normalized LMS algo- rithms,” Signal Processing LEtters, vol. 1, no.3, pp. 49-51, Mar. 1994.
J.
![Figure 1: Polyphase analysis and synthesis structure either linear or nonlinear [1],[2]](https://thumb-eu.123doks.com/thumbv2/9libnet/5954526.124294/1.918.488.810.214.515/figure-polyphase-analysis-synthesis-structure-linear-nonlinear.webp)