East J Med 26(2): 308-315, 2021 DOI: 10.5505/ejm.2021.72681
*Corresponding Author: Özlem Bezek Güre, Department of Medical Documentation and Secretariat Program Health Services Vocational School, Batman University, Batman, Turkey
ORIGINAL ARTICLE
Investigation of Coronavirus Pandemic Indicators of
the Countries with Hierarchical Clustering and
Multidimensional Scaling
Özlem Bezek Güre1*
, Murat Kayri2, Hikmet Şevgin3
1Department Of Medical Documentation and Secretariat Program, Health Services Vocational School, Batman
University, Batman, Turkey
2Department Of Computer and Teaching Technologies Education, Yüzüncü Yıl University, Van, Turkey 3Department of Education Sciences, Measurement and Evaluation, Muş Alparslan University
Introduction
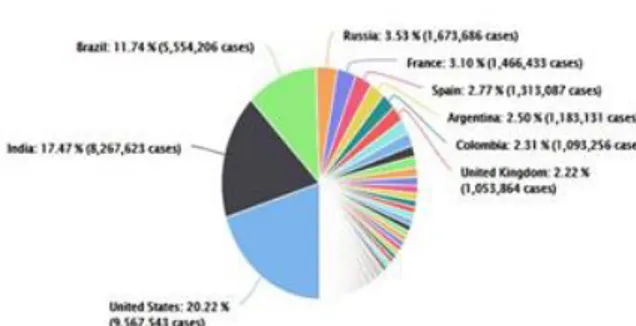
First appeared on 29 December 2019 in Wuhan of China, coronavirus (COVID-19) pandemic affected the whole world soon after its appearance. Declared to be a pandemic by the World Health Organization (WHO) on 11 March 2020, Covid-19 has become an international public health issue (1). It has been observed that coronavirus has profoundly affected the countries socially, economically and psychologically. From the first day when the virus appeared until now, the number of cases has been increasing. By 3th of November, it was reported that the number of coronavirus cases in the world was 47.364.064, the death toll was 1.212.116 and the number of healed patients was 34.060.313 (2). The aim of this study is to analyze the similarities between 50 countries, where Covid-19 has been observed, with the help
of most utilized updated data and by using multivariate statistical methods.
When Figure 1 is examined closely, it is observed that the countries with the highest number of cases are the USA, India, after them comes Brazil and Russia.
Material and methods
In the study, Hierarchical cluster analysis and Multidimensional Scale, two of the multivariate statistical methods, were used in order to determine the similarities between 50 countries having the highest number of coronavirus cases in the world. These data were downloaded from the website,
https://www.worldometers.info/coronavirus/, on 03 November 2020, and they were made available for analyzing in excel. The variables used in the
ABSTRACT
In this study it is aimed to analyze the similarities of 50 countries where coronavirus pandemic, which has been profoundly affecting the whole world socially, psychologically and economically, was mostly seen. The similarities of the countries were investigated with Hierarchical Cluster Analysis and Multi-dimensional Scaling Analysis, which are among multivariate statistical analysis techniques in terms of coronavirus pandemic indicators. The variables used in the analysis are death rat e, recovery rate, active rate, serious case rate, case rate per 1 million, death rate per 1 million, and test rate per 1 millio n. As a result of Hierarchical Cluster Analysis, the countries were divided into seven clusters. In the two -dimensional projections of Multidimensional Scaling, Kruskal stress statistics was found as 0,00001. According to this, a complete compatibility was found between data distances and configuration distances. Also, the fact that R2 is 1,00000 shows that the model is quite
powerful. As a result of the study, the results of both methods were found to be very close to each other. In the same subgroup, Turkey; Peru, Poland, Panama, Romania, Netherlands and Kazakhstan take place. In the study; both developed and underdeveloped countries were found to be in the same cluster. This is a surprising situation. While developed countries are expected to be more effective in combating the epidemic, it was observed that they showed similarities with underdeveloped countries.
Fig.1. Distribution of cases to the countries (3)
Fig.2. Dendrogram showing the results of cluster
analysis of countries in terms of covid 19 pandemic
analysis are fatality rate, recovery rate, active rate, serious case rate, case rate per 1 million, death rate per 1 million, and test rate per 1 million. In the analysis of data, SPSS (ver: 25.0) packet program was used.
Clustering Analysis: Cluster analysis is a
multivariate statistical method that divides variables or units in X data matrix into subgroups that are not homogeneous and different among themselves according to their similarities (4-5). The method has the properties to reveal the unknown relations between units or objects, dimension reduction, and determine outlier values (6-7). What differs this method from the other multivariate methods is the fact that it does not consider the assumption as normal. In practice, it is accepted as sufficient when the distance values are normal (8-11). Also, there is no assumption
Fig. 3.Countries Multi-Dimensional scalinganalysisin terms of covid 19 pandemic
Fig.4. Euclidean distance model
about the cluster number and structure in the method (9, 12-13).
Cluster analysis is grouped as hierarchical and non-hierarchical analysis (13-16). Hierarchical cluster analysis takes the similarities of units in data matrix and combines the variables or units together in accordance with their distances (5,10). In general, Euclidean metric is employed for distance measurements. Various algorithms such as single linkage, complete linkage, average linkage and Ward’s clustering method are used in clustering (6-7,12). In single linkage method, the clusters are formed according to nearest neighbors. The nearest neighborhood shows the smallest distance or the biggest similarity. Although the complete linkage method is similar to the single linkage method, there is an important difference between them. The distances between the clusters are determined by the distances between the two clusters, each of which has a significant distance from the other. In the average linkage method, the distance between the two sets is calculated according to the average distance between the object pairs (12). Ward method, also known as the smallest variance method, is generally used in studies where the number of observations is few (16). Ward method tends to produce rough clusters with the same number of observations and predominantly deviate from
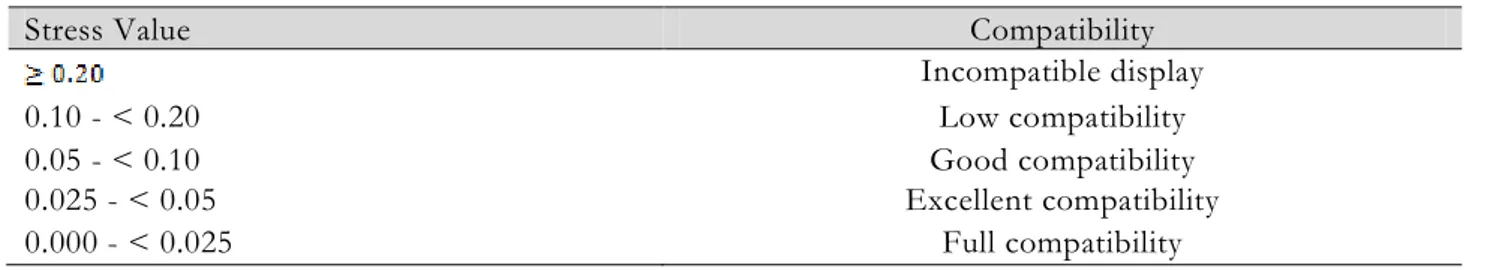
Table 1. Compatibility Level According to Stress Values
Stress Value Compatibility
Incompatible display
0.10 - < 0.20 Low compatibility
0.05 - < 0.10 Good compatibility
0.025 - < 0.05 Excellent compatibility
0.000 - < 0.025 Full compatibility
Table 2. Clusters formed as a result of hierarchical cluster analysis
Cluster The elements of the cluster Number of countries 1 Indonesia, Egypt, Bolivia, Pakistan, Japan, Bangladesh, Saudi Arabia,
Guatemala, Mexico, Ecuador 10
2 Iran, Dominican Republic, Philippines, Nepal, Spain, Brazil, Colombia,
Argentina, Oman, Costa Rica, Iraq, Ukraine, India, South Africa, Morocco 15 3 Peru, Poland, Panama, Turkey, Romania, Netherlands, Kazakhstan 7 4 France, Austria, Germany, Canada, Italy, Czechia, Kuwait, Chile,
Switzerland, Sweden 10
5 Portugal, Qatar 2
6 UK, Israel, USA, Belgium, Russia 5
7 UAE 1
outliers (17). In this method, sum of squares of deviations calculated by considering the average distance of the observation falling in the middle of a cluster according to the observations in the same cluster (16, 18-19).
The stages of the hierarchical cluster analysis are as follows, respectively: Primarily, the data matrix is created as the objects to be clustered in columns, and the properties that define the objects in rows. Then the created data matrix is standardized. Then, using the standardized data matrix or data matrix, similarity coefficient values are calculated to measure the similarities between all object pairs. A clustering method is applied to these values. Results are shown with a tree diagram or dendrogram showing the hierarchy of similarities between object pairs (20).
Non-hierarchical methods also known as K mean or iterative methods divide a data set into previously determined numbered sets. After the center points of the first set are selected, each observation is assigned to the group that has the nearest centerpoint. The cluster centers are recalculated each time when new observations are assigned. This continues until the situation reaches an optimal solution (17). The non-hierarchical cluster method is generally preferred by researchers because of their strong theoretical basis, trusting their prior knowledge of the
number of clusters or being able to decide on the appropriate cluster (9).
Multidimensional Scaling Analysis:
Multidimensional scaling (MDS) is a multivariate statistical method that aims to reveal the positions of the objects in the metric space as m dimension (m<p) based on the distance determined by the p variable between n objects or units (5, 8, 13, 21-26). MDS is a powerful method which is used to demonstrate the data structure. In this method, the data are generally displayed graphically in a two-dimensional space (27). The purpose of multidimensional scaling is to place the original data in a less dimensional coordinate system as much as possible and to reveal the relationships between the variables (8, 11, 13, 28-31).
MDS is used in cases where the relationships between units or objects are not known exactly, but the distance matrix can be obtained (26, 29). MDS shows the relationship structure of the data in a multi-dimensional space very close to their original positions in order to understand the similarities between the variables better (12, 26, 32).
In the graphical representation that occurs in the MDS, the points representing similar objects in space are located close to each other, while distant ones are located far apart (14). In multidimensional scaling, presentation of objects
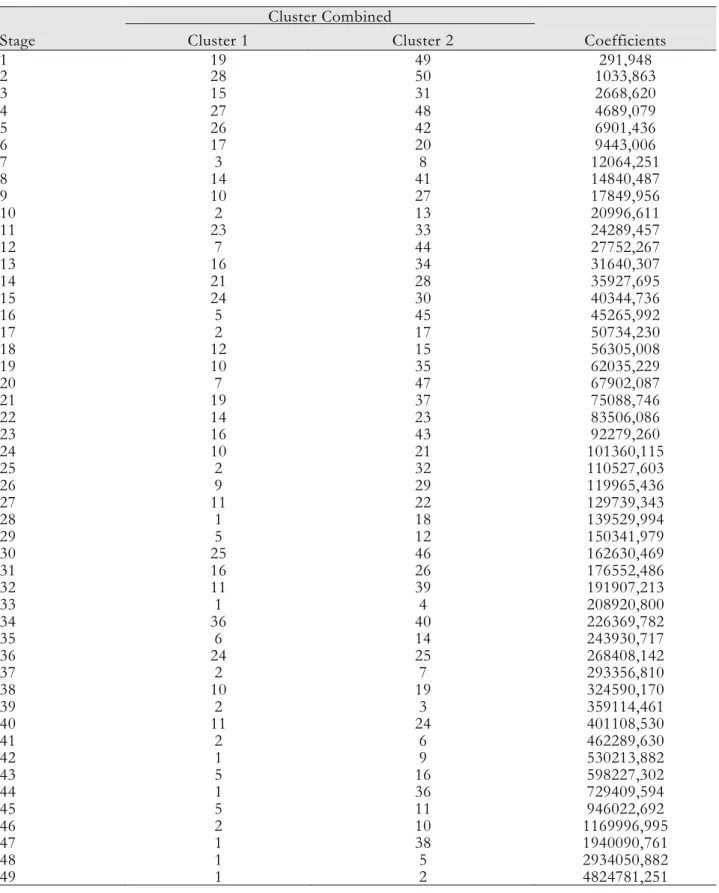
Table 3. Agglomerative table Stage Cluster Combined Coefficients Cluster 1 Cluster 2 1 19 49 291,948 2 28 50 1033,863 3 15 31 2668,620 4 27 48 4689,079 5 26 42 6901,436 6 17 20 9443,006 7 3 8 12064,251 8 14 41 14840,487 9 10 27 17849,956 10 2 13 20996,611 11 23 33 24289,457 12 7 44 27752,267 13 16 34 31640,307 14 21 28 35927,695 15 24 30 40344,736 16 5 45 45265,992 17 2 17 50734,230 18 12 15 56305,008 19 10 35 62035,229 20 7 47 67902,087 21 19 37 75088,746 22 14 23 83506,086 23 16 43 92279,260 24 10 21 101360,115 25 2 32 110527,603 26 9 29 119965,436 27 11 22 129739,343 28 1 18 139529,994 29 5 12 150341,979 30 25 46 162630,469 31 16 26 176552,486 32 11 39 191907,213 33 1 4 208920,800 34 36 40 226369,782 35 6 14 243930,717 36 24 25 268408,142 37 2 7 293356,810 38 10 19 324590,170 39 2 3 359114,461 40 11 24 401108,530 41 2 6 462289,630 42 1 9 530213,882 43 5 16 598227,302 44 1 36 729409,594 45 5 11 946022,692 46 2 10 1169996,995 47 1 38 1940090,761 48 1 5 2934050,882 49 1 2 4824781,251
in common space is shown in an easily understandable and explainable way (31). Here, the points representing similar objects in space take place close to each other; on the other hand, distant ones are far apart (14, 26).
In MDS, metric and non-metric scaling methods are used depending on the types of data (5, 11, 14). The applied techniques vary depending on the scale and data type used in MDS. This analysis can be applied to various data types measured by scale
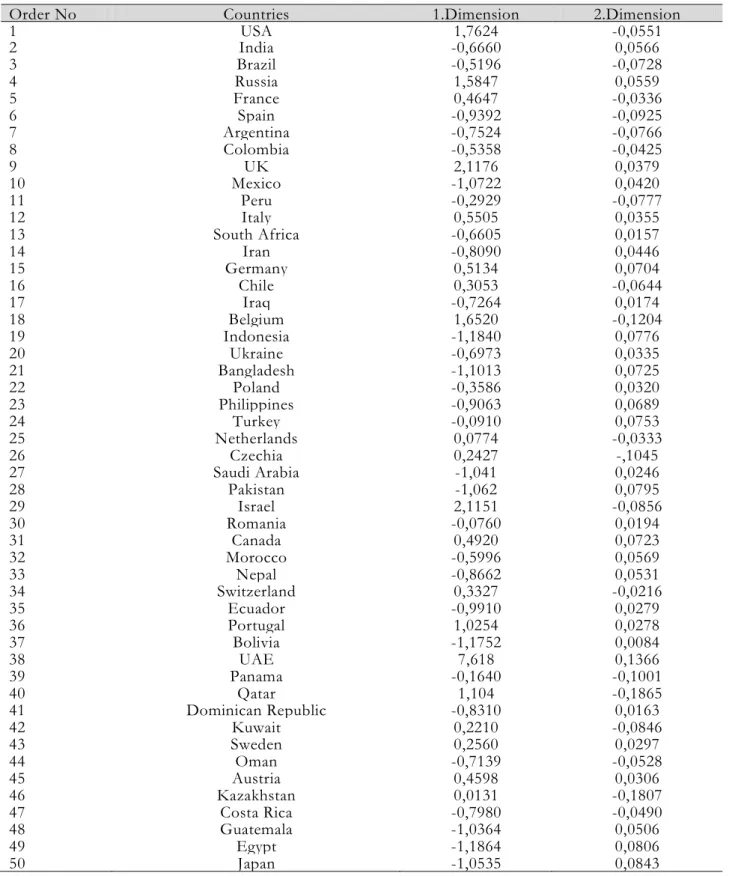
Table 4. Stimulating coordinates
Order No Countries 1.Dimension 2.Dimension
1 USA 1,7624 -0,0551 2 India -0,6660 0,0566 3 Brazil -0,5196 -0,0728 4 Russia 1,5847 0,0559 5 France 0,4647 -0,0336 6 Spain -0,9392 -0,0925 7 Argentina -0,7524 -0,0766 8 Colombia -0,5358 -0,0425 9 UK 2,1176 0,0379 10 Mexico -1,0722 0,0420 11 Peru -0,2929 -0,0777 12 Italy 0,5505 0,0355 13 South Africa -0,6605 0,0157 14 Iran -0,8090 0,0446 15 Germany 0,5134 0,0704 16 Chile 0,3053 -0,0644 17 Iraq -0,7264 0,0174 18 Belgium 1,6520 -0,1204 19 Indonesia -1,1840 0,0776 20 Ukraine -0,6973 0,0335 21 Bangladesh -1,1013 0,0725 22 Poland -0,3586 0,0320 23 Philippines -0,9063 0,0689 24 Turkey -0,0910 0,0753 25 Netherlands 0,0774 -0,0333 26 Czechia 0,2427 -,1045 27 Saudi Arabia -1,041 0,0246 28 Pakistan -1,062 0,0795 29 Israel 2,1151 -0,0856 30 Romania -0,0760 0,0194 31 Canada 0,4920 0,0723 32 Morocco -0,5996 0,0569 33 Nepal -0,8662 0,0531 34 Switzerland 0,3327 -0,0216 35 Ecuador -0,9910 0,0279 36 Portugal 1,0254 0,0278 37 Bolivia -1,1752 0,0084 38 UAE 7,618 0,1366 39 Panama -0,1640 -0,1001 40 Qatar 1,104 -0,1865 41 Dominican Republic -0,8310 0,0163 42 Kuwait 0,2210 -0,0846 43 Sweden 0,2560 0,0297 44 Oman -0,7139 -0,0528 45 Austria 0,4598 0,0306 46 Kazakhstan 0,0131 -0,1807 47 Costa Rica -0,7980 -0,0490 48 Guatemala -1,0364 0,0506 49 Egypt -1,1864 0,0806 50 Japan -1,0535 0,0843
such as Ordinal Scale, Interval Scale and Ratio Scale (33). While metric scaling uses data obtained by ratio or interval scale, non-metric scaling is applied to score, ordinal and categorical data (5, 31, 34). Since the variables can be in different scale types and different units of measurement,
the results of the analysis may be affected. Therefore, it is recommended to convert the values to score values or standard values to reduce the effects (5).
In MDS, the most important point is the determination of the distance measure and it is
necessary to prefer the methods of obtaining the distance suitable for the data types. In data sets obtained with interval and proportional scale; Euclidean distance, Quadratic Euclidean distance, Chebychef, City-Blok, Minkowski distances can be selected. In binary scale data types, on the other hand, Euclidean distance, Quadratic Euclidean distance, Pattern difference, Lance Williams distance can be preferred (5, 28).
One of the most important issues in performing of MDS is to indicate the number of dimensions. In determining whether the number of dimensions to be used is suitable, Kruskal stress value is used to show the compatibility between the original and the displayed distances (5, 26). The most appropriate value is the smallest stress value found as a result of the analysis (7, 35).
Stress size is calculated by the following equation (5):
Kruskal tolerance ratios are used in the interpretation of the configuration distances according to the magnitude of the stress values. The tolerance rates are as follows (5, 7, 26, 34-35). The high stress value indicates that the incompatibility is high, while the low stress value indicates low incompatibility.
Results
Hierarchical Cluster Analysis Findings: Ward
method was chosen for hierarchical cluster analysis and Euclidean distance measure was used as distance measure. A dendrogram was obtained from the hierarchical cluster analysis. Clusters formed as a result of hierarchical cluster analysis are shown in Table 2.
It is known that the countries that have the highest similarities to each other in the agglomerative table have the lowest coefficient value, while those that do not have the highest similarities have the highest coefficient value. From the Table 3, it can be understood that the countries that have the highest similarities are Indonesia and Egypt with the lowest coefficient value, while the countries that do not have the highest similarities are the USA and India with the highest coefficient value.
Multidimensional Scaling Analysis Findings:
Considering the coronavirus pandemic indicators, the coordinates obtained for the relevant variables as a result of the two-dimensional MDS are given
in Table 4. In the two-dimensional representation of MDS, Kruskal stress statistics were found 0,00001. Accordingly, there is complete compatibility between data distances and configuration distances. Also, the fact that R2 is
1,00000 shows that the model is quite strong. Table 4 shows that UAE is the most important parser in this dimension as the country with the highest positive value in the first dimension. Also; USA, Russia, UK, Belgium, Israel, Portugal and Qatar are similar countries with the highest positive value above 1 and they are important separators in this dimension. It can be concluded that Mexico, Indonesia, Bangladesh, Saudi Arabia, Pakistan, Bolivia, Guatemala, Egypt and Japan are the most different countries in the first dimension since they have high negative values above 1. In the second dimension, it is revealed that countries in this dimension are not different from each other since there is no country with more than 1 positive value.
Discussion
In this study, 50 countries with the highest number of cases in terms of Coronavirus pandemic indicators were tried to be determined by multivariate statistical methods, hierarchical cluster analysis and multidimensional scaling results which supported one another. At the end of the study, countries were divided into four subgroups according to the coronavirus indicators. In the first subgroup, while Indonesia, Egypt, Bolivia, Pakistan, Japan, Bangladesh, Saudi Arabia, Guatemala, Mexico and Ecuador took place, in the second subgroup, Iran, the Dominican Republic, the Philippines, Nepal, Spain, Brazil, Colombia, Argentina, Oman, Costa Rica, Iraq, Ukraine, India, South Africa and Morocco, and in the third subgroup, Peru, Poland, Panama, Turkey, Romania, the Netherlands and Kazakhstan, and in the fourth subgroup, France, Austria, Germany, Canada, Italy, Czechia, Kuwait, Chile, Switzerland and Sweden, and in the fifth subgroup, Portugal and Qatar, and the UK, Israel, the USA, Belgium and Russia took place, and in the sixth subgroup, and finally, the seventh subgroup included the country of the UAE. It was comprehended that the UAE appear to be taking place at a location different from other countries. The result of multidimensional scaling was supported by the fact that these countries are different from other countries which are similar to each other.
According the result of the study, it was found out that not only the developed countries but also underdeveloped countries took place in the same cluster. This is a surprising state. While the developed countries are expected to struggle with the pandemics more effectively, it was determined in this study that they exhibit either in the same or worse state with underdeveloped countries. This reveals that the developed countries either ignore the pandemics or do not intervene in on time. On the other hand, that the developed countries exhibit similarities with underdeveloped countries in struggling with pandemics may remain at a tolerable level on behalf of developed countries. However, it is obvious that pandemics will leave much deeper traces on both developed and underdeveloped countries. Therefore, considering rapidly spreading pandemics throughout the world, it is important that the international community should struggle with pandemics globally. Consequently, in order that the countries can successfully struggle with possible pandemics in the future, it has become compulsory that the awareness of the communities should be raised, and strong health infrastructures should be set up, and research and development activities should be accelerated, and emergency activity plan should be prepared, and global corporation should be established.
References
1. WHO (World Health Organization) , www.who.int (accessed: November 3, 2020) 2. https://www.worldometers.info/coronavirus/
(accessed: November 3, 2020)
3. https://www.worldometers.info/coronavirus/ #countries(accessed: November 3, 2020) 4. Hair, J. F., Jr., Anderson, R. E., Tatham, R. L.
and Black, W. C., 1998. Multivariate Data Analysis. Upper Saddle River, New Jersey: Prentice-Hall.
5. Özdamar, K. Paket Programlarla İstatistiksel Veri Analizi 2, Yenilenmiş 5. Baskı. 2004. Eskişehir: Kaan Kitabevi.
6. Ferreira L. Hitchcock D.B. “A comparison of hierarchical methods for Cluster Functional data”, Communications in Statistics-Simulation and Computation 2009; 38: 1925-1949.
7. Akdamar E. Investigation of the OECD countries by using some labour market indicators with Cluster Analysis and Multidimensional Scaling Analysis. Journal of
Academic Researches and Studies 2019; 11: 50-65.
8. Tatlıdil, H. . Uygulamalı çok değişkenli istatistiksel analiz, 1996 I. Baskı. Ankara: Engin Yayınları.
9. Kaygısız Z. Saraçlı S. Dokuzlar K.U. Examining the factors of development level of
the administrative provinces wıth Path analysis and Cluster analysis. VII. Ulusal Ekonometri ve İstatistik Sempozyumu 2005; 26-27.
10. Doğan, N. and Başokçu, T.O. İstatistik Tutum Ölçeği İçin Uygulanan Faktör Analizi ve Aşamalı Kümeleme Analizi Sonuçlarının Karşılaştırılması. Eğitimde ve Psikolojide Ölçme ve Değerlendirme Dergisi 2010; 1: 65-71.
11. Kılıç, İ., Saraçlı, S. and Kolukısaoğlu, S. Sosyoekonomik göstergeler bakmndan illerin bölgesel bazda benzerliklerinin çok değişkenli analizler ile incelenmesi. İstatistikçiler Dergisi, 2011; 4: 57-68.
12. Johnson RA, Wichern DW. Multidimensional Scaling. Applied Multivariate Statistical Analysis., 1999. 4th ed. New Jersey: Pearson Prentice Hall.
13. Yenilmez, F. And Girginer, N. Comparison of indicators of women’s labour between Turkey and EU member states by employing multidimensional scaling analysis and clustering analysis. Applied Economics 2016; 13: 1229-1239.
14. Alpar, R .Uygulamalı Çok Değişkenli İstatistiksel Yöntemler. 2013. Detay Yayıncılık, Ankara.
15. Blashfield, R. K. and Aldenferder, M. S. The Literature on Cluster analysis, Multivariate Behavioral Research 1978; 13: 271-295. 16. Songur, C. Cluster Analysis of Organization
for Economic Cooperation and Development Countries According to Health Indicators. Journal of Social Security 2016; 6: 197-224. 17. Ketchen, D.Jr. and Shook, C.L. The
Application of Cluster Analysis in Strategic Management Research: An Analysis and Critique, Strategic Management Journal 1996; 17: 441-458.
18. Koltan Yılmaz, Ş. and Patir, S. Cluster analysis and its usage in marketing. Journal of Academıc Approaches 2011; 1: 91-113. 19. Şahin, D. The Position of Turkey within the
European Union Countries in terms of Health Indicators: A Statistical Analysis. Journal of Institute of Social Sciences 2017; 2: 55-77. 20. Romesburg, C. Cluster analysis for
researchers. 2004. Lulu. com.
21. Ekiyor, A. Algılama haritalarının hazırlanmasında Çok Boyutlu Ölçeklemetekniğinin kullanılması: Ankara İli Özel HastanelerÖrneği. Gazi Üniversitesi
Sosyal Bilimler Enstitüsü, doktoratezi, 2009. Ankara
22. Tüzüntürk S. Multidimensional scaling: an application on crime statistics”, Uludağ University Journal of Economics and Administrative Sciences 2009; 28: 71-91. 23. Gündüz S. Uzaklık fonksiyonlarının Çok
Boyutlu Ölçeklemealgoritmalarındaki etkinliğinin incelenmesi ve uygulamalar. Çukurova Üniversitesi Yüksek lisans tezi 2011. Adana.
24. Acar, A.B. Comparison of Turkey and the Other OECD Countries in Terms of Labour Markets’ Main Indicators Using Multi Dimensional Scale Analysis. Faculty of Business Administration Institute of Business Administration Journal of Management 2013; 24: 121-144.
25. Büyüker İşler, D. Examining between regional internal migration movements in Turkey with multidimensional scaling. Adıyaman Üniversites iSosyal Bilimler Enstitüsü Dergisi 2014; 7: 447-484.
26. Bezek Güre, Ö. and Kayri, M. Investigatıon of OECD countries with Multi-dimensional Scaling analysis in terms of traffic accident indicators. International Journal of Health Services Research and Policy 2020; 5: 1: 24-40.
27. Hand D, Manila H, Symth P. (Principles of Data Mining, 2001. London: The MIT Press.
28. Kalaycı Ş. SPSS uygulamalı çok değişkenli istatistik teknikleri. 2006. 2.baskı. Ankara: Asil Yayın Dağıtım Ltd. Şti.
29. Saatçioğlu C, Bildirici Ü. The Place of Turkey Between OECD Countrıes in Terms of Innovation Indicators: An Econometric Implementation. İşletme ve İktisat Çalışmaları Dergisi 2017; 4: 44-56.
30. Aliukov, S.V., Du, X. Li,S and Sang, Y. Investigation of China's wind power based on cluster analysis and multidimensional scaling methods.IOP Conf. Series: Earth and Environmental Science 2019; 378: 012043. 1-6.
31. Wen CH. and Yeh, WY. Positioning of International Air Passenger Carriers Using Multidimensional Scaling and Correspondence Analysis. Transportation Journal 2020; 49: 1: 7-23.
32. Wasserman, S., K. Faust, D. Iacobucci, and M. Granovetter. Social Network Analysis:
Methods and
Applications. 1994. Cambridge: Cambridge University Press.
33. Ersöz F. [Analysis of health levels and expenditures of Turkey and OECD countries]. İstatistikçiler Dergisi 2008; 1: 95-104.
34. Wilkermaier, F. An introduction to MDS, Sound Quality Research Unit 2003.
35. Kruskal, J.B. Multidimensional Scaling by optimizing goodness of fit to a Nonmetric Hypothesis. Psychometrika 1964; 9: 1-27.