INTRODUCTION
Snake venoms are complex molecular cocktails consist-ing mainly of bioactive peptides and proteins includconsist-ing enzymes (such as serine and metalloproteinase, phos-pholipase A2, hyaluronidase, L-amino acid oxidase, nu-cleotidase), non-enzymatic proteins (e.g. cysteine-rich secretory protein, disintegrin, vascular endothelial growth factor, nerve growth factor, C-type lectin) and smaller peptides (e.g. bradykinin-potentiating peptides,
protease inhibitor peptides) (1-3). Snake venoms also contain some minor compounds such as carbohydrates, nucleosides, biogenic amines, various carboxylic acids and inorganic elements (4,5). Snake venoms, an import-ant source of bioactive proteins, have attracted research-ers in the past. Drugs and diagnostic kits were developed using snake venom peptides and proteins (2,6-8). Macrovipera lebetina (Serpentes: Viperidae: Viperinae) is a relatively big viper species which could reach up to
* This paper was produced from the M.Sc. thesis of the first author. Part of this paper was presented at 16th National Biotechnology Congress (13-16 December 2009, Antalya, Turkey).
Corresponding Author: Nasit Igci E-mail: [email protected]
Submitted: 06.11.2019 • Revision Requested: 13.12.2019 • Last Revision Received: 10.03.2020 • Accepted: 11.03.2020
© Copyright 2020 by The Istanbul University Faculty of Science • Available online at http://ejb.istanbul.edu.tr • DOI: 10.26650/EurJBiol.2020.0039
A Fourier Transform Infrared Spectroscopic Investigation of
Macrovipera lebetina lebetina and M. l. obtusa Crude Venoms
*Nasit Igci
1,2,
Fatma Duygu Ozel Demiralp
3,41Nevşehir Hacı Bektaş Veli University, Faculty of Science and Arts, Department of Molecular Biology and Genetics, Nevşehir, Turkey 2Nevşehir Hacı Bektaş Veli University, Science and Technology Application and Research Center, Nevşehir, Turkey
3Ankara University, Biotechnology Institute, Ankara, Turkey
4Ankara University, Faculty of Engineering, Department of Biomedical Engineering, Ankara, Turkey
ORCID IDs of the authors: N.I. 0000-0001-6151-808X; F.D.O.D. 0000-0002-1798-7951
Please cite this article as: Igci N, Ozel Demiralp FD. A Fourier Transform Infrared Spectroscopic Investigation of Macrovipera
lebetina lebetina and M. l. obtusa Crude Venoms. Eur J Biol 2020; 79(1): 14-22. DOI: 10.26650/EurJBiol.2020.0039
ABSTRACT
Objective: Snake venoms are rich sources of bioactive molecules and have been investigated using various bioanalytical
methods. Fourier transform infrared (FTIR) spectroscopy is a sensitive method that can be used to analyze biological samples. The aim of this study is to apply the FTIR spectroscopy method for the characterization of snake venom.
Materials and Methods: The study characterized the lyophilized crude venoms of Macrovipera lebetina lebetina and
M. l. obtusa by FTIR spectroscopy coupled with attenuated total reflectance (ATR) method in the mid-infrared region and
compared the spectra between the two subspecies. The band area and intensity values were calculated for comparison and wavenumbers were detected by automated peak picking. Additionally, the study analyzed the secondary structure of venom proteins by using the second derivative spectra.
Results: The study detected fourteen major and minor peaks in absorbance spectra which were assigned to various
biomolecules such as proteins, carbohydrates, and nucleic acids. Four major sub-bands were observed in the second derivative spectra of Amide I-II region indicating different protein secondary structures. It was observed that there are some quantitative differences and peak shifts between the spectra of venoms of two subspecies, indicating the alteration of biomolecules.
Conclusion: To the best of our knowledge, this is the first report of the use of the FTIR-ATR spectroscopy method focusing
solely on the characterization of crude snake venoms in literature, accompanied with detailed peak assignment and protein secondary structure analysis. As a preliminary reference study, the results showed the usefulness of FTIR-ATR spectroscopy for the physicochemical characterization of lyophilized snake venom.
2 meters long and has a wide geographical range from north-ern Africa to Pakistan and Kashmir, reaching to Kazakhstan and Dagestan (southwestern Russia) in the North, including Turkey and Cyprus (9-11). Although the taxonomic status of some sub-species is still in question, it is accepted that nominate taxon M. l. lebetina (Linnaeus, 1758) inhabits Cyprus (11-13). The south-ern and southeastsouth-ern Anatolia populations were treated as M. l. euphratica (Martin, 1838) in the past but this name is generally synonymized under M. l. obtusa (Dwigubsky, 1832) today (12). M. l. obtusa has a geographical range from Mersin to south-eastern, southern, and northeastern Anatolia in Turkey while M. l. lebetina is restricted to Cyprus island (10-13). M. lebetina is largely responsible for the harmful snakebite-cases in its world-wide range as well as in Turkey and it is the only venomous vi-per species occurring in Cyprus (12,14,15).
Fourier transform infrared (FTIR) spectroscopy is a fast, robust, sensitive, and widely-used vibrational spectroscopy method. The working principle is the formation of different vibrational modes of the chemical groups in molecules after absorbing infrared ra-diation (16,17). Due to the non-destructive and non-invasive na-ture of infrared radiation, this method is widely applied to biolog-ical and biomedbiolog-ical studies today (18-21). Each vibration type has its specific frequency of absorption which can be associated with various bioorganic molecules in biological samples. The amounts of biomolecules can be assessed in a comparative manner using the band intensities and areas (18,19). Moreover, information re-garding the secondary structures of proteins can be obtained by spectral interpretation (17,19,20,22).
Since the major elements of crude snake venoms are proteins and peptides, researchers have been focusing on their pro-teomic characterization using various bioanalytical methods suitable for protein separation and analysis such as polyacryl-amide gel electrophoresis, liquid chromatography, and mass spectrometry (3,23-28). Venom of the subspecies of M. lebetina has also been an important source in many studies aimed to purify proteins and make proteomic and biological character-ization (3,25,29). Major protein families of M. lebetina venom are metalloproteinase, serine proteinase, phospholipase A2, L-amino acid oxidase, hyaluronidase, disintegrin, C-type lectin, cysteine-rich secretory protein, vascular endothelial growth factor, nerve growth factor, bradykinin-potentiating peptides, and protease inhibitor peptides (3,25,29). These proteins give the venom its unique pharmacological properties such as anti-coagulant, cytotoxic and antimicrobial activities.
The Fourier Transform Infrared Spectroscopy method was used to analyze the secondary structures of purified snake venom toxins (30-33) and their complexes with nanomaterials (34,35). In one study, the FTIR spectrum of Echis carinatus venom was published together with its chitosan nanoparticle complex but the results were used for comparative purposes to assess the loading efficiency and it was not aimed to make a venom-ic characterization (36). Another study, by Shafiga and Huseyn (37), reported some IR peaks of M. l. obtusa venom as a part of their results but their data was limited. There is no detailed
published study focusing solely on the application of FTIR spec-troscopy for the characterization of crude snake venoms which provides detailed band assignments, to the best of authors’ knowledge. The present study aimed to make physicochemical characterization of crude snake venoms by FTIR-ATR spectros-copy using the venoms of M. l. lebetina and M. l. obtusa as rep-resentative materials and assess the method’s usefulness in the field of toxinology.
MATERIALS AND METHODS Venom Samples
In this study, we used the pooled venoms of two adult M. l. lebetina and two adult M. l. obtusa individuals collected from The Turk-ish Republic of Northern Cyprus (Selvilitepe and Dikmen) and southeast Turkey (Egil/Diyarbakir and Suruc/Sanliurfa), respec-tively. The venom samples were extracted from vipers using a paraffin-covered laboratory beaker and without applying any pressure on the venom glands. Authors had ethical permission for venom extraction at the time of the study (Ege University Animal Experiments Ethics Committee, permit number 2010-43). After extraction, venom samples were centrifuged at 2000 × g for 10 min at 4°C. Supernatants were collected, frozen at -80°C and then lyophilized by using a bench-top freeze-dryer (Millrock Technology, Kingston, NY, USA). Lyophilized samples were kept at 4°C until used.
FTIR Data Collection and Evaluation
Lyophilized venom samples were measured using a universal attenuated total reflectance (ATR) cell (Pike Technologies, Wis-consin, USA) connected to an FTIR device (Bruker Tensor 27, Bruker Optics GmbH, Ettlingen, Germany) equipped with a liquid nitrogen cooled photovoltaic mercury cadmium tellu-ride detector. High-purity nitrogen gas was purging during all the measurements. Air was subtracted automatically before all sample measurements. Spectra of the venom samples were re-corded in the mid-infrared region, between 4500-850 cm-1 wav-enumbers and interferograms were accumulated for 50 scans at 4 cm-1 resolutions at room temperature in the single-bounce ATR mode. A small amount of the sample, enough to cover the ZnSe ATR crystal, were placed and compressed with a clamp. Each sample was measured in triplicate and the average spectra was used for analyses.
Spectral data interpretation was performed by OPUS 5.5 soft-ware (Bruker). Automated peak picking was performed in order to determine wavenumber values. Min-max normalization was applied with respect to the Amide I peak (at 1644 cm-1) for illus-trative purposes. Spectra were baselined using an automated multipoint method and band areas were calculated by integra-tion. Band areas were normalized by dividing the value of each band to the total spectrum area in order to minimize technical variation (21). Second derivatives of the absorbance spectra, in which absorption maxima appear as minima, were calculated using Savitzky-Golay algorithm. Relative intensity values of the second derivative peaks in the Amide I-II region (1700-1500 cm-1) were used to assign protein secondary structures (20-22,
38). Relative intensities were calculated using the arbitrary unit values on the y-axis after lining a reference baseline at the min-imum point of the spectrum in Amide I-II region.
RESULTS
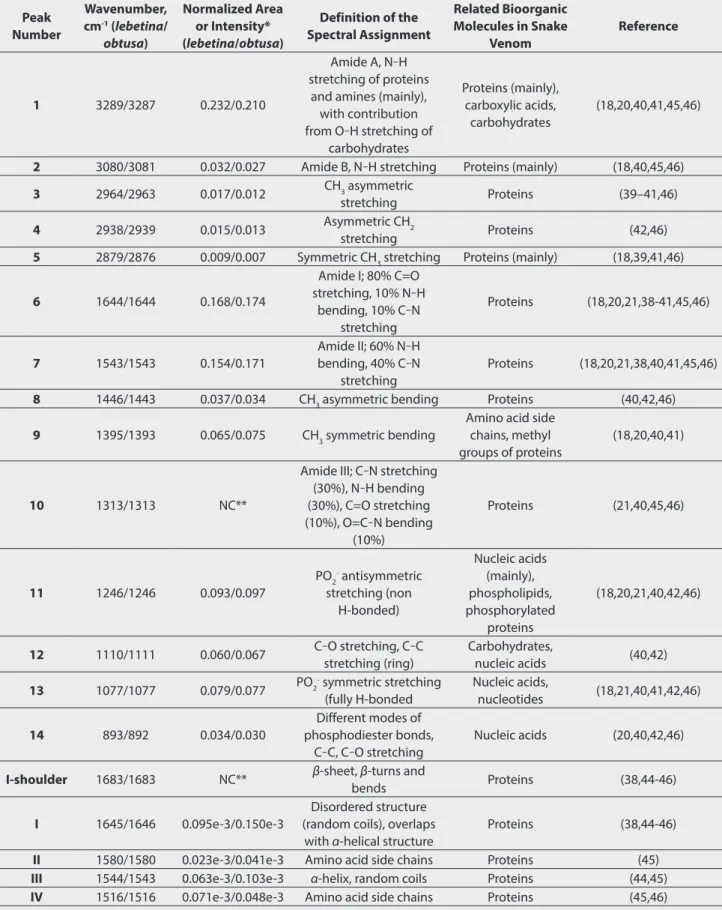
As a result of the FTIR measurements, 14 significant peaks were detected in the spectrum of M. l. obtusa and M. l. lebetina venom in the mid-infrared region between 4500-850 cm-1 (Figure 1). A majority of the characteristic peaks were observed between 1800 and 850 cm-1 wavenumbers. The wavenumber of each peak was determined by automated peak picking and the ar-eas under the bands were calculated by integration (Table 1). Table 1 also includes the definitions of the spectral assignments for each major absorbance peak observed in the present study, with their wavenumbers (see the Discussion section for a de-tailed explanation of the peak assignment process).
The characteristic peaks arising from the protein backbone such as Amide A, B, I, II and III were observable on the spectra of M. lebetina venom (Figure 1, Table 1). The major bands with the highest intensities were Amide I at 1644 cm-1 and Amide II at 1543 cm-1 wavenumbers (Figure 1, Table 1). Sub-bands were obtained by derivatization (second derivative) in the Amide I-II region, ranging between 1700-1500 cm-1 to obtain information about the protein secondary structures. Two major sub-bands and three minor shoulders were observed in this region after derivatization in the present study (Figure 1). The wavenumbers were assigned to the secondary structures of the proteins by comparing the data previously published in the literature (see Discussion) and presented in Table 1 with their intensity values. According to our results, overall venom proteins of M. lebetina subspecies predominantly have α-helix and unordered (random coil) secondary structures. The second derivative spectra in the
Amide I-II region of two subspecies were similar. However, some quantitative differences and band shifts were observed (Table 1, Figure 1), which will be discussed in the next section. DISCUSSION
We characterized crude venoms of two subspecies of M. lebetina (M. l. lebetina and M. l. obtusa) by using FTIR spectroscopy cou-pled with the ATR method. As a fast, robust, and sensitive ana-lytical method, FTIR has been used not only in chemistry but also in biological and biomedical studies (18). In the present study, a majority of the characteristic peaks were observed be-tween 1800 and 850 cm-1 wavenumbers, which is considered a fingerprint region in FTIR spectroscopy (18-21). All the absor-bance peaks were assigned to various vibrational modes asso-ciated with biomolecules such as proteins, nucleic acids, and carbohydrates comparing the frequencies with those in the related literature previously published elsewhere (18,20-22, 39-46). This is a routine and widely-accepted procedure for the FTIR spectroscopic investigation of biological materials, relying on information obtained from published literature (18,42,46). As a result of scientific research in this field, very detailed reference papers as well as textbooks are available today (18,19,22,38-53). Peak assignment in FTIR spectroscopic studies includes two steps: The peaks observed in an FTIR spectrum gives informa-tion about the vibrainforma-tional modes of specific funcinforma-tional groups. Absorbance peaks of many of the functional groups in the IR spectrum were characterized in previous studies (generally us-ing pure model molecules) and this information can be found in published papers and textbooks (18,20-22,39-46). Associating the vibrational definitions to particularly more complex mole-cules (such as bioorganic macromolemole-cules) is the second step and depends on the sample. If one knows that the analyte is a biological sample, peaks can be assigned to functional groups of major and minor biomolecules. Since the most abundant macromolecules in cells and biological fluids are proteins, car-bohydrates, nucleic acids and lipids, the major peaks observed in the FTIR spectrum generally arise from various functional groups of these macromolecules (18,19,40,42,46). Snake venom is a secretion of cells covering the lumen of the venom gland, a biological fluid consisting mainly of proteins. Carbohydrates, biological amines, nucleotides, and nucleic acids can also be found as minor constituents (5). In the light of this knowledge, peaks in the FTIR spectrum of a snake venom can be assigned to these molecules using previously published papers in which FTIR peak information of tissue or cells is available.
Among the observed peaks in the present study, asymmetric and symmetric C-H stretching vibrations of CH3 and CH2 groups give rise in the region between 2950-2860 cm-1 wavenumbers, which originate from proteins and lipids in biological samples (18,20,21,39-42,46). Peaks around 1446-1443 cm-1 can be as-signed to CH2 and CH3 bending of lipids and amino acid side chains of proteins, respectively (40,42,46). Since snake venom predominantly consists of proteins, these bands can be as-signed mainly to proteins rather than lipids for snake venoms. Figure 1. Overlayed FTIR spectra of Macrovipera lebetina lebetina
and M. l. obtusa venoms showing absorbance spectra between 3800–850 cm-1 wavenumbers and second derivative spectra of Amide I and II peaks demonstrated as sub-bands. Arabic numbers correspond to the peaks in the absorbance spectrum while roman numerals refer to the sub-peaks of the second derivative spectrum (see Table 1 for peak assignments)
Table 1. Assignments of the FTIR peaks of venom samples with their chemical bond definitions. Band area values were given for the absorbance peaks (1-14), whereas relative intensity values were used for the second derivative peaks (I-IV).
Peak Number Wavenumber, cm-1 (lebetina/ obtusa) Normalized Area or Intensity* (lebetina/obtusa) Definition of the Spectral Assignment Related Bioorganic Molecules in Snake Venom Reference 1 3289/3287 0.232/0.210 Amide A, N‒H stretching of proteins
and amines (mainly), with contribution from O‒H stretching of carbohydrates Proteins (mainly), carboxylic acids, carbohydrates (18,20,40,41,45,46)
2 3080/3081 0.032/0.027 Amide B, N‒H stretching Proteins (mainly) (18,40,45,46)
3 2964/2963 0.017/0.012 CH3 asymmetric
stretching Proteins (39–41,46)
4 2938/2939 0.015/0.013 Asymmetric CH2
stretching Proteins (42,46)
5 2879/2876 0.009/0.007 Symmetric CH3 stretching Proteins (mainly) (18,39,41,46)
6 1644/1644 0.168/0.174 Amide I; 80% C=O stretching, 10% N‒H bending, 10% C‒N stretching Proteins (18,20,21,38-41,45,46) 7 1543/1543 0.154/0.171 Amide II; 60% N‒H bending, 40% C‒N stretching Proteins (18,20,21,38,40,41,45,46)
8 1446/1443 0.037/0.034 CH3 asymmetric bending Proteins (40,42,46)
9 1395/1393 0.065/0.075 CH3 symmetric bending
Amino acid side chains, methyl groups of proteins
(18,20,40,41)
10 1313/1313 NC**
Amide III; C‒N stretching (30%), N‒H bending (30%), C=O stretching (10%), O=C‒N bending (10%) Proteins (21,40,45,46) 11 1246/1246 0.093/0.097 PO2- antisymmetric stretching (non H-bonded) Nucleic acids (mainly), phospholipids, phosphorylated proteins (18,20,21,40,42,46) 12 1110/1111 0.060/0.067 C‒O stretching, C‒C stretching (ring) Carbohydrates, nucleic acids (40,42) 13 1077/1077 0.079/0.077 PO2- symmetric stretching (fully H-bonded Nucleic acids, nucleotides (18,21,40,41,42,46) 14 893/892 0.034/0.030 Different modes of phosphodiester bonds, C‒C, C‒O stretching Nucleic acids (20,40,42,46)
I-shoulder 1683/1683 NC** β-sheet, β-turns and
bends Proteins (38,44-46)
I 1645/1646 0.095e-3/0.150e-3
Disordered structure (random coils), overlaps
with α-helical structure
Proteins (38,44-46)
II 1580/1580 0.023e-3/0.041e-3 Amino acid side chains Proteins (45)
III 1544/1543 0.063e-3/0.103e-3 α-helix, random coils Proteins (44,45)
IV 1516/1516 0.071e-3/0.048e-3 Amino acid side chains Proteins (45,46)
Similarly, a peak at 1446 cm-1 was assigned to CH
3 bending of amino acid side chains. Two peaks at 1246 and 1077 cm-1 arise from PO2- stretching modes of nucleotides and nucleic acids and phosphoproteins in biological samples (18,20,21,40,41,42,46). Detailed studies on the FTIR spectroscopic characterization of proteins in H2O and D2O revealed band patterns which can be used to identify proteins, secondary structures, and amino acid side chains (18,22,38,42-46). The major absorption bands in an IR spectrum of pure proteins are mainly associated with their amide group (i.e. peptide bond). The characteristic bands of proteins arise from C=O, C-N, N-H stretching, N-H bending and O-C-N bending modes of their amide groups and therefore la-belled as Amide bands (e.g. Amide I-VII, A, B) (17-21). The Amide I band originates from C=O stretching (80%), N-H bending (10%) and C-N stretching (10%) modes of proteins. Similarly, the Am-ide II band arises from N-H bending (60%) and C-N stretching (40%) vibrations of amide groups and takes a significant con-tribution from proteins (18,20,21,38,41,44-46). The percentages written in parentheses were calculated by the potential energy distribution approach in previous studies, reflecting the rela-tive contribution of a specific mode to the total change in po-tential energy during vibration (54). A strong band rising from N-H stretching vibrations between 3310-3270 cm-1 is referred to as Amide A band of proteins (45,46) and a weaker band ris-ing again from N-H stretchris-ing modes between 3100-3030 cm-1 is named Amide B band (45,46). A weak band near 1300 cm-1 originates from C-N stretching (30%), N-H bending (30%), C=O stretching (10%) and O=C-N bending (10%) modes of proteins is called the Amide III band (44-46). These bands were also ob-servable in the IR spectrum of M. lebetina venom.
Sub-bands obtained by derivatization (e.g. second derivative) in the Amide I-II region, ranging between 1700-1500 cm-1 provides information about the protein secondary structures. The Amide I band is generally preferred for analyzing protein structures but the Amide II band can also be used for the same purpose (38,43-46). It is a widely-applied procedure to obtain information about secondary structures of proteins by spectral interpretation using FTIR data since previous studies using pure peptides and proteins provided knowledge for this practice by relating specific frequencies to particular protein secondary structures (38,43-46,54). Exact frequencies of sub-bands in the Amide I-II region depend on the H-bonding, involving the am-ide group, which is determined by the secondary structure (46). In the present study, wavenumbers were assigned to the sec-ondary structures of proteins by comparing the reference data previously published in the literature (38,44-46).
Analyzing biological samples gives insight about the unique bio-molecular content and provides information about the amounts of these compounds, as well as molecular alterations (19,42,46). This method also provides an opportunity to analyze the protein secondary structures and structural changes (38,46). There are many published papers on the use of FTIR spectroscopy coupled with multivariate statistical analysis for the elucidation of molec-ular mechanisms and the diagnosis of various diseases such as
cancers, (21,47,48) metabolic disorders (20,41), the classification of microorganisms (49,50), plants (51), and food products (52,53). In the field of toxinology, FTIR spectroscopy has been used to an-alyze the secondary structure of purified snake venom proteins (30-33) but there is scarce data on the physicochemical character-ization of crude snake venoms. In one study, the influence of eco-logical factors on the venom of M. l. obtusa (from Azerbaijan) was investigated by radiobiological and biophysical (spectroscopic) methods (37). The researchers also made an IR spectroscopic characterization using the KBr pellet method, but they present-ed neither a detailpresent-ed assignment list associatpresent-ed to venom mole-cules nor protein secondary structure information. Moreover, the resolution of spectrum figures did not allow an investigation of spectral patterns and the spectrum in two out of three figures seemed too noisy, making clear peak picking not possible. The study reported peaks at 3300, 3100, 3020, 2570, 2100-2260, 1480, 1460, 1350, 1100 cm-1 wavenumbers. It assigned peaks above 3000 cm-1 to N-H stretching, while others to various C-H modes. It also identified peaks between 3100-3700 cm-1 as an indication of the presence of S atoms, but characteristic bands of S containing groups lie below 2600 cm-1 (46). Possible S-H stretching peaks in this region are generally too weak to observe. The research data contained significant differences when compared to the results of this study. The most important protein bands (i.e. Amide I, II) were lacking in the previous study’s reported peaks, which was surprising since the major component of snake venom is pro-tein. Moreover, that study did not report any peak assigned to PO2- stretching modes. This current study presents a more com-prehensive and complete FTIR spectroscopic characterization of both M. l. obtusa and M. l. lebetina.
In another study, chitosan nanoparticles alone and loaded with Echis carinatus venom were measured by FTIR spectroscopy but the spectrum was dominated by peaks originated from chitosan nanoparticles so that it was not possible to obtain information from snake venom (35). After this study, the same group inves-tigated the efficiency of E. carinatus venom loaded chitosan nanoparticles as antigen carrier for antivenom production and they provided the FTIR spectrum of E. carinatus venom obtained by the KBr pellet method together with chitosan, chitosan nanoparticles and E. carinatus venom loaded chitosan nanopar-ticles in the same figure (36). It was not easy to discriminate the venom spectrum from the figure published in the results and it only reported that a venom sample showed peaks around 3305, 1650 and 1541 cm-1 wavenumbers which correspond to the Am-ide A, AmAm-ide I and AmAm-ide II peaks, respectively. These peaks were also visible in the FTIR spectrum of M. lebetina venom obtained in the present study with slightly shifted wavenumbers, due to the protein-based nature of snake venoms. Since the aim of the study by Mirzaei et al. (36) was to investigate the formation of venom loaded nanoparticles, the researchers focused on the spectra of nanoparticles and did not provide a detailed FTIR spectroscopy-based biomolecular characterization of the ven-om sample. With the use of state-of-the-art -ven-omics technologies and approaches such as genomics, transcriptomics, proteomics and metabolomics in toxinology, the characterization of
unex-plored animal venoms can be done faster and more reliably to-day. Within the context of systems biology and -omics approach, FTIR spectroscopy has the potential to provide complementary information for the characterization of snake venoms.
This study optimized the FTIR-ATR procedure, which allowed us to detect absorbance peaks characterizing the major and minor biomolecules in venom samples. Moreover, information about the overall protein secondary structures was obtained by ana-lyzing a second derivative spectrum of the Amide I and Amide II region. As a result, major structures were found as random coil and α-helix, taking contributions from β-sheet structures. This finding is concordant with three dimensional structures of snake venom C-type lectins (55), phospholipase A2s (56), metallopro-teinases (57), and serine prometallopro-teinases (58), which are also the most abundant proteins in the venom of M. lebetina (3,25,59). Each species has a unique combination of proteins in their ven-oms and this method can be used to obtain information reflect-ing the dominant secondary structures of abundant venom pro-teins, as well as to make comparisons between different species and individuals. The study found that the absorbance spectra of two subspecies were quite similar, as an expected result of the research. However, there were some quantitative, qualitative al-terations and peak shifts in both absorbance and second deriva-tive spectra. The Peak II and Peak IV in second derivaderiva-tive spectra originating from amino acid side chains clearly showed a differ-ence between subspecies (Figure 1) and this result emphasized the potential of second derivative spectrum in Amide I-II region for the differentiation of venom samples.
Differences in the area or intensity values of the bands indi-cate that the amount of venom compounds show variation between subspecies. Inter and intraspecies variation in snake venoms is a well-known phenomenon (60) which can explain the differences we observed in the present study. Moreover, the venom proteins of M. l. lebetina and M. l. obtusa were pre-viously compared by using two-dimensional polyacrylamide gel electrophoresis (2D-PAGE) method and results showed that there was a variation between these two taxa (3). Al-though the FTIR spectroscopy method gives resulting peaks rising from different vibrational modes of overall molecules in the sample, the results of the present study showed that its sensitive measurement can provide data especially in the second derivative spectrum in Amide I-II region to uncover the venom variation between different taxa.
Major absorbance peaks observed in the present study such as Amide A, B, I, II and III arise from proteins (Table 1), which was an expected result since snake venoms mainly consist of pro-teins and peptides (1-3). Additionally, some other peaks were observable originating from other biological macromolecules such as nucleic acids and carbohydrates. The main bioactive compounds responsible for the pharmacological properties of snake venoms are proteins and peptides but the other mole-cules such as amines, nucleosides, carbohydrates and inorgan-ic elements, whinorgan-ich can be referred to as minor components, contribute to the activity of these proteins (4). The Fourier
transform infrared spectroscopy method provides information about all the bioorganic molecules allowing the researchers to analyze minor components of crude venoms. There was little information in the literature about the aforementioned minor components of snake venom, except some very old research. Recently, in a study by Villar-Briones and Aird (5), small metab-olites and peptides were screened in the venom of 15 different taxa belonging to Elapidae, Viperinae and Crotalinae by using liquid chromatography-mass spectrometry (LC-MS) which re-visited the small organic molecule content of snake venoms. They detected carboxylic acids, purine nucleosides and their bases, neurotransmitters, amines, amino acid residues, and peptides as abundant small organic molecules.
We observed C-O and C-C stretching vibration modes originat-ing from carbohydrates. Although old publications reported the presence of sugars such as galactose, glucose, mannose and fucose in some Viperid and Elapid species (61), observed peaks may also arise from the carbohydrate moieties of nucle-osides, nucleotides (4,5) and venom glycoproteins (5,62). Poly-saccharides are not reported from snake venoms. This research also detected peaks characterizing PO2- stretching modes mainly arising from nucleic acids and nucleotides. The presence of nucleosides in snake venom and its role in toxicity was doc-umented but there was limited information on free nucleotides (4,5). However, it is known that snake venom contains ribonu-cleic acid (RNA) (63,64) and deoxyribouribonu-cleic acid (DNA) (65,66), which comes from the cells covering the lumen of the venom gland. In line with this information, it is highly possible that peaks originating from PO2- stretching vibrations in the FTIR spectrum arise mainly from nucleic acid backbone and nucle-osides. Phosphate groups of phosphorylated proteins may also contribute to these bands. Stretching vibration peaks of CH2 and CH3 groups were also observed which may originate from proteins and lipids but there is scarce information on the occur-rence of lipids in snake venom (4) and more studies should be conducted on this topic.
CONCLUSION
In conclusion, we applied the FTIR-ATR method for crude snake venom analysis and obtained the molecular fingerprint spec-trum of M. l. lebetina and M. l. obtusa venom samples in the mid-IR region. This method is fast, sensitive to molecular alter-ations and does not require time-consuming sample prepara-tion, which is suitable for the direct measurement of lyophilized venom samples. It provides rapid information about not only proteins, but also minor constituents of snake venoms. Al-though this method is not sufficient alone to fully characterize an unexplored venom, once the spectral libraries including data from different known species is obtained it may be possible to classify and identify venom samples using multivariate statisti-cal analyses such as hierarchistatisti-cal cluster analysis and principal component analysis coupled with linear discriminant analysis, as well as to make quality control and stability testing of crude venom products. These kinds of classifications of biological samples were successfully achieved by FTIR spectroscopy
(47-52). Moreover, this method can be used to assess the individual venom variation. The results of this study show the usefulness and feasibility of this method in the field of toxinology. It also provides a peak assignment table which will be useful for oth-er similar studies as a refoth-erence list. Although the absorbance spectra of two subspecies were almost identical (except some quantitative differences), the second derivative spectra showed differences in the Amide I-II region. Therefore, the second deriv-ative spectra should be taken in consideration in similar studies. The sample size of this study was not enough to perform sta-tistical analyses but this approach deserves further studies in-cluding more individual venom samples from different species and families to test the sensitivity and specificity of the meth-od supported with univariate and multivariate statistics. Such studies will reveal the potential of this method for classifying crude venoms by using chemometric analyses.
Acknowledgement: We greatly acknowledge and dedicate this article to late Prof. Dr. Bayram GÖÇMEN who passed away tragically on 22 March 2019, for his great contributions to the field herpetology and his invaluable support to the studies re-lated to snake venoms in Turkey by providing venom samples. We also thank Assoc. Prof. Mehmet Zülfü YILDIZ (Adıyaman University Department of Biology), Assoc. Prof. Bahadır AKMAN (Iğdır University) and Assoc. Prof. Deniz YALÇINKAYA (Toros Uni-versity) for their helps in the field studies.
Peer-review: Externally peer-reviewed.
Author Contributions: Conception/Design of study: N.I., F.D.O.D.; Data Acquisition: N.I.; Data Analysis/Interpretation: N.I.; Drafting Manuscript: N.I., F.D.O.D.; Critical Revision of Man-uscript: N.I., F.D.O.D.; Final Approval and Accountability: D N.I., F.D.O.D.; Technical or Material Support: F.D.O.D.; Supervision: F.D.O.D.
Conflict of Interest: The authors declare that they have no con-flicts of interest to disclose.
Financial Disclosure: There are no funders to report for this submission.
REFERENCES
1. Tu AT. Overview of snake venom chemistry. Singh BR, Tu AT, edi-tors. Natural Toxins II. New York: Plenum Press; 1996. pp. 37–62. 2. Chippaux JP. Snake venoms and envenomations. 1st ed. Florida:
Krieger Publishing Company; 2006.
3. Igci N, Ozel Demiralp D. A preliminary investigation into the ven-om proteven-ome of Macrovipera lebetina obtusa (Dwigubsky, 1832) from Souheastern Anatolia by MALDI-TOF mass spectrometry and comparison of venom protein profiles with Macrovipera lebetina
lebetina (Linnaeus, 1758) from Cyprus by 2D-PAGE. Arch Toxicol
2012; 86(3): 441–51.
4. Bieber AB. Metal and Nonprotein Constituents of Snake Venoms. Lee CY, editor. Snake venoms. Handbook of experimental pharma-cology. Berlin, Heidelberg: Springer; 1979. pp. 295–306.
5. Villar-Briones A, Aird SD. Organic and peptidyl constituents of snake venoms: The picture is vastly more complex than we imag-ined. Toxins 2018; 10(392): 1–49.
6. Lewis RJ, Garcia ML. Therapeutic potential of venom peptides. Nat Rev Drug Discov 2003; 2(10): 790–802.
7. Vetter I, Davis JL, Rash LD, Anangi R, Mobli M, Alewood PF, et al. Venomics: a new paradigm for natural products-based drug dis-covery. Amino Acids 2011; 40(1): 15–28.
8. Vonk FJ, Jackson K, Doley R, Madaras F, Mirtschin PJ, Vidal N. Snake venom: From fieldwork to the clinic: Recent insights into snake bi-ology, together with new technology allowing high-throughput screening of venom, bring new hope for drug discovery. Bioessays 2011; 33(4): 269–79.
9. Atatür MK, Göçmen B. Kuzey Kıbrıs’ın kurbağa ve sürüngenleri– amphibians and reptiles of Northern Cyprus. 1st ed. Izmir: Ege Üniversitesi Yayınları Fen Fakültesi Kitaplar Serisi No: 170; 2001. 10. Mallow D, Ludwig D, Nilson G. True vipers: Natural history and
toxinology of old world vipers. 1st ed. Florida: Krieger Publishing Company; 2003.
11. Budak A, Göçmen B. Herpetoloji. 2nd ed. Izmir: Ege Üniversitesi Yayınları Fen Fakültesi Yayın No: 194; 2008.
12. Stümpel N, Joger U. Recent advances in phylogeny and taxonomy of Near and Middle Eastern Vipers – an update. ZooKeys 2009; 31: 179–91.
13. Göçmen B, Atatür MK, Budak A, Bahar H, Yildiz MZ, Alpagut-Keskin N. Taxonomic notes on the snakes of Northern Cyprus, with observa-tions on their morphologies and ecologies. Anim Biol 2009; 59: 1–30. 14. Swaroop S, Grab B. Snakebite mortality in the World. Bull World
Health Organ 1954; 10(1): 35–76.
15. Cesaretli Y, Ozkan O. Snakebites in Turkey: epidemiological and clinical aspects between the years 1995 and 2004. J Venom Anim Toxins Incl Trop Dis 2010; 16(4): 579–86.
16. Sherman Hsu CP. Infrared Spectroscopy. Settle FA, editor. Hand-book of instrumental techniques for analytical chemistry. New Jersey: Prentice Hall; 1997. pp. 247–83.
17. Özel Demiralp FD, İğci N, Peker S, Ayhan B. Temel proteomik strate-jiler. 1st ed. Ankara: Ankara Üniversitesi Yayınevi; 2014.
18. Severcan F, Akkas SB, Turker S, Yucel R. Methodological approaches from experimental to computational analysis in vibrational spec-troscopy and microspecspec-troscopy. Severcan F, Haris PI, editors. Vi-brational spectroscopy in diagnosis and screening. Amsterdam: IOS Press; 2012. pp. 12–52.
19. Baker MJ, Trevisan J, Bassan P, Bhargava R, Butler HJ, Dorling KM, et al. Using fourier transform IR spectroscopy to analyze biological materials. Nat Protoc 2014; 9(8): 1771–91.
20. Igci N, Sharafi P, Ozel Demiralp D, Demiralp CO, Yuce A, Dokmeci Emre S. Application of Fourier transform infrared spectroscopy to biomolecular profiling of cultured fibroblast cells from Gaucher disease patients: A preliminary investigation. Adv Clin Exp Med 2017; 26(7): 1053–61.
21. Bozdag G, Igci N, Calis P, Ayhan B, Ozel Demiralp D, Mumusoglu S, et al. Examination of cervical swabs of patients with endometriosis using Fourier transform infrared spectroscopy. Arch Gynecol Ob-stet 2019; 299(5): 1501–08.
22. Haris PI, Severcan F. FTIR spectroscopic characterization of protein structure in aqueous and non-aqueous media. J Mol Catal B Enzym 1999; 7(1–4): 207–21.
23. Bazaa A, Marrakchi N, El Ayeb M, Sanz L, Calvete JJ. Snake venom-ics: comparative analysis of the venom proteomes of the Tunisian snakes Cerastes cerastes, Cerastes vipera and Macrovipera lebetina. Proteomics 2005; 5(16): 4223–35.
24. Arıkan H, Göçmen B, Kumlutaş Y, Alpagut-Keskin N, Ilgaz Ç, Yıldız MZ. Electrophoretic characterisation of the venom samples ob-tained from various Anatolian snakes (Serpentes: Colubridae, Vi-peridae, Elapidae). North-West J Zool 2008; 4(1): 16–28.
25. Sanz L, Ayvazyan N, Calvete JJ. Snake venomics of the Armenian mountain vipers Macrovipera lebetina obtusa and Vipera raddei. J Proteomics 2008; 71: 198–209.
26. Calvete JJ, Sanz L, Angulo Y, Lomonte B, Gutiérrez JM. Venoms, ve-nomics, antivenomics. FEBS Lett 2009; 583(11): 1736–43. 27. Nalbantsoy A, Hempel BF, Petras D, Heiss P, Göçmen B, İğci N, Yıldız
MZ, Süssmuth RD. Combined venom profiling and cytotoxicity screening of the Radde’s mountain viper (Montivipera raddei) and mount bulgar viper (Montivipera bulgardaghica) with potent cyto-toxicity againts human A549 lung carcinoma cells. Toxicon 2017; 135: 71–83.
28. Petras D, Hempel BF, Göçmen B, Karis M, Whiteley G, Wagstaff SC, et al. Intact protein mass spectrometry revals intraspecies variations in venom composition of a local population of Vipera
kaznakovi in north eastern Turkey. J Proteomics 2019; 199: 31–
50.
29. Siigur J, Aaspõllu A, Siigur E. Biochemistry and pharmacology of proteins and peptides purified from the venoms of the snakes
Macrovipera lebetina subspecies. Toxicon 2019; 158: 16–32.
30. Aird SD, Middaugh CR, Kaiser II. Spectroscopic characterization of textilotoxin, a presynaptic neurotoxin from the venom of the australian eastern brown snake (Pseudonaja t. textilis). Biochim Bio-phys Acta Protein Struct Mol Enzymol 1989; 997(3): 219–23. 31. Lamthanh H, Léonetti M, Nabedryk E, Ménez A. CD and FTIR
stud-ies of an immunogenic disulphide cyclized octadecapeptide, a fragment of a snake curaremimetic toxin. Biochim Biophys Acta Protein Struct Mol Enzymol 1993; 1203(2): 191–8.
32. Cecchini AL, Soares AM, Cecchini R, Oliveira AHC, Ward RJ, Giglio JR, et al. Effect of crotapotin on the biological activity of Asp49 and Lys49 phospholipases A2 from Bothrops snake venoms. Comp
Bio-chem Physiol C Toxicol Pharmacol 2004; 138(4): 429–36.
33. Oliveira KC, Spencer PJ, Ferreira Jr RS, Nascimento N. New insights into the structural characteristics of irradiated crotamine. J Venom Anim Toxins Incl Trop Dis 2015; 21: 14.
34. Bhowmik T, Saha PP, Sarkar A, Gomes A. Evaluation of cytotoxici-ty of a purified venom protein from Naja kaouthia (NKCT1) using gold nanoparticles for targeted delivery to cancer cell. Chem Biol Interact 2017; 261: 35–49.
35. Mohammadpour Dounighi M, Mehrabi M, Avadi MR, Zolfagharian H, Rezayat M. Preparation, characterization and stability investi-gation of chitosan nanoparticles loaded with the Echis carinatus snake venom as a novel delivery system. Arch Razi Inst 2015; 70(4): 269–77.
36. Mirzaei F, Mohammadpour Dounighi N, Avadi MR, Rezayat M. A new approach to antivenom preparation using chitosan nanopar-ticles containing Echis carinatus venom as a novel antigen delivery system. Iran J Pharm Res 2017; 16(3): 858–67.
37. Shafiga T, Huseyn A. Radiobiological and biophysical showing of venom of Macrovipera lebetina obtusa. IJREH 2017; 1(3): 1–12. 38. Adigüzel Y, Haris PI, Severcan F. Screening of proteins in cells and
tissues by vibrational spectroscopy. Severcan F, Haris PI, editors. Vibrational spectroscopy in diagnosis and screening. Amsterdam: IOS Press; 2012. pp. 53–108.
39. Severcan F, Toyran N, Kaptan N, Turan B. Fourier transform infrared study of the effect of diabetes on rat liver and heart tissues in the C–H region. Talanta 2000; 53(1): 55–9.
40. Movasaghi Z, Rehman S, Rehman I. Fourier transform infrared (ftir) spectroscopy of biological tissues. Appl Spectrosc Rev 2008; 43(2): 134–79.
41. Severcan F, Bozkurt O, Gurbanov R, Gorgulu G. FT-IR spectroscopy in diagnosis of diabetes in rat animal model. J Biophotonics 2010; 3(8–9): 621–31.
42. Rehman I, Movasaghi Z, Rehman S. Vibrational spectroscopy for tissue analysis. 1st ed. Florida: CRC Press, 2013.
43. Jackson M, Mantsch HH. The use and misuse of FTIR spectroscopy in the determination of protein structure. Crit Rev Biochem Mol Biol 1995; 30(2): 95–120.
44. Goormaghtigh E, Ruysschaert J-M, Raussens V. Evaluation of the information content in infrared spectra for protein secondary structure determination. Biophys J 2006; 90(8): 2946–57.
45. Barth A. Infrared spectroscopy of proteins. Biochim Biophys Acta 2007; 1767(9): 1073–101.
46. Stuart B. Biological applications of infrared spectroscopy. 1st ed. West Sussex: John Wiley & Sons, 1997.
47. Cheung KT, Trevisan J, Kelly JG, Ashton KM, Stringfellow HF, Taylor SE, et al. Fourier-transform infrared spectroscopy discriminates a spectral signature of endometriosis independent of inter-individ-ual variation. Analyst 2011; 136(10): 2047–55.
48. Bellisola G, Sorio C. Infrared spectroscopy and microscopy in can-cer research and diagnosis. Am J Cancan-cer Res 2012; 2(1): 1–21. 49. Garip S, Bozoglu F, Severcan F. Differentiation of mesophilic and
thermophilic bacteria with fourier transform infrared spectrosco-py. Appl Spectrosc 2007; 61(2): 186–92.
50. Maity JP, Kar S, Lin C-M, Chen C-Y, Chang Y-F, Jean J-S, et al. Iden-tification and discrimination of bacteria using Fourier transform infrared spectroscopy. Spectrochim Acta A Mol Biomol Spectrosc 2013; 116: 478–84.
51. Turker Gorgulu S, Dogan M, Severcan F. The characterization and differentiation of higher plants by fourier transform infrared spec-troscopy. Appl Spectrosc 2007; 61(3): 300–8.
52. Gok S, Severcan M, Goormaghtigh E, Kandemir I, Severcan F. Dif-ferentiation of Anatolian honey samples from different botanical origins by ATR-FTIR spectroscopy using multivariate analysis. Food Chem 2015; 170: 234–40.
53. Deniz E, Güneş Altuntaş E, Ayhan B, İğci N, Özel Demiralp D, Can-doğan K. Differentiation of beef mixtures adulterated with chicken or turkey meat using FTIR spectroscopy. J Food Process Preserv 2018; 42: e13767.
54. Krimm S, Bandekar J. Vibrational spectroscopy and conformation of peptides, polypeptides and proteins. Anfinsen CB, Edsall JT, Richards FM, editors. Advances in protein biochemistry, vol. 38. New York: Academic Press; 1986. pp. 181–364.
55. Jebali J, Fakhfekh E, Morgen M, Srairi-Abid N, Majdoub H, Gargouri A, et al. Lebecin, a new C-type lectin like protein from Macrovipera
lebetina venom with anti-tumor activity against the breast cancer
cell line MDA-MB231. Toxicon 2014; 86: 16–27.
56. Tonello F, Rigoni M. Cellular Mechanisms of Action of Snake Phos-pholipase A2 Toxins. In: Gopalakrishnakone P, Inagaki H, Vogel CW,
Mukherjee A, Rahmy T, editors. Snake Venoms. Dordrecht: Spring-er, 2017: 49–65.
57. Takeda S. ADAM and ADAMTS family proteins and snake venom metalloproteinases: A structural overview. Toxins 2016; 8(155): 1–38.
58. Zeng F, Shen B, Zhu Z, Zhang P, Ji Y, Niu L, et al. Crystal structure and activating effect on RyRs of AhV_TL-I, a glycosylated throm-bin-like enzyme from Agkistrodon halys snake venom. Arch Toxicol 2013; 87(3): 535–45.
59. İğci N, Özel Demiralp FD, Yıldız MZ. Cytotoxic activities of the crude venoms of Macrovipera lebetina lebetina from Cyprus and M. l.
ob-tusa from Turkey (Serpentes: Viperidae) on human umbilical vein
endothelial cells. Comm J Biol 2019; 3(2): 110–3.
60. Chippaux JP, Williams V, White J. Snake venom variability: Methods of study, results and interpretation. Toxicon 1991; 29(11): 1279– 303.
61. Devi A. The protein and nonprotein constituents of snake venoms. Bücherl W, Buckley EE, Deulofeu V, editors. Venomous animals and their venoms. New York: Academic Press; 1968. pp. 119–65. 62. Gowda DC, Davidson EA. Structural features of carbohydrate
moi-eties in snake venom glycoproteins. Biochem Biophys Res Com-mun 1992; 182(1): 294–301.
63. Currier RB, Calvete JJ, Sanz L, Harrison RA, Dowley PD, Wagstaff SC. Unusual stability of messenger RNA in snake venom reveals gene expression dynamics of venom replenishment. PLoS ONE 2012; 7(8): e41888.
64. Modahl CM, Mackessy SP. Full-length venom protein cDNA se-quences from venom-derived mRNA: Exploring compositional variation and adaptive multigene evolution. PLoS Negl Trop Dis 2016; 10(6): e0004587.
65. Pook CE, McEwing R. Mitochondrial DNA sequences from dried snake venom: a DNA barcoding approach to the identification of venom samples. Toxicon 2005; 46(7): 711-5.
66. Smith CF, McGlaughlin ME, Mackessy SP. DNA barcodes from snake venom: a broadly applicable method for extraction of DNA from snake venoms. Biotechniques 2018; 65(6): 339–45.