661 http://journals.tubitak.gov.tr/medical/ © TÜBİTAK
doi:10.3906/sag-1807-152
The impact of JAK/STAT inhibitor ruxolitinib on the genesis of lymphoproliferative diseases
Can TÜRK1,*, Müfide OKAY2, Seyhan TÜRK3, Elif Sena TEMİRCİ4, Osama JAVAD4,Salih AKSU2, Nilgün SAYINALP2, İbrahim Celalettin HAZNEDAROĞLU2 1Department of Medical Microbiology, Faculty of Medicine, Lokman Hekim University, Ankara, Turkey
2Department of Internal Medicine, Faculty of Medicine, Hacettepe University, Ankara, Turkey 3Department of Biochemistry, Faculty of Pharmacy, Hacettepe University, Ankara, Turkey 4Department of Molecular Biology and Genetics, Faculty of Science, Bilkent University, Ankara, Turkey
* Correspondence: [email protected]
1. Introduction
Ruxolitinib, a novel oral JAK 1 and 2 inhibitor, was newly certified as a revolutionary treatment for patients suffering from intermediate/high risk myelofibrosis (1). It was demonstrated that the exposure of cutaneous T-cell lymphoma cell lines triggered a dose-dependent inhibition of cell proliferation by a mechanism that impacted the control of DNA synthesis, with a significant decline in the basal levels of phospho-STAT3 (2).
Furthermore, the ruxolitinib-mediated decrease in circulating proinflammatory cytokine levels is connected to its inhibitory effects on JAK1-mediated signaling; this may make ruxolitinib a tempting therapeutic agent for MYD88 mutation-positive lymphoma patients, as this mutation leads to cell-autonomous activation of JAK 1 and JAK 2 (3). JAK/STAT signaling has been detected to be vital in the mammary gland, lymphocytes, adipocytes, neuronal cells, cardiomyocytes, hepatocytes, eye cells,
and stem cells. Deregulation in the JAK/STAT pathway is suggested as a cause of numerous diseases including the emergence and the advancement of cancer cells (4).
The JAK/STAT pathway controls embryonic development and is also a part of the regulation of many processes such as stem cell maintenance, hematopoiesis, and the inflammatory response (5). STATs have critical as well as nonredundant functions in lymphocyte development. They impact cell fate decisions like differentiating naive T cells, regulate the intensity and period of inflammatory responses, and contributes to pathogenic mechanisms in chronic inflammatory diseases. STAT3 governs the differentiation of naive T cells into the regulatory and inflammatory T-cell lineages. It also controls cell growth, apoptosis, and the transcription of inflammatory genes, and it contributes to the development of chronic inflammatory diseases, as well as malignant and neurodegenerative diseases (5). STATs are also known to Background/aim: Ruxolitinib, a JAK/STAT signaling pathway inhibitor targeted drug, has been approved for the controlling of disease
symptoms and splenomegaly in patients with myeloproliferative neoplastic diseases. Recently, it has been proposed that ruxolitinib-induced JAK/STAT pathway inhibition in myelofibrosis is associated with an elevated frequency of aggressive B-cell lymphomas. However, the biological basis and significance of this pharmacobiological adverse event is unknown. The aim of this bioinformatics study is to detect any possible confounding effects of ruxolitinib on the genesis of lymphoproliferative disorders.
Materials and methods: The gene expression data were retrieved from the E-MTAB-783 Cancer Genome Project database. Gene
expression data for all available genes in 26 cell lines belonging to various types of lymphomas were chosen for use in this in silico analysis.
Results: We identified genes that were significant in developing resistance to ruxolitinib in lymphoma cell lines.
Conclusion: Based on the results of our present study, ruxolitinib may potentially lead to the pathological expression of the transcription
factors important in lymphoma genesis, neoplastic commitment on the progenitor lymphoid cells, inhibition of repressor transcriptions protective for lymphoma development, inhibition of apoptosis, promotion of neoplastic proliferation, transcriptional activation, and proliferation of malignant neoplastic B cells.
Key words: Lymphoma, ruxolitinib, JAK/STAT signaling pathway
Received: 17.07.2018 Accepted/Published Online: 03.03.2019 Final Version: 18.04.2019
control counteracting cellular events by contributing to the induction of apoptosis, as well as in differentiation and stem cell maintenance. STAT3 signaling throughout mammary gland involution induces epithelial cell death. In opposition to this, persistent and enhanced STAT3 activation is an initiator of tumorigenesis (5). Moreover, JAK/STAT signaling leads to immunosuppression and controls inflammatory responses, obesity, stem cell maintenance, and the premetastatic niche development. These effectors and the direct and mediated mechanisms of JAK/STAT signaling in and on tumors cells improved our outlooks for JAK/STAT-based cancer therapeutics (5).
The aim of this bioinformatics study is to detect any possible confounding effects of ruxolitinib on the genesis of lymphoproliferative disorders. Recently, it has been proposed that ruxolitinib-induced JAK/STAT pathway inhibition in myelofibrosis is associated with an elevated frequency of aggressive B-cell lymphomas (6). Elucidation of this unique drug acting on multiple biological downstream paths is important since it is already accepted as a standard medication for the real-life management of patients with chronic myeloproliferative disorders, namely myelofibrosis and polycythemia vera (PV) (7,8). The management of such patients is based on randomized clinical trials such as the COMFORT-I, COMFORT-II, and RESPONSE trials and real-life administration data (9–11). However, chronic myeloproliferative disorders are relatively benign diseases in comparison to the acute myeloproliferation. Therefore, there is a general safety concern for the long-term administration of ruxolitinib, particularly for the emergence of secondary malignancies such as lymphomas (9,10). Hence, the findings of this study can underline the complication of lymphoma development with the probable relative long-term usage of ruxolitinib as a JAK/STAT signal transduction inhibitor (6).
2. Materials and methods
2.1. Microarray gene expression and drug cytotoxicity data
The gene expression data used in this study were retrieved from the E-MTAB-783 Cancer Genome Project (CGP) database and RMA-normalized (12). The database contained data for 13,513 genes, amounting to 22,279 probe sets. The expression of these genes in 773 cell lines, belonging to a variety of cancer types, was available. Out of these, gene expression data for all available genes in 26 cell lines belonging to various types of lymphomas (B-cell lymphoma, Burkitt lymphoma, and Hodgkin lymphoma) were chosen for use in in silico analysis. The drug cytotoxicity data for ruxolitinib were obtained from the E-MTAB-783 CGP database for drug sensitivity (12).
2.2. Identification of the genes whose expressions corre-lated with ruxolitinib sensitivity
The previously retrieved and RMA-normalized gene expression data for 13,513 genes in 26 lymphoma cell
lines (B-cell lymphoma, Burkitt lymphoma, and Hodgkin lymphoma) were correlated with drug cytotoxicity data for ruxolitinib. Using Pearson correlation analysis, genes that could be associated with ruxolitinib sensitivity were identified.
From this analysis, genes with the highest correlation were then used for further analysis. A list of genes containing all the genes that we were especially interested in investigating was compiled. The selection criteria of genes included clinicopathological correlation of lymphoma genesis and ruxolitinib administration. During the selection of genes, a clinician and molecular biologist worked together in order to determine clinically relevant and biologically important genes to underline the research endpoints. These genes are henceforth referred to as genes of interest in this study and are compiled in Table 1. This list had 200 genes; 155 belonged to the JAK/STAT pathway, 31 were cancer stem cell (CSC) markers, and 14 were immune response markers.
The highly correlated genes from the Pearson correlation analysis were then searched to see if any of them were genes of interest. Following this, the top 10 directly correlated genes and top 10 inversely correlated genes that were highly correlated were selected. Lymphoma cell lines were hierarchically clustered based on these genes, using Gene Cluster 3.0 with Euclidean distance as a similarity metric parameter for genes and arrays, and complete linkage.
2.3. Determination of differentially expressed genes within resistant and sensitive groups
We had gene expression data for 26 lymphoma cell lines. We decided to divide these cell lines into two groups based on IC50 values for ruxolitinib to see if we could distinguish between cell lines that were sensitive to ruxolitinib and cell lines that were resistant to ruxolitinib.
A bar chart and a heat-map were generated in Excel from the IC50 values to visualize the increase in IC50 values across the 26 cell lines. A two-tailed, unpaired t-test was performed between cell lines with the lowest IC50 values, the sensitive group (HDLM2, TUR, BC3), and cell lines with the highest IC50 values, the resistant group (RAJI, DG75, RPMI6666, DB). P < 0.05 was determined to be an appropriate standard for selection of the two groups.
The 200 genes of interest, containing 155 JAK/STAT pathway genes, 31 CSC markers, and 14 immune response markers, were now analyzed within the sensitive group (HDLM2, TUR, BC3) and resistant group (RAJI, DG75, RPMI6666, DB). A two-tailed, unpaired t-test was used to verify which genes were differentially expressed in the two groups. A cut-off of 0.05 was used for the P-values.
Separate hierarchical clusters were first created for all 26 lymphoma cell lines and then for only the 7 cell lines in the two groups, based on the significant differentially
expressed genes. The clustering was done using Gene Cluster 3.0 with Euclidean distance as a similarity metric parameter for genes and arrays, and complete linkage.
2.4. Gene-set enrichment analysis
The gene expression data for all 13,513 genes found in the E-MTAB-783 CGP database, and for the 7 cell lines in the sensitive group (HDLM2, TUR, BC3) and resistant group (RAJI, DG75, RPMI6666, DB), were put into GSEA 3.0 to determine which genes were significantly different within the two groups. Furthermore, we wanted to highlight the pathways that these genes were a part of in both these groups (12).
2.5. Network analysis
Out of the 200 genes of interest, the 25 genes that were differentially expressed were used as input for the GeneMANIA app (13) in Cytoscape (14) to generate a network based on coexpression and genetic interactions. That was done in order to find if the two sets have functionally similar genes related to each other and to determine the associated functions for different groups of genes in the network. The network served as a starting point for the pathway analysis approach in Reactome (15) to filter out regulatory pathways that are relevant for both these gene sets.
3. Results
We identified genes that were significant in developing resistance to ruxolitinib in lymphoma cell lines. We used a statistical approach that allowed us to correlate the IC50 data for ruxolitinib and gene expression for desired genes and create a linear relationship between the two.
3.1. Genes correlated with ruxolitinib sensitivity
The gene expression data for all 13,513 genes in the E-MTAB-783 CGP database for lymphoma cell lines were analyzed (12). By doing Pearson correlation analysis with these genes, we were able to find the most highly correlated genes with ruxolitinib sensitivity. A cut-off of 0.4 was used for the R-values so that a large number of genes could be considered. With this cut-off, 800 genes were shown to be highly correlated with a direct relationship while 584 were shown to be highly correlated with an inverse relationship. Further analyses were done using these highly correlated genes. Of these highly correlated genes, we found a number of genes that were of interest to us. We had compiled a list of 200 genes for this study that we wanted to investigate. The list contained 155 JAK/STAT pathway genes, 31 CSC markers, and 14 immune response markers. Our analysis showed that 4 JAK/STAT pathway genes had a direct relationship with ruxolitinib resistance, Table 1. List of genes of interest used as the basis of this study.
Genes of interest Total = 200
JAK/STAT Genes* Cancer stem cell (CSC) markers** Immune response markers***
Total = 155 Total = 31 Total = 14
GH1, TIMP-1, CSH1, PIK3CB, PIAS3, MPL, APP, IFNAR1, IL6R, AKT1, AKT2, AKT3, AP1, BCL2L1, CBL, CBLB, CBLC, CCND1, CCND2, CEBPB, CISH, CLCF1, CNTF, CNTFR, CREBBP, CRLF2, CSF2, CSF2RA, CSF2RB, CSF3, CSF3R, CTF1, EGF, EGFR, EP300, EPO, EPOR, ERK, GH2, GHR, GRB2, IFNA1, IFNA14, IFNA17, IFNA2, IFNA21, IFNA4, IFNA5, IFNA6, IFNA8, IFNAR2, IFNB1, IFNG, IFNGR1, IFNGR2, IFNW1, IL10, IL10RA, IL10RB, IL11RA, IL12A, IL12B, IL12RB1, IL12RB2, IL13,
CD22, CD27, CD19, CD20, CD40, CD45, ALDH1A1, CCND1, CD10, CD133, CD138, CD15, CD23, CD25, CD30, CD34, CD4, CD43, CD44, CD5, CD7, CD71, CD77, CD80, CD278, CD279, CD3D, CD3E, CD3G, CD4, CD47, CD68, CD8, CTLA4, FoxP3, IDO-1, LAG3, MUM1 IL13RA1, IL13RA2, IL15, IL15RA, IL19, IL2, IL20RA, IL21, IL21R, IL22, IL22RA1,
IL23A, IL24, IL26, IL2RA, IL2RB, IL2RG, IL3, IL3RA, IL4, IL4R, IL5, IL5RA, IL6, IL6ST, IL7, IL7R, IL9, IL9R, IRF9, JAK1, JAK2, JAK3, LEP, LEPR, LIF, LIFR, Mcl-1, MEK2, MTOR, MYC, NFKB1, NFKB2, OSMR, P120, PIAS1, PIAS2, PIAS4, PIK3CA, PIK3CD, PIK3CG, PIK3R1, PIK3R2, PIK3R3, PIK3R5, PIM1, PRL, PRLR, PTPN1, PTPN11, PTPN2, PTPN6, RAF1, SHC1, SOCS1, SOCS2, SOCS3, SOCS5, SOCS7, SOS1, SOS2, SPRED2, SPRY1, SPRY2, SPRY4, SRC, STAM, STAM2, STAT1, STAT2, STAT3, STAT5A, STAT5B, STAT6, SUMO1, TF, TPO, TYK2
CD8A, LMP1, MMP2, MMP7, MMP9, TGFB1
*Genes that are a part of the JAK/STAT mediated signaling pathway. **Genes that are known to be cancer stem cell markers within lymphoma. ***Genes belonging to the immune response pathway that are identified as markers for lymphoma.
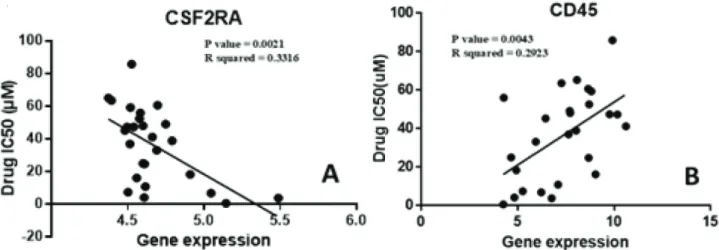
while 8 JAK/STAT pathway genes showed an inverse relationship. Figure 1A shows one of the genes, CSF2RA, which has an inverse relationship with the development of ruxolitinib resistance. On the other hand, we also found a direct linear relationship between the expressions of 5 CSC markers and resistance to the drug. Figure 1B shows the correlation of one of these genes, CD45. Unfortunately, no immune response markers were found among the highly correlated genes. Following this, the ten highest directly correlated genes and the ten highest inversely correlated genes were hierarchically clustered. The results shown in Figure 2 show the presence of two distinct clusters within lymphoma cell lines.
3.2. Determination of sensitive and resistant groups within lymphoma cell lines
The 26 available lymphoma cell lines were divided into two groups, where one group was significantly more resistant to ruxolitinib than the other. Significance was determined by performing a two-tailed, unpaired t-test between the groups and accepting P-values of less than 0.05.
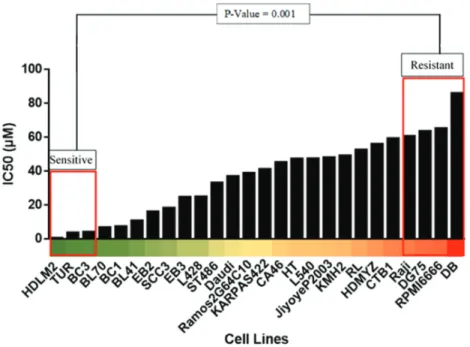
IC50 data for ruxolitinib were plotted for each cell line available. As a result, a comparative bar chart was created, as shown in Figure 3. This allowed for the clear determination of the level of sensitivity of each cell line to ruxolitinib. A heat-map was created to further highlight the range of sensitivity to ruxolitinib in lymphoma cell lines, also seen in Figure 3. Based on the bar chart and the heat-map, the cell lines were divided into two groups. The sensitive group (HDLM2, TUR, BC3) included the cell lines that corresponded to the lowest ruxolitinib IC50 values, hence being the most sensitive to this drug. The resistant group (RAJI, DG75, RPMI6666, DB) included the cell lines that corresponded to the highest ruxolitinib
IC50 values, being the least sensitive and most resistant to action of this drug. The resistant group, compared to the sensitive group, was significantly more resistant to ruxolitinib, with a P-value of 0.001.
3.3. Differentially expressed genes within resistant and sensitive groups
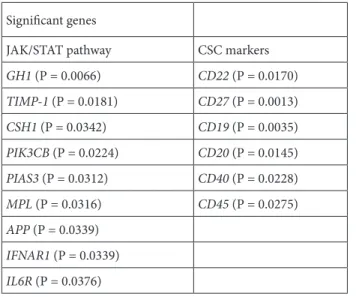
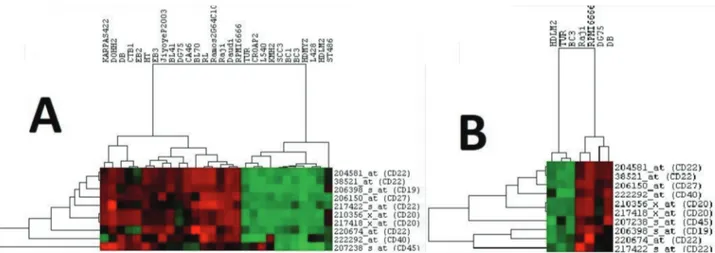
The E-MTAB-783 CGP database for gene expression in cancer cell lines was used with a focus on the lymphoma cell lines that were part of the resistant and sensitive groups (12). Analysis of the comparative gene expression between these two groups revealed that 904 genes were differentially expressed, with P-values of less than 0.05. The results further showed that out of these 904 genes, 15 belonged to the list of 200 genes of interest that we had compiled for this study. These 15 genes are displayed in Table 2 along with their classifications; 9 of these genes are involved in the JAK/STAT pathway while 6 are CSC markers. These genes and their clinical significance are shown in Table 3. This allowed us to form a relationship between the expression of genes of interest and ruxolitinib sensitivity. To further demonstrate this relationship, differentially expressed genes for the JAK/STAT pathway and CSC markers were hierarchically clustered, as shown in Figure 4 and Figure 5, respectively. These figures can be seen having two distinct clusters.
3.4. Gene-set enrichment analysis
Gene-set enrichment analysis was then performed between the sensitive and resistant groups of the lymphoma cell lines. The analysis was performed with all the genes available in the E-MTAB-783 CGP database (12). The results highlighted the genes that showed significant differences between the two groups and provided us with insight about which pathways these significant genes were involved in.
Figure 1. Identification of highly correlated genes. Among the genes that were analyzed with ruxolitinib drug cytotoxicity data, CSC
biomarkers and JAK/STAT pathway genes were among the highly correlated. CD45, A, shows the highest direct correlation among the CSC biomarkers with an r value of 0.54. CSF2RA, B, shows the highest inverse correlation amongst the JAK/STAT pathway genes with an r value of –0.58.
Figure 2. Highly correlated genes show the presence of distinct groups within lymphoma. The top ten directly
correlated genes along with the top ten inversely correlated genes were hierarchically clustered with all available lymphoma cell lines. All gene expressions used were standardized.
Figure 3. The sensitive and resistant groups show significant changes in ruxolitinib IC50. The cell cytotoxicity data for ruxolitinib available in the E-MTAB-783 CGP database were compared for each lymphoma cell line. The bar chart above shows the vast range of IC50 for lymphoma cell lines, which allowed us to create two distinct groups. The selected groups were significant with a P-value of 0.001 (20).
Table 4 and Table 5 respectively show the pathways that were found to be statistically noteworthy, with P-values of less than 0.05, within the sensitive and the resistant groups.
3.5. Network analysis
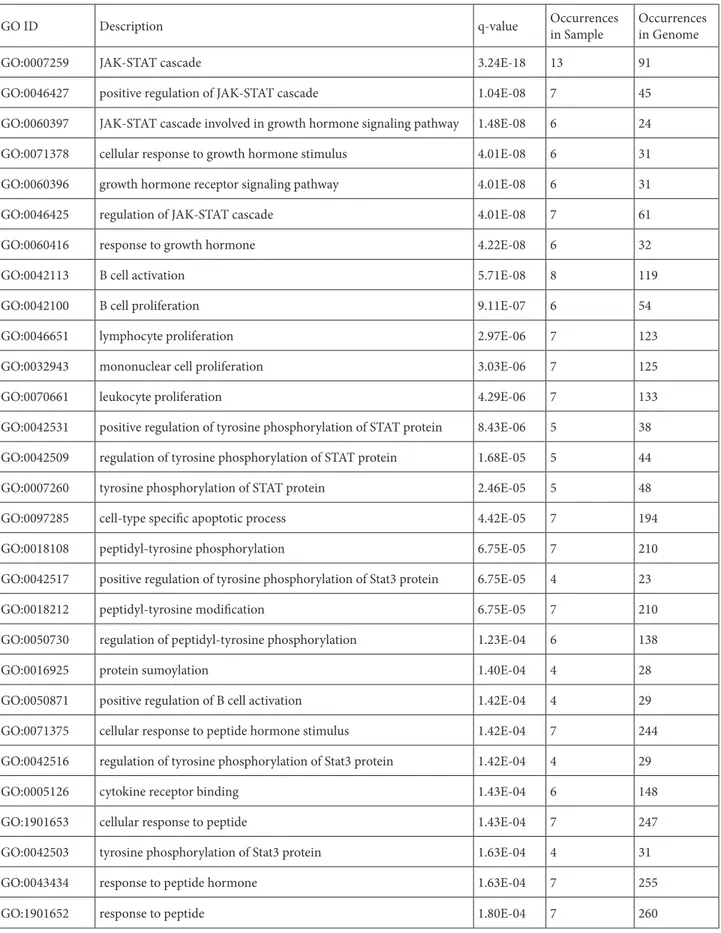
Our previous analysis had revealed that 15 of 200 genes of interest were differentially expressed in the sensitive and resistant groups. Nine of these belonged to the JAK/ STAT pathway while the other 6 were CSC markers. These 15 genes were input into the GeneMANIA app in Cytoscape to generate a network based on coexpression and genetic interactions. Cytoscape tools were used to differentiate the input genes from both sets from the ones that GeneMANIA predicts as likely to share the same function based on their interactions, as seen in Figure 6. From the network, it is distinctly clear that the two sets of genes are connected with one another. Furthermore, the results of GeneMANIA analysis provided a list of associated functions for different groups of genes in the network, as shown in Table 6. The integration of different Table 2. List of genes of interest that are differentially expressed
within resistant and sensitive groups. Significant genes
JAK/STAT pathway CSC markers
GH1 (P = 0.0066) CD22 (P = 0.0170) TIMP-1 (P = 0.0181) CD27 (P = 0.0013) CSH1 (P = 0.0342) CD19 (P = 0.0035) PIK3CB (P = 0.0224) CD20 (P = 0.0145) PIAS3 (P = 0.0312) CD40 (P = 0.0228) MPL (P = 0.0316) CD45 (P = 0.0275) APP (P = 0.0339) IFNAR1 (P = 0.0339) IL6R (P = 0.0376)
Table 3. List of lymphoid cancer stem cell genes that are affected via ruxolitinib usage and their clinical correlations.
Gene* Physiological function** Pathobiological alteration** Possible disordered mechanism** Related lymphoidneoplasms** B-Cell related genes*
CD19 CD20 CD23 CD25 CD22 B-lymphocyte development, growth, differentiation, determination of B-cell functions Neoplastic aberrations resulting in numerous lymphoid malignant disorders Pathological expression of the transcription factors, proliferation of malignant neoplastic B cells T-cell lymphoma (21) B-cell lymphoma (22,23) Hodgkin lymphoma (24,25) Follicular lymphoma (26,27)
T-Cell related genes*
CD5 CD10 LMP-1 T-cell proliferation, inactivation of critical peptide hormones important for lymphoid functions
Pathological alterations of transmembrane glycoproteins and lymphoid cell surface markers Inhibition of cellular apoptosis CLL SLL MCL (29)
Nasal NK/T-cell lymphoma (30) Lymphoid / lineage-related genes* CD45 CD30 CD15 CD79 CD138 CD38 CD43 CD71 Regulation of signaling, lymphoid cellular processes including cell growth, differentiation, mitosis, oncogenic transformation, and immune activation Pathological alterations of cellular proliferation, migration, and cell– matrix interactions
Neoplastic proliferation of B-lymphoid cells and plasma cells DLBCL (31), NK/T-cell lymphoma (32), AITL (33), PTCL (NOS) (34), Hodgkin lymphoma (34), PTCL (35), extranodal NK/T-cell lymphoma (36), DLBCL (37), DLBCL (37), ATLL (20) *Genes affected by ruxolitinib treatment. **Selected physiological actions, pathobiological alterations, possible mechanisms for the genesis of lymphoid neoplasms. CLL: Chronic lymphocytic leukemia, SLL: small lymphocytic lymphoma, MCL: mantle cell lymphoma, DLBCL: diffuse large B cell lymphoma, AITL: adult T-cell leukemia/lymphoma, PTCL: Peripheral T-cell lymphoma, ATLL: adult T-cell leukemia/lymphoma.
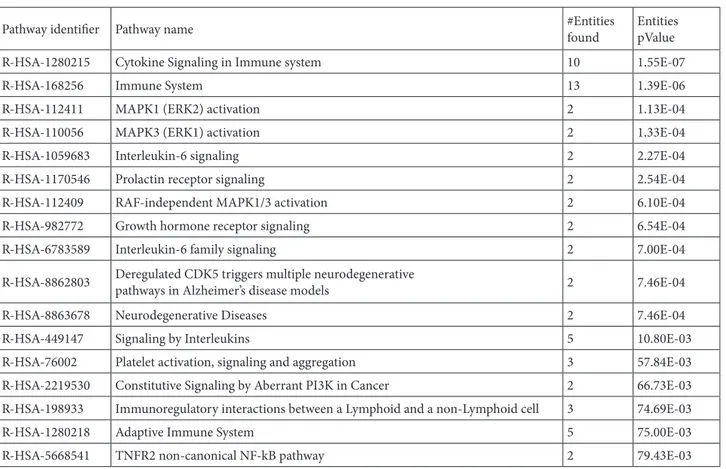
genes together with their function allows for a complete view of potential regulatory mechanisms occurring in a biological process. Reactome analysis was then used to group genes based on their common pathways, demonstrated in Table 7.
4. Discussion
The JAK-STAT pathway may play an important role in the pathogenesis of lymphoma (2,16). In humans, the activator of the JAK-STAT family comprises four JAKs (JAK 1, JAK 2, JAK 3, and tyrosine kinase 2 (TYK 2)) and seven STATs (STAT 1, STAT 2, STAT 3, STAT 4, STAT 5a, STAT 5b, STAT 6)
proteins (5). JAK-STAT proteins play a key role in regulating lymphoid homeostasis and immunity. This includes the maintenance of the balance between the development of T helper 1 (Th1) and T helper 2 (Th2), T-cell response, regulatory T (Treg) cells, and the function of memory CD8+ cells in myeloid and lymphoid development (5). JAK-STAT signaling is perversely activated in lymphoma by multiple mechanisms, together with inappropriate autocrine and paracrine cytokine stimulation. Genetic and epigenetic changes of negative regulators of JAK/STAT signaling, such as loss of function, SOCS1 mutations, and deletions of the protein tyrosine phosphatase 2 (PTPN2), may also cause Figure 4. Clustering of lymphoma cell lines with differentially expressed CSC markers. The CSC markers that were differentially
expressed were first hierarchically clustered with all available lymphoma cell lines as shown in A. These same genes were then clustered with only the sensitive and resistant group cell lines, as shown in B. In both cases two major clusters can be seen, one with sensitive cells and the other with resistant cells.
Figure 5. Clustering of lymphoma cell lines with differentially expressed JAK/STAT pathway genes. Significant JAK/STAT pathway
genes were clustered with all available lymphoma cell lines, shown in A. These genes were then clustered with only the cell lines from the sensitive and resistant groups, as shown in B.
deregulated JAK/STAT initiation in Hodgkin lymphoma, primary mediastinal large B-cell lymphoma, diffuse large B-cell lymphoma, follicular lymphoma, and Peripheral T-cell lymphoma (13). As mentioned, one of the foremost pathways taking part in the signal transductions of a wide array of these cytokines is the JAK/STAT cascade. The JAK/ STAT pathway is crucial for many significant biological processes, including broad immune and hematopoietic cell functions (1).
Acquired mutations may influence the JAK/STAT pathway by activating members of the JAK and STAT families directly, inactivating proteins whose typical function is to
deactivate the JAKs, or establishing autocrine signaling loops that drive JAK-mediated multiplication. Some of the mutations that are found to be linked to lymphoma development directly target genes that encode elements of the JAK/STAT pathway. JAK 1 and STAT 3 mutations show this relationship between lymphoma development and the JAK/STAT pathway (2). However, even in the presence of STAT or JAK mutations, the whole functional cytokine receptors, JAK and STAT, were required to maintain activation and malignant cell proliferation (17). STAT 3 and STAT 5b mutations are present in aggressive lymphomas emerging from natural killer cells as well as Table 4. List of pathways significant within the sensitive group.
GENESET PATHWAY SIZE NOM P FDR q
1 Go_Enzyme_Inhibitor_Activity 19 0 0.013 2 Go_Secretory_Vesicle 32 0 0.064 3 Go_Secretory_Granule 27 0 0.157 4 Go_Vacuolar_Membrane 36 0 0.215 5 Go_Cell_Leading_Edge 26 0.002 0.232 6 Go_Vacuolar_Part 43 0.003 0.095 7 Go_Protein_Complex_Binding 53 0.003 0.189 8 Go_Vacuole 65 0.003 0.279 9 Go_Oxidation_Reduction_Process 45 0.005 0.321 10 Go_Transition_Metal_Ion_Binding 67 0.005 0.268 11 Go_Vesicle_Mediated_Transport 69 0.009 0.257 12 Go_Membrane_Microdomain 20 0.013 0.269 13 Go_Transport_Vesicle 24 0.014 0.261 14 Go_Golgi_Apparatus 78 0.014 0.393 15 Go_Lipid_Localization 18 0.015 0.3 16 Go_Lytic_Vacuole 31 0.016 0.282 17 Go_Hydrolase_Activity_Acting_On_Acid_Anhydrides 43 0.016 0.29 18 Go_Cytoskeletal_Protein_Binding 45 0.016 0.267 19 Go_Cytoskeleton 80 0.017 0.277 20 Go_Sulfur_Compound_Metabolic_Process 20 0.018 0.274 21 Go_Macromolecular_Complex_Binding 67 0.018 0.396 22 Go_Zinc_Ion_Binding 57 0.019 0.335 23 Go_Regulation_Of_Lipid_Metabolic_Process 18 0.022 0.276 24 Go_Locomotion 59 0.022 0.392 25 Go_Presynapse 17 0.024 0.327 26 Go_Golgi_Apparatus_Part 47 0.03 0.272 27 Go_Enzyme_Regulator_Activity 41 0.03 0.387 28 Go_Endocytosis 32 0.037 0.391 29 Go_Positive_Regulation_Of_Cytokine_Production 24 0.037 0.384 30 Go_Golgi_Membrane 36 0.042 0.408
the mutated STATs that are related to increased tyrosine phosphorylation. They supply a growth benefit to natural killer cells, which can be partially inhibited by a JAK 1 and JAK 2 inhibitor (4).
Preliminary studies considering the efficacy of JAK inhibitors illustrate that therapeutic agents targeting the JAK/STAT signaling pathway can be used to treat patients with lymphoma (3). On the other hand, ruxolitinib-induced JAK/STAT pathway inhibition in myelofibrosis is associated with an elevated frequency of aggressive B-cell lymphomas (6). Based on the results of our present in silico study, there must be some concern for the development
of lymphoproliferative neoplastic disease in a given patient under ruxolitinib since the drug affects numerous genes that have a clear impact on the pathobiology of lymphomas. Table 3 summarizes the list of genes present in lymphoid cancer stem cells that were affected by ruxolitinib usage and their clinical correlations. Thus, ruxolitinib may potentially lead to the pathological expression of the transcription factors important in lymphomagenesis, neoplastic commitment on the progenitor lymphoid cells, inhibition of repressor transcriptions protective for lymphoma development, inhibition of apoptosis, promotion of neoplastic proliferation, transcriptional Table 5. List of pathways significant within the resistant group.
GENESET PATHWAY SIZE NOM P FDR q
1 ncRNA Processing 40 0 0
2 Ribosome Biogenesis 37 0 0
3 ncRNA Metabolic Process 44 0 0
4 RNA Catabolic Process 33 0 0
5 Organic Cyclic Compound Catabolic Process 40 0 0.001
6 Ribonucleoprotein Complex Biogenesis 42 0 0.001
7 rRNA Metabolic Process 35 0 0.001
8 Nuclear Transcribed mRNA Catabolic Process Nonsense Mediated Decay 27 0 0.002
9 Structural Constituent Of Ribosome 27 0 0.002
10 Translational Initiation 26 0 0.004
11 Ribonucleoprotein Complex 45 0 0.004
12 Cytosolic Part 25 0 0.005
13 Ribosomal Subunit 25 0 0.005
14 Protein Targeting To Membrane 27 0 0.005
15 Posttranscriptional Regulation Of Gene Expression 27 0 0.005
16 Amide Biosynthetic Process 40 0 0.005
17 Ribosome 27 0.002 0.006
18 Protein Localization To Endoplasmic Reticulum 26 0 0.009
19 Establishment Of Protein Localization To Endoplasmic 26 0 0.011
20 Cytosolic Ribosome 24 0 0.012
21 Regulation Of Cellular Amide Metabolic Process 24 0.003 0.015
22 RNA Processing 63 0 0.016
23 B Cell Activation 15 0 0.02
24 Immune Response Regulating Cell Surface Receptor 19 0 0.021
25 Multi Organism Metabolic Process 26 0.002 0.021
26 RNA Binding 100 0.001 0.024
27 Establishment Of Protein Localization To Membrane 31 0 0.038
28 Poly A RNA Binding 83 0 0.039
29 mRNA Metabolic Process 53 0 0.039
activation, and proliferation of malignant neoplastic B cells (Table 3). Hence, we fully agree with Porpaczy et al. that the detection of a preexisting B-cell clone may identify individuals at risk for lymphoma development and any ruxolitinib candidate should undergo a bone marrow biopsy procedure for the evaluation of clonal lymphoid baseline proliferation (6). This suggestion is particularly helpful for early stage myelofibrosis or PV since those patients potentially have decades for survival (7,18,19). Ruxolitinib is administered for PV just for the control of symptoms, but if lymphoma due to ruxolitinib complicates the clinical picture, the survival could be decreased from about two decades to several months in a given PV patient. Ruxolitinib is a JAK/STAT signaling pathway inhibitor targeted drug with predictable pharmacobiological actions. The main function of the JAK/STAT signaling pathway is cellular proliferation in health and disease. The drug has been approved for the treatment of patients with high- or intermediate-risk myelofibrosis (MF) with symptomatic splenomegaly. The development of lymphoma due to ruxolitinib might be acceptable for a high-risk advanced stage of MF. However, based on the results of our current
study, the administration of ruxolitinib may not be rational for symptom control only in early-stage MF, low-risk MF, and PV patients for the potential pathobiological risk of lymphoma development.
The clinical relevance of the novel results of our study adds support to the concerns of Porpaczy et al. (6). If pharmacobiological aspects of ruxolitinib are related to the danger of the development of lymphoma in patients with chronic myeloproliferative disorders, then decades of usage of the drug could be harmful at least for the patient subpopulation with already present preneoplastic bone marrow lymphoid follicles. Clinicians dealing with the management of chronic myeloproliferative disorders should be aware of this fact and should clinicopathologically check lymphoid neoplastic disorders before and during the administration of ruxolitinib. Of course, myeloid and lymphoid neoplasia are different diseases, but long-term administration of JAK/STAT inhibitors may be located at a crossroads to complicate lymphoma in a patient with chronic myeloproliferative disease.
The development of any drug from bench side to the clinic is very difficult, painful, and expensive. Figure 6. GeneMANIA generated network showing interaction
patterns of JAK/STAT pathway and CSC marker gene sets based on coexpression and genetic interactions. Input genes are shown in blue (14 nodes), while the ones identified as related by the program are shown in green. The coexpression-based interactions are shown by purple edges, while the ones from genetic interactions are shown in green.
Table 6. The list of functions associated with differently grouped genes in the network.
GO ID Description q-value Occurrencesin Sample Occurrencesin Genome
GO:0007259 JAK-STAT cascade 3.24E-18 13 91
GO:0046427 positive regulation of JAK-STAT cascade 1.04E-08 7 45
GO:0060397 JAK-STAT cascade involved in growth hormone signaling pathway 1.48E-08 6 24
GO:0071378 cellular response to growth hormone stimulus 4.01E-08 6 31
GO:0060396 growth hormone receptor signaling pathway 4.01E-08 6 31
GO:0046425 regulation of JAK-STAT cascade 4.01E-08 7 61
GO:0060416 response to growth hormone 4.22E-08 6 32
GO:0042113 B cell activation 5.71E-08 8 119
GO:0042100 B cell proliferation 9.11E-07 6 54
GO:0046651 lymphocyte proliferation 2.97E-06 7 123
GO:0032943 mononuclear cell proliferation 3.03E-06 7 125
GO:0070661 leukocyte proliferation 4.29E-06 7 133
GO:0042531 positive regulation of tyrosine phosphorylation of STAT protein 8.43E-06 5 38 GO:0042509 regulation of tyrosine phosphorylation of STAT protein 1.68E-05 5 44
GO:0007260 tyrosine phosphorylation of STAT protein 2.46E-05 5 48
GO:0097285 cell-type specific apoptotic process 4.42E-05 7 194
GO:0018108 peptidyl-tyrosine phosphorylation 6.75E-05 7 210
GO:0042517 positive regulation of tyrosine phosphorylation of Stat3 protein 6.75E-05 4 23
GO:0018212 peptidyl-tyrosine modification 6.75E-05 7 210
GO:0050730 regulation of peptidyl-tyrosine phosphorylation 1.23E-04 6 138
GO:0016925 protein sumoylation 1.40E-04 4 28
GO:0050871 positive regulation of B cell activation 1.42E-04 4 29
GO:0071375 cellular response to peptide hormone stimulus 1.42E-04 7 244
GO:0042516 regulation of tyrosine phosphorylation of Stat3 protein 1.42E-04 4 29
GO:0005126 cytokine receptor binding 1.43E-04 6 148
GO:1901653 cellular response to peptide 1.43E-04 7 247
GO:0042503 tyrosine phosphorylation of Stat3 protein 1.63E-04 4 31
GO:0043434 response to peptide hormone 1.63E-04 7 255
Sometimes unexpected pharmacobiological adverse effects could complicate the treatment strategy with novel drugs. Therefore, a well-developed scientific strategy is absolutely necessary for the design of clinical studies at all critical points. Ruxolitinib is the first clinically useful
targeted therapy in Ph*-negative MPNs. In the interest of a clinically advanced approach to the study of this drug, the progression of lymphoma development associated with ruxolitinib in addition to the disease risk profile and scoring of MPNs should be included.
Table 7. The resulting pathways from Reactome analysis and the number of genes for each of them ordered by P-value.
Pathway identifier Pathway name #Entities found EntitiespValue
R-HSA-1280215 Cytokine Signaling in Immune system 10 1.55E-07
R-HSA-168256 Immune System 13 1.39E-06
R-HSA-112411 MAPK1 (ERK2) activation 2 1.13E-04
R-HSA-110056 MAPK3 (ERK1) activation 2 1.33E-04
R-HSA-1059683 Interleukin-6 signaling 2 2.27E-04
R-HSA-1170546 Prolactin receptor signaling 2 2.54E-04
R-HSA-112409 RAF-independent MAPK1/3 activation 2 6.10E-04
R-HSA-982772 Growth hormone receptor signaling 2 6.54E-04
R-HSA-6783589 Interleukin-6 family signaling 2 7.00E-04
R-HSA-8862803 Deregulated CDK5 triggers multiple neurodegenerativepathways in Alzheimer’s disease models 2 7.46E-04
R-HSA-8863678 Neurodegenerative Diseases 2 7.46E-04
R-HSA-449147 Signaling by Interleukins 5 10.80E-03
R-HSA-76002 Platelet activation, signaling and aggregation 3 57.84E-03
R-HSA-2219530 Constitutive Signaling by Aberrant PI3K in Cancer 2 66.73E-03
R-HSA-198933 Immunoregulatory interactions between a Lymphoid and a non-Lymphoid cell 3 74.69E-03
R-HSA-1280218 Adaptive Immune System 5 75.00E-03
R-HSA-5668541 TNFR2 non-canonical NF-kB pathway 2 79.43E-03
References
1. Shaker ME, Hazem SH, Ashamallah SA. Inhibition of the JAK/STAT pathway by ruxolitinib ameliorates thioacetamide-induced hepatotoxicity. Food and Chemical Toxicology 2016; 96: 290-301. doi: 10.1016/j.fct.2016.08.018
2. Scott LM. Inhibitors of the JAK/STAT pathway, with a focus on ruxolitinib and similar agents. Communications Chemistry 2018; 17: 107-134. doi: 10.1007/978-3-319-75184-9_6 3. Scott LM, Gandhi MK. Deregulated JAK/STAT signalling in
lymphomagenesis, and its implications for the development of new targeted therapies. Blood Reviews 2015; 29: 405-415. doi: 10.1016/j.blre.2015.06.002
4. Groner B, von Manstein V. JAK STAT signaling and cancer: opportunities, benefits and side effects of targeted inhibition. Molecular and Cellular Endocrinology 2017; 451: 1-14. doi: 10.1016/j.mce.2017.05.033
5. Thomas SJ, Snowden JA, Zeidler MP, Danson SJ. The role of JAK/STAT signalling in the pathogenesis, prognosis and treatment of solid tumours. British Journal of Cancer 2015; 113: 365-371. doi: 10.1038/bjc.2015.233
6. Porpaczy E, Tripolt S, Hoelbl-Kovacic A, Gisslinger B, Bago-Horvath Z et al. Aggressive B-cell lymphomas in patients with myelofibrosis receiving JAK1/2 inhibitor therapy. Blood 2018; 132: 694-706. doi: 10.1182/blood-2017-10-810739
7. Diamantidis MD. Ruxolitinib for myelofibrosis. New England Journal of Medicine 2012; 366: 2031-2032. doi: 10.1056/ NEJMc1203704
8. Soyer N, Haznedaroğlu İC, Cömert M, Çekdemir D, Yılmaz M et al. Multicenter retrospective analysis of Turkish patients with chronic myeloproliferative neoplasms. Turkish Journal of Hematology 2017; 34: 27-33. doi: 10.4274/tjh.2016.0005
9. Eliaçık E, Işık A, Aksu S, Üner A, Büyükaşık Y et al. Pharmacobiological approach for the clinical development of ruxolitinib in myeloproliferative neoplasms. Turkish Journal of Hematology 2015; 32: 163-167. doi: 10.4274/tjh.2013.0265 10. Haznedaroglu IC. Ruxolitinib for myelofibrosis. New
England Journal of Medicine 2012; 366: 2032. doi: 10.1056/ NEJMc1203704
11. Saydam G. Efficacy and safety of ruxolitinib in 132 Turkish patients with myelofibrosis: a multicenter and retrospective analysis. Clinical Lymphoma, Myeloma and Leukemia 2018; 18: 265. doi: 10.1016/j.clml.2018.07.180
12. Garnett MJ, Edelman EJ, Heidorn SJ, Greenman CD, Dastur A et al. Systematic identification of genomic markers of drug sensitivity in cancer cells. Nature 2012; 483: 570-575. doi: 10.1038/nature11005
13. Warde-Farley D, Donaldson SL, Comes O, Zuberi K, Badrawi R et al. The GeneMANIA prediction server: Biological network integration for gene prioritization and predicting gene function. Nucleic Acids Research 2010; 38: 214-220. doi: 10.1093/nar/gkq537
14. Shannon P, Markiel A, Ozier O, Baliga NS, Wang JT et al. Cytoscape: A software Environment for integrated models of biomolecular interaction networks. Genome Research 2003; 13: 2498-2504. doi: 10.1101/gr.1239303
15. Croft D, Mundo AF, Haw R, Milacic M, Weiser J et al. The Reactome Pathway Knowledgebase. Nucleic Acids Research 2014; 42: 472-477. doi: 10.1093/nar/gkt1102
16. Pérez C, González-Rincón J, Onaindia A, Almaráz C, García-Díaz N et al. Mutated JAK kinases and deregulated STAT activity are potential therapeutic targets in cutaneous T-cell lymphoma. Haematologica 2015; 100: 450-453. doi: 10.3324/ haematol.2015.132837
17. Waldmann TA, Chen J. Disorders of the JAK/STAT pathway in T cell lymphoma pathogenesis: implications for immunotherapy. Annual Review of Immunology 2017; 35: 533-550. doi: 10.1146/annurev-immunol-110416-120628 18. Buyukasik Y, Haznedaroğlu İ, Ozet G, Ar C, Ozcan M et
al. The modelled effectiveness of ruxolitinib on survival in polycythemia patients with hydroxyurea resistance/intolerance in Turkey. Value in Health 2017; 20: 545. doi: 10.1016/j. jval.2017.08.832
19. Buyukasik Y, Haznedaroğlu İ, Ozet G, Ar C, Ozcan M et al. Epidemiological estimates and treatment practice pattern in polycythemia vera patients in Turkey: results based on an expert panel. Value in Health 2017; 20: 546. doi: 10.1016/j. jval.2017.08.839
20. Shimosaki S, Nakahata S, Ichikawa T, Kitanaka A, Kameda T et al. Development of a complete human IgG monoclonal antibody to transferrin receptor 1 targeted for adult T-cell leukemia/lymphoma. Biochemical and Biophysical Research Communications 2017; 485: 144-151. doi: 10.1016/j. bbrc.2017.02.039
21. Rizzo K, Stetler-Stevenson M, Wilson W, Yuan CM. Novel CD19 expression in a peripheral T cell lymphoma: a flow cytometry case report with morphologic correlation. Cytometry Part B Clinical Cytometry 2009; 76: 142-149. doi: 10.1002/cyto.b.20442
22. Barakzai MA, Pervez S. CD20 positivity in classical Hodgkin’s lymphoma: diagnostic challenge or targeting opportunity. Indian Journal of Pathology and Microbiology 2009; 52: 6-9. doi: 10.4103/0377-4923.44952
23. Hashimoto Y, Yokohama A, Saitoh A, Nakahashi H, Toyama K et al. Prognostic importance of the soluble form of IL-2 receptor (sIL-2R) and its relationship with surface expression of IL-2R (CD25) of lymphoma cells in diffuse large B-cell lymphoma treated with CHOP-like regimen with or without rituximab: a retrospective analysis of 338 cases. Journal of Clinical Experimental Hematopathology 2013; 53: 197-205. doi: 10.3960/jslrt.53.197
24. Fu XH, Wang S Sen, Huang Y, Xiao J, Zhai LZ et al. Prognostic significance of CD20 expression in Hodgkin and Reed-Sternberg cells of classical Hodgkin’s Lymphoma. Chinese Journal of Cancer 2008; 27: 1197-1203.
25. Hiraga J, Tomita A, Sugimoto T, Shimada K, Ito M et al. Down-regulation of CD20 expression in B-cell lymphoma cells after treatment with rituximab-containing combination chemotherapies: its prevalence and clinical significance. Blood 2009; 113: 4885-4893. doi: 10.1182/blood-2008-08-175208 26. Fujiwara SI, Muroi K, Tatara R, Matsuyama T, Ohmine K
et al. Clinical features of de novo CD25-positive follicular lymphoma. Leukemia Lymphoma 2014; 55: 307-313. doi: 10.3109/10428194.2013.806658
27. Thorns C, Kalies K, Fischer U, Höfig K, Krokowski M et al. Significant high expression of CD23 in follicular lymphoma of the inguinal region. Histopathology 2007; 50: 716-719. doi: 10.1111/j.1365-2559.2007.02678.x
28. Toji T, Takata K, Sato Y, Miyata-Takata T, Hayashi E et al. Serum level of soluble interleukin-2 receptor correlates with CD25 expression in patients with T lymphoblastic lymphoma. Journal of Clinical Pathology 2015; 68: 622-627. doi: 10.1136/ jclinpath-2015-202934
29. Carulli G, Cannizzo E, Zucca A, Buda G, Orciuolo E et al. CD45 expression in low-grade B-cell non-Hodgkin’s lymphomas. Leukemia Research 2008; 32: 263-267. doi: 10.1016/j.leukres.2007.06.002
30. Sun L, Zhao Y, Shi H, Ma C, Wei L. LMP-1 induces survivin expression to inhibit cell apoptosis through the NF-κB and PI3K/Akt signaling pathways in nasal NK/T-cell lymphoma. Oncology Reports 2015; 33: 2253-2260. doi: 10.3892/ or.2015.3847
31. Hartley C, Vaughan JW, Jarzembowski J, Kroft SH, Hosking P et al. CD30 expression in monomorphic posttransplant lymphoproliferative disorder, diffuse large b-cell lymphoma correlates with greater regulatory t-cell infiltration. Am J Clinical Pathology 2017; 148: 485-493. doi: 10.1093/ajcp/ aqx097
32. Feng Y, Rao H, Lei Y, Huang Y, Wang F et al. CD30 expression in extranodal natural killer/T-cell lymphoma, nasal type among 622 cases of mature T-cell and natural killer-cell lymphoma at a single institution in South China. Chinese Journal of Cancer 2017; 36: 1-9. doi: 10.1186/s40880-017-0212-9
33. Malysz J, Erdman P, Klapper J, Zhu J, Creer M et al. Clinical implications of CD30 expression in aggressive B-cell lymphomas. Clinical Lymphoma, Myeloma and Leukemia 2016; 16: 429-433. doi: 10.1016/j.clml.2016.04.011
34. Onaindia A, Martínez N, Montes-Moreno S, Almaraz C, Rodríguez-Pinilla SM et al. CD30 expression by B and T cells: a frequent finding in angioimmunoblastic T-cell lymphoma and peripheral T-cell lymphoma-not otherwise specified. American Journal of Surgical Pathology 2016; 40: 378-385. doi: 10.1097/PAS.0000000000000571
35. Yao X, Teruya-Feldstein J, Raffeld M, Sorbara L, Jaffe ES. Peripheral T-cell lymphoma with aberrant expression of CD79a and CD20: a diagnostic pitfall. Modern Pathology 2001; 14: 105-110. doi: 10.1038/modpathol.3880265
36. Wang L, Wang H, Li P, Lu Y, Xia Z et al. CD38 expression predicts poor prognosis and might be a potential therapy target in extranodal NK/T cell lymphoma, nasal type. Annals of Hematology 2015; 94: 1381-1388. doi: 10.1007/s00277-015-2359-2
37. Ma XB, Zheng Y, Yuan HP, Jiang J, Wang YP. CD43 expression in diffuse large B-cell lymphoma, not otherwise specified: CD43 is a marker of adverse prognosis. Human Pathology 2015; 46: 593-599. doi: 10.1016/j.humpath.2015.01.002