https://doi.org/10.1177/1470320319851310 Journal of the Renin-Angiotensin-Aldosterone System
April-June 2019: 1 –9 © The Author(s) 2019 Article reuse guidelines: sagepub.com/journals-permissions DOI: 10.1177/1470320319851310 journals.sagepub.com/home/jra
Creative Commons Non Commercial CC BY-NC: This article is distributed under the terms of the Creative Commons
Attribution-NonCommercial 4.0 License (http://www.creativecommons.org/licenses/by-nc/4.0/) which permits non-commercial use, reproduction and distribution of the work without further permission provided the original work is attributed as specified on the SAGE and Open Access pages (https://us.sagepub.com/en-us/nam/open-access-at-sage).
Introduction
Acute myeloid leukaemia (AML) is characterized by an increase in the number of neoplastic myeloid cells in the marrow, which are arrested in their development, habitually coming about in haematopoietic insufficiency, such as gran-ulocytopenia, thrombocytopenia or frailty, with or without leukocytosis.1 The bone marrow renin–angiotensin system (RAS) modulates AML. RAS is an autocrine/paracrine/ intracrine peptide system which is generally recognized as arterial blood pressure’s principal determinant.2 However, it was shown that RAS is not only related to blood pressure but also operates in the bone marrow (BM). Each of the RAS molecules, namely renin, angiotensin II (ANG II), angiotensin II type 1 receptor (AT1R), angiotensin II type 2
The impact of At1r inhibition via losartan
on the anti-leukaemic effects of
doxorubicin in acute myeloid leukaemia
Mehdi Ghasemi
1, Mufide Okay
2, Seyhan Turk
3,
Ronak Naeemaee
4, Ebru Guver
4, Umit Y Malkan
5, Salih Aksu
2,
Nilgun Sayinalp
2and Ibrahim C Haznedaroglu
2Abstract
Introduction: Bone marrow renin–angiotensin system(RAS) modulates acute myeloid leukaemia(AML).The aim of this
study is to clarify the relationships between RAS and AML, and to show the effect of losartan and doxorubicin treatment in AML cell lines.
Methods: AML cell lines including CESS, HL-60, MO-1, P31/FUJ, GDM-1 and KASUMI-3 were used as models in this
study.
Results: After treating the six AML cell lines with a combination of losartan and doxorubicin, they were divided into two
groups based on their behaviour: one became more sensitive to drug treatment (Group A) and the other had no change observed in behaviour after drug treatment (Group B). In silico analyses showed that Group A is involved in cellular apoptosis, while Group B is involved in tumour angiogenesis further supporting the in vitro results.
Conclusion: The combined treatment of the AML cell lines with losartan and doxorubicin resulted in an increase in
sensitivity of some of the cell lines. Those leukaemic cells are modulated via the induction of apoptosis, whereas the other cells resistant to the drug treatment are closely related to tumour angiogenesis indicating that RAS-AT1R seems to be differently expressed in different leukaemic blast cells and tumour microenvironments. Pharmaco-biological actions of RAS inhibitors may be different in distinct leukaemic cells based on the pathological behaviour of AML genomic subtypes.
Keywords
RAS, AML, AT1R, AT2R, ANG II, losartan, doxorubicin, drug combination
Date received: 12 August 2018; accepted: 20 April 2019
1 Faculty of Medicine, Department of Medical Microbiology, Lokman
Hekim University, Turkey
2 Faculty of Medicine, Department of Hematology, Hacettepe
University, Turkey
3 Faculty of Pharmacy, Department of Biochemistry, Hacettepe
University, Turkey
4 Department of Molecular Biology and Genetics, Bilkent University,
Turkey
5 Dışkapı Yıldırım Beyazıt Training and Research Hospital, Department
of Hematology, University of Health Sciences, Turkey
Corresponding author:
Umit Yavuz Malkan, Dışkapı Yıldırım Beyazıt Training and Research Hospital, Department of Hematology, University of Health Sciences, Hematoloji Kliniği, 06110, Altındağ, Ankara, Turkey.
Email: [email protected] Original Article
receptor (AT2R) and angiotensin converting enzyme (ACE), are located in the microenvironment of the BM. The major RAS effector mediator ANG II applies its haematopoietic effects by actuating angiotensin receptors, fundamentally AT1R and AT2R.3 ANG II mediates its many effects with AT1R by triggering proliferation, inflammation or angio-genesis. AT2R is mainly expressed in the fetal tissues, and its binding to ANG II increases apoptosis rate.4 The induc-tion of different pathways by AT1R and AT2R indicates the antagonistic functions of these two receptors with respect to one another.
Losartan, an AT1R antagonist, is a well-known drug in leukaemic cancer treatments. Losartan functions via the inhibition of cellular growth, decreasing c-myb expression and increasing the apoptosis rate.5 Doxorubicin is known as a drug with cytotoxic anti-proliferative actions. Doxorubicin can induce COX-2 protein production and mRNA expression and raise the inflammatory response. Moreover, doxorubicin reduces anticancer drugs’ cyto-toxic effects in selected tumour cells. For instance; in HL-60, an AML cell line and primary AML cells, doxoru-bicin critically induces cell apoptosis and inhibits cellular growth.6
Grand-scale sequencing endeavours have revealed a range of transformations in numerous haematologic malig-nancies, including AML, proposing that combinations of agents will be required to treat these diseases viably. Combinatorial approaches will moreover be basic for combating the rise of hereditarily heterogeneous sub-clones, protect signals within the microenvironment, and tumour-intrinsic feedback pathways that all contribute to disease relapse.7
This study focused on three main aims regarding the interrelationships between RAS and AML. The first aim was to study the impact of the combination of losartan and doxorubicin, which could result in AML cells that are more sensitive to the drug treatment, in addition to a higher success rate for the combined treatment in comparison to treatment with losartan alone. The second aim was to bet-ter understand the pathobiology of RAS in AML through the role of the RAS genes AT1R and AT2R, which are associated with resistance to conventional anti-leukaemic drugs. Lastly, this study aimed to promote future studies by associating cytokines and anticancer drugs with the resulting protocol and other RAS-related pathways.
Materials and methods
Cell culture
CESS (ATCC® TIB-190™), HL-60(ATCC® CCL-240™), NOMO-1, P31/FUJ, GDM-1(ATCC® CRL-2627™) and KASUMI-3 (ATCC® CRL-11147™) leukaemia cell lines were grown in RPMI-1640 medium containing 20% fetal bovine serum, 1% penicillium/streptomycin and 1% L-glutamine. Cell lines prepared in T25 flasks were
incubated for 72 hours in an incubator containing 5% CO2 at 37°C. The passaging of the cell lines was performed every 48–72 hours depending on the confluency of the cells.
Treating plates with losartan and doxorubicin
After the incubation, the components of each flask were transferred to 18 96-well plates (6.44 mm cell size, 0.32 cm2 growth area, flat surface and 200µL working volume) containing 7000 cells. The 96-well plates were prepared and then incubated overnight in an incubator containing 5% CO2 at 37°C for approximately 24 hours.
Subsequently, three different losartan/dimethyl sulfoxide (DMSO) mixtures (20µL, 10µL, 5µL) at different concen-trations were added to the wells with six different concentra-tions of doxorubicin (20µL, 10µL, 2 µL, 1µL, 0.2µL, 0.1µL, 0 (control)). Three wells were run for each concentration to increase accuracy. Following the addition of the drugs to the plates, each one was incubated for 72 hours.
Cell viability assay using CellTiter-Glo®
Luminescent
Plates were transferred to opaque Microplate Reader com-patible plates and after 30 minutes of incubation, the CellTiter-Glo® Luminescent Cell Viability Assay protocol was followed. Reading was done via the Biotech Microplate Reader. Protection of the plates against the light was ensured during the process. After completion of the readings, the IC50 values were determined and graphs were obtained using the R 3.1.1 program.
Statistical analyses
After the data was collected from the Biotech Microplate Reader, the percent viability was calculated with Microsoft Excel 2013. After the data values were transferred into txt files, their log (IC50) values were calculated via Six Model Analysis on R 3.1.1 for each concentration and three trials. One log (IC50) value, with the lowest standard error, for one concentration was selected from the graph provided by R 3.1.1. After the IC50 values were calculated using Microsoft Excel 2013, bar charts were generated via GraphPad Prism 7.0.
All the expression data for CESS, NOMO-1, HL-60, P31/FUJ, GDM-1 and KASUMI-3 were extracted from Cancer Genome Project (CGP) Published data, E-MTAB-783 WTSI CGP RMA.
A t-test was then performed for these genes, and they were separated according to the pathways they were involved in, including immune response, cancer stem cell markers, apoptosis and autophagy. These pathways were chosen to study the effects and involvement of those genes in the pathways that increase the sensitivity of the cells
after drug treatment. For each group, those genes with
p-values of less than or equal to 0.05 were selected,
show-ing that differential expression of these genes was statisti-cally significant.
Network analysis was performed via Cystoscope soft-ware with the gene list gathered from CGP published data. The network analysis included the Co-Expression Network, Gene Interaction Network and Pathway Network.
Upon completion of the Gene-Set Enrichment Analysis (GSEA) a table of all the pathways in each group was gen-erated by the software, which was accessed from “Detailed enrichment results in html format” by clicking on the index file. For this analysis these two generated tables were used. All the statistically significant pathways were chosen by filtering the lists based on their NOM P-values. In this analysis the cutoff point of the NOM P-values was 0.05 to ensure all the chosen pathways were statistically signifi-cant. After filtering, the remaining pathways in the lists all had NOM P-values of smaller than or equal to 0.05.
The next step was comparing the filtered list from Group A to the filtered list of Group B, which was achieved by putting Group A’s list and Group B’s list together, and they were both sorted from A to Z for ease of comparing the lists. Later each list was evaluated closely and the path-ways explaining the difference in behaviour of two groups in comparison to one another were put in a table consisting of Categories and Frequency. Frequency of each category was the number of times the found pathway was a pathway related to the category. At the end of the analysis when both lists were evaluated, graphs of each table were con-structed in GraphPad Prism 7.0.
Also, cluster sampling was performed with the gene list and their expression rates that were gathered from CGP pub-lished data. Data were standardized on Microsoft Excel 2013. By using Cluster 3.0 and Java Treeview, the gene expression data analysis and graphs were obtained.
Results
Cell viability assay results
For testing the drug response of AML cell lines to losartan, we treated six AML cell lines with different concentrations (20µM, 10µM, 5µM, 2µM, 1µM, 0.2µM, 0.1µM), and using cell viability assay we looked at their responses to losartan. An example of the cytotoxicity results is shown in Figure 1. After concluding that losartan has no toxic effect on AML cell lines, its effect on increasing the effi-ciency of other drugs was tested by combining it with doxorubicin. Doxorubicin was chosen in this study as it is often used in AML for its cell growth inhibiting effects and induction of apoptosis.
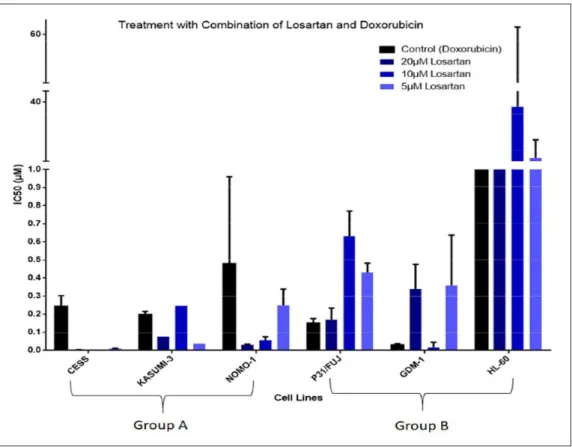
After all six cell lines were treated with three different losartan concentrations in combination with six different doxorubicin concentrations, the cells were incubated for 72 hours and cell viability assay was used to determine
their IC50 values to evaluate their response to the drugs. The results are depicted in Figure 2.
The results of in silico analyses
CGP. published microarray expression rates for AT1R
To ensure the difference in the response of the AML cell lines to losartan and doxorubicin was not the result of dif-ferent expression rates of AT1R, its expression rates were taken from the CGP published database and plotted on a graph (Figure 3).
KASUMI-3 data were not found in the CGP database, thus the in silico analysis was done with the remaining five cell lines.
Differentially. expressed genes results
We used the five AML cell lines’ CGP data for both Group A and Group B. A t-test was then performed to select the sta-tistically significant genes (P-values ⩽ 0.05). Subsequently, the genes of immune response, apoptosis and autophagy and their probesets, which were taken from the literature, were listed to examine whether the significantly differentially expressed genes were found to be significant in the above-mentioned pathways. Through VLOOKUP the matching genes were selected and are listed in Table 1. Four of the found genes were involved in apoptotic pathways and showed greater significance compared to other pathways; therefore, the in silico analysis was mostly focused on apoptosis.
Cluster results. The 868 differentially expressed genes
and 5 AML cell lines were clustered together to look at their correlation with one another and to look at the cor-relation of the 7 differentially expressed genes which were clustered with the AML cell lines. Figure 4 shows the results of the clusters.
Gene-set enrichment analysis (GSEA) results. GSEA was
performed for the two defined groups (Group A and Group B) of the five AML cell lines. The genes used in this
analy-Figure 1. Cell viability assay results for HL-60 showing that
losartan at the highest concentration does not induce cell death.
sis were the 868 significantly differentially expressed gene list. The results provided the genes which were signifi-cantly different between Group A and Group B with lists of their associating pathways.
After GSEA analysis was completed, the lists of signifi-cant pathways were filtered to have NOM p-values of less than or equal to 0.05, and the pathways which seemed to be causing the different behaviour of the two groups in
Figure 2. Cell viability assay results for six AML cell lines. The bars represent the IC50 values upon treatment with control
(doxorubicin only) and all three different losartan concentrations. As can be seen on the graph, the first three cell lines belong to Group A and they show an increase in their sensitivity for losartan concentrations and the last three cell lines belong to Group B and show no change after treatment with three different losartan concentrations. For CESS at 10µM losartan concentration no IC50 was generated by R software.
Figure 3. AT1R expression rates. The graphs show the expression rates of AT1R of the five chosen AML cell lines from CGP
published microarray database. The bars show that there is no significant difference in the expression rates of this receptor before any drug treatment.
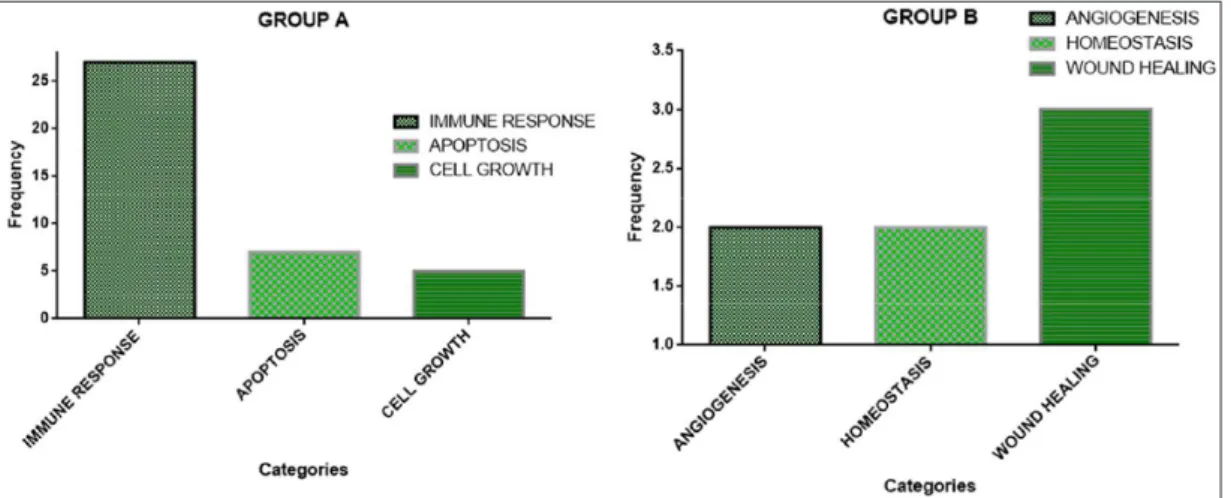
comparison to each other were listed in Table 2. Later all the pathways were divided into different categories. To measure how statistically important each category was, the frequency of Group A and Group B’s categories were plot-ted on the two graphs depicplot-ted in Figure 5. As Figure 6 shows, apoptosis and angiogenesis seemed to show a sig-nificant difference in the pathways of the two groups, and some of their GSEA-generated graphs are depicted.
Network analysis results. The correlation of the 868
sig-nificantly differentially expressed genes was evaluated by creating three different networks (co-expression, gene
interaction and pathways networks) by using GeneMA-NIA. All of these networks can be found in Figure 7.
Discussion
Losartan is an AT1R blocker and it is thought to induce apoptosis in AML cell lines. In this study, losartan alone did not induce cell death even at the highest concentra-tion. Therefore, the drug treatment was a combination of losartan and doxorubicin. However, the results of our present study showed that not all the AML cell lines treated with a combination of losartan and doxorubicin became more sensitive, and thus they were divided into two groups based on their behaviours after treatment. One group (Group A) did become more sensitive. On the contrary, the other leukaemic group did not show any dif-ference in its behaviour (Group B). As the pathways were analysed, their involvement in apoptotic pathways was observed. It is known that AT1R is involved in cell sur-vival and losartan is an angiotensin receptor blocker (ARB) which also stimulates pro-apoptotic signalling pathways. By being an ARB blocker, losartan blocks the activity of AT1R, and AT1R loses its functionality in cell survival pathways and eventually leads to death of the cells or apoptosis.8,9 Moreover, some other studies have also shown that inhibiting AT1R disrupts the AT1R/AT2R equilibrium, which can stimulate AT2R expression, and stimulation of AT2R can lead to apoptosis in different cell types.10–12
On the other hand, the Group B pathway analysis results showed that these cell lines are involved in angiogenesis. From the literature search it was concluded that blockade of the RAS system does not always induce apoptosis; in some cases it activates angiogenesis. As the amount of ANG II is lowered in the body by ACE inhibitors or by inhibition of ARBs, angiogenesis is stimulated, which can be seen from the higher extracellular proliferation rates.13,14 Another study done on a hind limb ischaemic model showed that inhibition of ACE can induce angiogenesis similar to that of VEGF.15
Local RAS could affect leukaemic cell production within the BM neoplastic microenvironment. Koca et al. previously observed significant expressions of ACE, renin,
Table 1. Seven genes differentially expressed in the pathways regarding immune response, apoptosis and autophagy; 868 genes
were found to be significantly differentially expressed and among them, seven genes were found in the pathways. As can be seen from the table, the largest number of genes found belong to apoptotic pathways.
Immune response Apoptosis Autophagy
LAG3 (P-Value:0.0168859438962527) BCL2L2 (P-Value:0.0358013451611461) TGM2 (P-Value:0.00958713342814844) CASP2 (P-Value:0.0381230629093813) CCR8 (P-Value:0.00645072190566893) TNFSF10 (P-Value:0.0276396070564984)/ Probeset: 202687_s_at TNFSF10 (P-Value:0.0344977098747363)/ Probeset: 202688_at
Figure 4. Clusters of differentially expressed genes with the
five AML cell lines. (a) Results of 868 significantly differentially expressed genes show that each of the groups’ cell lines are clustered together. Additionally, the figures show that the genes which are up-regulated in one group are down-regulated in the other group, and vice versa. (b) The cluster of the four apoptosis genes from Table 1.
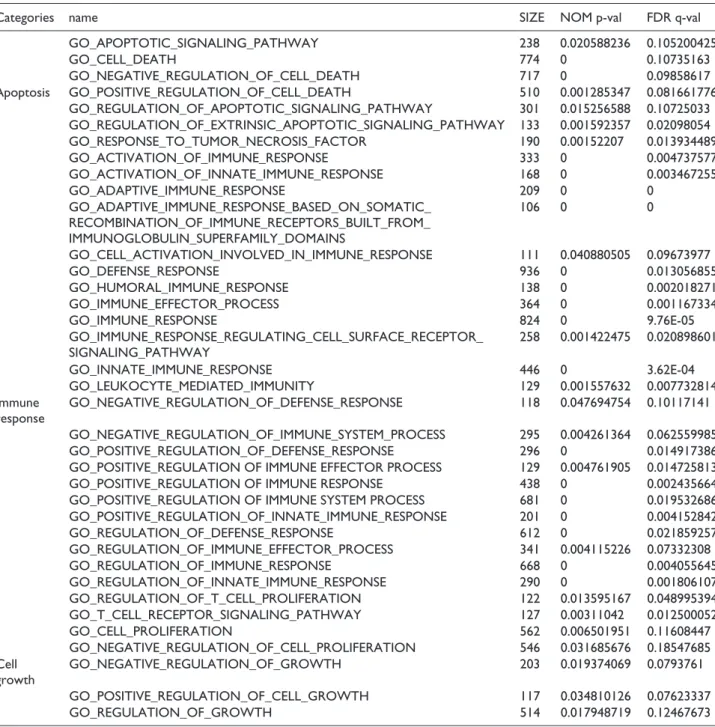
Table 2. List of significant pathways in Group A (the group showing increase in sensitivity after drug treatment) vs. Group B
(the group showing no effect on its behaviour after drug treatment). Cell lines of Group A pathways become more sensitive after drug (losartan + doxorubicin) treatment. These pathways are related to apoptosis, immune response and cell growth. There is no change in behaviour of the cell lines of Group B pathways on drug treatment. The cutoff point was NOM p-values ⩽ 0.05. Group A pathways.
Categories name SIZE NOM p-val FDR q-val
GO_APOPTOTIC_SIGNALING_PATHWAY 238 0.020588236 0.105200425 GO_CELL_DEATH 774 0 0.10735163 GO_NEGATIVE_REGULATION_OF_CELL_DEATH 717 0 0.09858617 Apoptosis GO_POSITIVE_REGULATION_OF_CELL_DEATH 510 0.001285347 0.081661776 GO_REGULATION_OF_APOPTOTIC_SIGNALING_PATHWAY 301 0.015256588 0.10725033 GO_REGULATION_OF_EXTRINSIC_APOPTOTIC_SIGNALING_PATHWAY 133 0.001592357 0.02098054 GO_RESPONSE_TO_TUMOR_NECROSIS_FACTOR 190 0.00152207 0.013934489 GO_ACTIVATION_OF_IMMUNE_RESPONSE 333 0 0.004737577 GO_ACTIVATION_OF_INNATE_IMMUNE_RESPONSE 168 0 0.003467255 GO_ADAPTIVE_IMMUNE_RESPONSE 209 0 0 GO_ADAPTIVE_IMMUNE_RESPONSE_BASED_ON_SOMATIC_ RECOMBINATION_OF_IMMUNE_RECEPTORS_BUILT_FROM_ IMMUNOGLOBULIN_SUPERFAMILY_DOMAINS 106 0 0 GO_CELL_ACTIVATION_INVOLVED_IN_IMMUNE_RESPONSE 111 0.040880505 0.09673977 GO_DEFENSE_RESPONSE 936 0 0.013056855 GO_HUMORAL_IMMUNE_RESPONSE 138 0 0.002018271 GO_IMMUNE_EFFECTOR_PROCESS 364 0 0.001167334 GO_IMMUNE_RESPONSE 824 0 9.76E-05 GO_IMMUNE_RESPONSE_REGULATING_CELL_SURFACE_RECEPTOR_ SIGNALING_PATHWAY 258 0.001422475 0.020898601 GO_INNATE_IMMUNE_RESPONSE 446 0 3.62E-04 GO_LEUKOCYTE_MEDIATED_IMMUNITY 129 0.001557632 0.007732814 Immune response GO_NEGATIVE_REGULATION_OF_DEFENSE_RESPONSE 118 0.047694754 0.10117141 GO_NEGATIVE_REGULATION_OF_IMMUNE_SYSTEM_PROCESS 295 0.004261364 0.062559985 GO_POSITIVE_REGULATION_OF_DEFENSE_RESPONSE 296 0 0.014917386 GO_POSITIVE_REGULATION OF IMMUNE EFFECTOR PROCESS 129 0.004761905 0.014725813 GO_POSITIVE_REGULATION OF IMMUNE RESPONSE 438 0 0.002435664 GO_POSITIVE_REGULATION OF IMMUNE SYSTEM PROCESS 681 0 0.019532686 GO_POSITIVE_REGULATION_OF_INNATE_IMMUNE_RESPONSE 201 0 0.004152842 GO_REGULATION_OF_DEFENSE_RESPONSE 612 0 0.021859257 GO_REGULATION_OF_IMMUNE_EFFECTOR_PROCESS 341 0.004115226 0.07332308 GO_REGULATION_OF_IMMUNE_RESPONSE 668 0 0.004055645 GO_REGULATION_OF_INNATE_IMMUNE_RESPONSE 290 0 0.001806107 GO_REGULATION_OF_T_CELL_PROLIFERATION 122 0.013595167 0.048995394 GO_T_CELL_RECEPTOR_SIGNALING_PATHWAY 127 0.00311042 0.012500052 GO_CELL_PROLIFERATION 562 0.006501951 0.11608447 GO_NEGATIVE_REGULATION_OF_CELL_PROLIFERATION 546 0.031685676 0.18547685 Cell growth GO_NEGATIVE_REGULATION_OF_GROWTH 203 0.019374069 0.0793761 GO_POSITIVE_REGULATION_OF_CELL_GROWTH 117 0.034810126 0.07623337 GO_REGULATION_OF_GROWTH 514 0.017948719 0.12467673 Group B pathways.
Categories name Size NOM p-val FDR q-val
Angiogenesis GO_ANGIOGENESIS 252 0.003225806 0.26024547
GO_BLOOD_VESSEL_MORPHOGENESIS 315 0 0.24298245
Homeostasis GO_HEMOSTASIS 271 0.027210884 0.4312605
GO_REGULATION_OF_BODY FLUID LEVELS 430 0.025925925 0.5188748 GO_REGULATION_OF_WOUND_HEALING 111 0.03064067 0.3787554 Wound healing GO_RESPONSE_TO_WOUNDING 479 0.008849558 0.41206074
and angiotensinogen in K562 leukaemic blast cells.16 K562 blasts are multipotential, haematopoietic malignant cells that spontaneously differentiate into recognizable progenitors of the erythrocyte, granulocyte and monocytic series. In the present study, the addition of losartan to dox-orubicin makes some of AML cell lines more sensitive. Those leukaemic cells are modulated via the induction of apoptosis, whereas some other leukaemic blast cells that are resistant to the losartan plus doxorubicin combination are closely related to tumour angiogenesis. Based on our observation, HL-60 (APL cells), GDM-1 (AMML
cells)17,18 and P31-FUJ (AM5L cells)19 AML cells lines are related to tumour angiogenesis, and addition of losartan to doxorubicin may not improve the anti-leukaemic efficacy of the drug. However, KASUMI-3 (t(8;21) positive leu-kaemia),20,21 NOMO-1 (adriamycin-resistant AML)22–24 and CESS (myelomonocytic leukaemia)25 represented the group of leukaemic cellular proliferation, and addition of losartan to doxorubicin resulted in the enhanced efficacy of cytotoxic drug associated anti-leukaemic approach. The RAS-AT1r receptor system seems to be differently expressed in leukaemic blast cells and the tumour
Figure 5. The frequencies of each significant category in Group A and B. The graphs show the frequency and the statistical
importance of the categories defined in Table 2.
Figure 6. Part (a) belongs to Group A and shows the apoptotic signalling pathway graph, while part (b) belongs to Group B and
microenvironment. Pharmacobiological actions of RAS inhibitors may be different in distinct leukaemic cells based on the pathological behaviour of AML genomic subtypes.
Local tissue RAS affects cancer development and metastases in an autocrine and paracrine way by the modu-lation of many neoplastic events, such as angiogenesis, apoptosis, cellular increase, immune answers, cell signal-ling and extracellular matrix development. In the literature, the future of RAS blockers in cancer treatment has been described in two ways. As a first approach, protocols using these drugs as chemo-prophylactic agents could be consid-ered to reduce cancer rates. The limited efficacy of long-term use due to the compensatory rise in the renin of ACE inhibitors and ARBs can be a limitation, but strategies such as a combination of RAS blockers with a renin inhibitor are anticipated. Despite the multiple limitations, chemopreven-tion is thought to be a realistic method for decreasing the rate of cancer, and RAS blockers constitute an attractive potential approach. Another approach could be the use of RAS blockers as co-adjuvant agents in cancer therapy.26
Conclusion
The results of our present study add an additional voice to those proposing that leukaemic stem cell, leukaemic niche, cellular proliferation, apoptosis and cancer genomics could all play a part in the decision making process of RAS therapeutics in acute leukaemia.
Declaration of conflicting interest
The authors declare that there is no conflict of interest.
Funding
This research received no specific grant from any funding agency in the public, commercial or not-for-profit sectors.
ORCID iDs
Mehdi Ghasemi https://orcid.org/0000-0003-1514-7294 Umit Y Malkan https://orcid.org/0000-0001-5444-4895
References
1. Lowenberg B, Downing JR and Burnett A. Acute myeloid leukemia. New Engl J Med 1999; 341(14): 1051–1062. 2. George AJ, Thomas WG and Hannan RD. The
renin–angi-otensin system and cancer: old dog, new tricks. Nat Rev
Cancer 2010; 10: 745.
3. Haznedaroglu IC and Beyazit Y. Local bone marrow renin-angiotensin system in primitive, definitive and neoplastic haematopoiesis. Clin Sci (Lond) 2013; 124(5): 307–323. 4. Williams PJ, Mistry HD, Innes BA, et al. Expression of
AT1R, AT2R and AT4R and their roles in extravillous trophoblast invasion in the human. Placenta 2010; 31(5): 448–455.
5. De la Iglesia Inigo S, Lopez-Jorge CE, Gomez-Casares MT, et al. Induction of apoptosis in leukemic cell lines treated with captopril, trandolapril and losartan: a new role in the treatment of leukaemia for these agents. Leuk Res 2009; 33(6): 810–816.
6. Butturini A, Santucci MA, Gale RP, et al. GM-CSF incu-bation prior to treatment with cytarabine or doxorubicin enhances drug activity against AML cells in vitro: a model for leukemia chemotherapy. Leuk Res 1990; 14(9): 743–749.
7. Kurtz SE, Eide CA, Kaempf A, et al. Molecularly targeted drug combinations demonstrate selective effectiveness for myeloid- and lymphoid-derived hematologic malignancies.
Proc Nat Acad Sci USA 2017; 114(36): E7554–E7563.
8. Juillerat-Jeanneret L, Celerier J, Chapuis Bernasconi C, et al. Renin and angiotensinogen expression and func-tions in growth and apoptosis of human glioblastoma. Br J
Cancer 2004; 90(5): 1059–1068.
9. Gong Q, Davis M, Chipitsyna G, et al. Blocking angiotensin II Type 1 receptor triggers apoptotic cell death in human pancreatic cancer cells. Pancreas 2010; 39(5): 581–594. 10. Wegman-Ostrosky T, Soto-Reyes E, Vidal-Millan S, et al.
The renin-angiotensin system meets the hallmarks of can-cer. J Renin Angiotensin Aldosterone Syst 2015; 16(2): 227–233.
11. Achard J-M, Fournier A, Mazouz H, et al. Protection against ischemia: a physiological function of the renin-angiotensin system. Biochem Pharmacol 2001; 62(3): 261–271.
12. Hamet P. The renin-angiotensin system: where do we stand, and what is the future? Am J Hypertens 2005; 18(S5): 125S–126S.
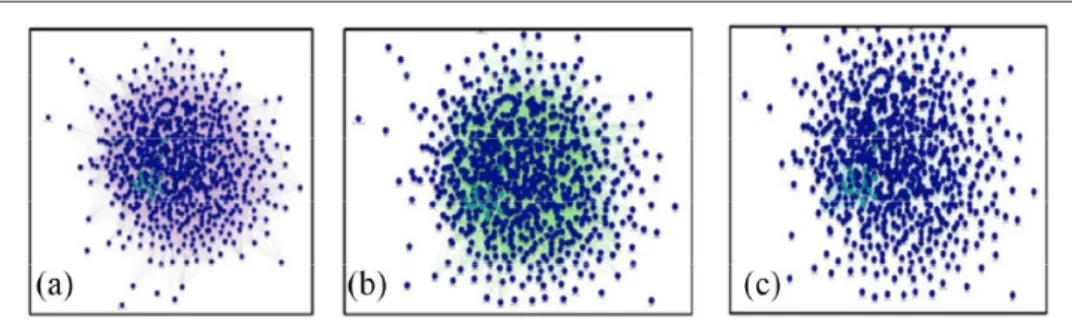
Figure 7. GeneMANIA-generated networks showing the interactions of all 868 significantly differentially expressed genes. (a)
Co-Expression Network. (b) Gene Interaction Network. (c) Pathway Network. All of these networks indicate that these genes are highly correlated.
13. Walther T, Menrad A, Orzechowski HD, et al. Differential regulation of in vivo angiogenesis by angiotensin II recep-tors. FASEB J 2003; 17(14): 2061–2067.
14. Buharalioglu CK, Song CY, Yaghini FA, et al. Angiotensin II-induced process of angiogenesis is mediated by spleen tyrosine kinase via VEGF receptor-1 phosphorylation. Am J
Physiol Heart Circ Physiol 2011; 301(3): H1043–1055.
15. Ichiki T. Role of renin angiotensin system in angiogen-esis: it is still elusive. Arterioscler Thromb Vasc Biol 2004; 24(4): 622–624.
16. Koca E, Haznedaroglu IC, Acar K, et al. Renin-angiotensin system expression in the K562 human erythroleukaemic cell line. J Renin Angiotensin Aldosterone Syst 2007; 8(3): 145–147.
17. Ben-Bassat H, Korkesh A, Voss R, et al. Establishment and characterization of a new permanent cell line (GDM-1) from a patient with myelomonoblastic leukemia. Leuk Res 1982; 6(6): 743–752.
18. Nagel S, Kaufmann M, Scherr M, et al. Activation of HLXB9 by juxtaposition with MYB via formation of t(6;7)(q23;q36) in an AML-M4 cell line (GDM-1). Genes
Chromosomes Cancer 2005; 42(2): 170–178.
19. Hirose M, Minato K, Tobinai K, et al. A novel monocytoid cultured cell line, P31/Fujioka, derived from acute mono-blastic leukemia. Gan 1982; 73(5): 735–741.
20. Suzukawa K, Kodera T, Shimizu S, et al. Activation of EVI1 transcripts with chromosomal translocation joining
the TCRVβ locus and the EVI1 gene in human acute undif-ferentiated leukemia cell line (Kasumi-3) with a complex translocation of der(3)t(3;7;8). Leukemia 1999; 13: 1359. 21. Asou H, Suzukawa K, Kita K, et al. Establishment of an
undifferentiated leukemia cell line (Kasumi-3) with t(3;7) (q27;q22) and activation of the EVI1 gene. Jap J Cancer
Res 1996; 87(3): 269–274.
22. Hamaguchi M, Morishita Y, Takahashi I, et al. FDP D-dimer induces the secretion of interleukin-1, urokinase-type plas-minogen activator, and plasplas-minogen activator inhibitor-2 in a human promonocytic leukemia cell line. Blood 1991; 77(1) :94–100.
23. Morishita Y, Kataoka T, Towatari M, et al. Up-regulation of transferrin receptor gene expression by granulocyte colony-stimulating factor in human myeloid leukemia cells. Cancer
Res 1990; 50(24): 7955–7961.
24. Towatari M, Ito Y, Morishita Y, et al. Enhanced expression of DNA topoisomerase II by recombinant human granu-locyte colony-stimulating factor in human leukemia cells.
Cancer Res 1990; 50(22): 7198–7202.
25. Bradley TR, Pilkington G, Garson M, et al. Cell lines derived from a human myelomonocytic leukaemia. Br J
Haematol 1982; 51(4): 595–604.
26. Haznedaroglu IC and Malkan UY. Local bone marrow renin-angiotensin system in the genesis of leukemia and other malignancies. Eur Rev Med Pharmacol Sci 2016; 20(19): 4089–4111.