ADYÜEBD Adıyaman Üniversitesi Eğitim Bilimleri Dergisi ISSN:2149-2727
DOI:http://dx.doi.org/10.17984/adyuebd.357433
Öğretmen ve Okul Psikolojik Danışmanı Destek Ölçekleri’nin
Faktöriyel
Yapısı: Latin Öğrenciler Örneği
Mehmet Akif Karaman1*, Javier Cavazos Vela2, Ming-Tsan Pierre Lu2 1 Kilis 7 Aralık Üniversitesi, Muallim Rıfat Eğitim Fakültesi, Kilis/Türkiye
2 University of Tezas Rio Grande Valley, College of Education and P-16 Integration, Edinburg/TX MAKALE BİLGİ Ö Z ET Makale Tarihçesi: Alındı: 24.11.2017 Düzeltilmiş hali alındı 02.04.2018 Kabul edildi 04.06.2018 Çevrimiçi yayınlandı 30.06.2018
Bu çalışmada, öğretmenlerin ve okullardaki psikolojik danışmanların öğrencilere verdikleri desteğin boyutunu Latin öğrenciler ile ölçen güncellenmiş Öğretmen Destek Ölçeğinin (ÖDÖ-G) ve Okul Psikolojik Danışmanı Destek Ölçeğinin (OPDÖ) psikometrik özellikleri incelenmiştir. Çalışma, ölçeklerin geçerlik ve güvenirliklerinin farklı gruplardan bireylerle incelenmesi, elde edilen verilerin öğretmenlerin ya da psikolojik danışmanların destek boyutunun tutarlı bir şekilde ölçülmesi açısından önem arz etmektedir. Ölçeklerin güvenirliğine dayalı çalışmalar araştırmacılar tarafından incelenmişken alanyazında Latin öğrenciler grubuyla ya da bireylerle yapılmış geçerlik çalışmasına rastlanmamıştır. ÖDÖ-G’nin ve OPDÖ’nün yapı geçerliliği doğrulayıcı ve açıklayıcı faktör analizi (DFA ve AFA) yöntemleri kullanılarak ölçülmüştür. ÖDÖ-G’nin iki farklı modeli oluşturulmuş ve analiz edilmiştir. Doğrulayıcı faktör analizi sonuçları, ÖDÖ-G’nin beş faktörlü ve 22 maddeli modelinin kabul edilebilir düzeyde olduğunu göstermiştir. OPDÖ’nin faktör yapısını belirlemek amacıyla paralel analiz ve açıklayıcı faktör analizi uygulanmıştır. Bulgular OPDÖ’nün üç’lü bir faktör yapısına sahip oluğunu ve toplam varyansın %68’ini açıkladığını göstermiştir. Latin öğrencilere yönelik araştırma ve uygulama önerileri sonuçlar bölümünde tartışılmıştır.
© 2018 AUJES. Tüm hakları saklıdır Anahtar kelimeler: Öğretmen Destek Ölçeği- Revize Edilmiş, Okul Psikolojik Danışmanı Destek Ölçeği, Latin Öğrenciler, Ölçek Geliştirme
Geniş Özet Amaç
Bu çalışmanın amacı, öğretmenlerin ve okullardaki psikolojik danışmanların öğrencilere verdikleri desteğin boyutunu Latin öğrenciler ile ölçen ve güncellenen Öğretmen Destek Ölçeği (ÖDÖ-G; McWhirter, 1996) ve Okul Psikolojik Danışmanı Destek Ölçeğinin (OPDÖ) psikometrik özelliklerini incelemektir. Bu doğrultuda aşağıdaki araştırma soruları oluşturulmuştur:
1. ÖDÖ-G’den elde edilen puanlar Latin katılımcılar için geçerli ve güvenilir midir?
*Sorumlu yazarın adresi: Kilis 7 Aralık Üniversitesi, Muallim Rıfat Eğitim Fakültesi, Kilis, Türkiye e-posta: [email protected]
2. OPDÖ’den elde edilen puanlar Latin katılımcılar ile geçerli ve güvenilir bir faktör yapısına sahip midir?
Yöntem
Bu çalışmada nitel araştırma deseni tercih edilmiştir. Etik kurulundan onay alındıktan sonra veriler Güneydoğu Amerika bölgesinde Latin öğrencilerin ağırlıklı olduğu bir üniversiteden ve bir liseden toplanmıştır.
Çalışma Grubu
Araştırmanın örneklemini Güneydoğu Amerika bölgesinde Latin öğrencilerin ağırlıklı olduğu bir üniversitede okuyan 183 birinci sınıf öğrencisi ve lisede okuyan 124 son sınıf öğrencisi oluşturmaktadır. Katılımcıların yaşı 14 ile 29 arasında (M= 16.9, SD= 2.35) değişmektedir. Katılımcıların %44’ü (n= 134) kadınlardan, %56’sı (n=173) ise erkeklerden oluşmaktadır.
Verilerin Toplanması
Çalışmada veri aracı olarak ÖDÖ-G (McWhirter, 1996) ve yazardan izin alınarak ÖDÖ-G’nin maddelerinden oluşturulan OPDÖ kullanılmıştır. ÖDÖ-G (McWhirter, 1996) beş faktörden ve 25 maddeden oluşan bir ölçektir. Ölçek, (a) olumlu yaklaşımlar, (b) beklentiler, (c) ilgi, (d) değerlendirme ve (e) ulaşılabilirlik alanlarında öğretmen desteğini ölçmektedir.
Olumlu yaklaşımlar alt ölçeği öğretmenin öğrenciyi önemsemesini, ilgi göstermesini ve
duygusal bağ kurmasını ifade eden altı maddeden oluşmaktadır. Beklentiler alt ölçeği öğretmenin öğrencinin akademik başarısı ile ilgili beklentilerini içeren beş maddeden oluşmaktadır. İlgi alt ölçeği ise öğrencinin kendisine gelecekte yardımcı olabilecek davranışları algılaması ile ilgili 7 maddeden oluşmaktadır. Diğer bir alt ölçek olan
değerlendirme alt ölçeği, öğretmenin öğrencinin çalışmalarını ve ödevlerini nasıl
değerlendirdiğini ifade eden dört madde içermektedir. Son alt ölçek olan ulaşılabilirlik ise 3 madde içermektedir ve öğrencilerin öğretmenlerine ne düzeyde ulaşabildikleri ile ilgili hislerini ifade etmektedir. Farklı gruplarla yapılan çalışmalarda ölçeğin güvenirliği .85 ile .96 arasında değişmiştir (McWhirter, 1996; McWhirter, Rasheed, & Crothers, 2000; Metheny, McWhirter, & O’Neil., 2008). Buna paralel olarak OPDÖ’yü oluşturan maddelerde “Öğretmenim destekler/destek olur” cümlesi yerine “Okul psikolojik danışmanım destek olur/destekler” cümlesi getirilmiştir.
Verilerin Analizi
Verilerin toplanmasından önce istatistiksel güç analizi yapılmış her bir parametre için an az 10 katılımcı olması gerektiği dikkate alınmıştır (Stevens, 2009). Çalışmaya 307
katılımcının dahil edildiği göz önüne alındığında, katılımcı sayısının analiz yapma ve farklı modeller oluşturma bakımından yeterli olduğu görülmüştür.
Herhangi bir istatistiksel analiz yapmadan önce cevapsız formlar veya yüksek oranda cevapsız maddelerin olduğu formlar analizden çıkarılmıştır. Kolmogorov-Smirnov normallik testi uygulanmış ve verilerin normal olmadığı saptanmıştır (p< .05). Bu amaçla Mahalanobis uzaklık analizi yapılmış ve çok değişkenli aykırı değerler tespit edilmiştir. Analiz sonucunda 12 katılımcının verisi analizden çıkarılmıştır.
Verilerin analizinde Doğrulayıcı Faktör Analizi (DFA), Paralel Analiz ve Açıklayıcı Faktör Analizi (AFA) kullanılmıştır. Robust Maksimum Likelihood yöntemi kullanılarak modelin uyum iyiliğinin göstergeleri olarak RMSEA, CFI, GFI, TLI ve SRMR değerleri hesaplanmış ve modelin veriye yeterli/kabul edilebilir düzeyde uyum sergilediğinin kabul edilebilmesi için x2 (p> .05), GFI > .90, CFI > .90, TLI > .90, SRMR< .06 ve RMSEA < .08 olması koşulları dikkate alınmıştır.
Bulgular Güncellenmiş Öğretmen Destek Ölçeği
İlk olarak ÖDÖ-G’nin beş faktörlü orijinal modeli DFA kullanılarak analiz edilmiştir. Analiz sonuçlarından elde edilen uyum iyiliğinin göstergeleri, x2(265)= 810.15, p < .001; GFI= .83, CFI= .86, TLI= .85, RMSEA= .08 ve SRMR= .06, orijinal modelin yeterli/kabul edilebilir düzeyde olmadığını göstermiştir. Daha sonra, kabul edilebilir bir modele ulaşmak için Modifikasyon İndeksleri incelenmiş ve madde 23’ün diğer maddeler ve faktörlerle yüksek oranda hata kovaryansına sahip olduğu saptanmıştır. Bu nedenle madde, analizden çıkarılmış ikinci bir DFA yapılmıştır. Elde edilen sonuç ikinci modelinde kabul edilebilir düzeyde olmadığını göstermiştir. İkinci modelin oluşturulmasındaki benzer işlem tekrar uygulanmış ve madde 20’nin çıkarıldığı üçüncü bir model oluşturulmuştur. Uyum iyiliği göstergeleri üçüncü modelinde kabul edilebilir düzeyde olmadığını göstermiştir. Modifikasyon Indeksleri incelenmiş ve yükse oranda hata kovaryansına sahip olan madde 16 modelden çıkarılmış ve dördüncü bir model oluşturulmuştur. Sonuçlar bu modelinde yeterli düzeyde olmadığını göstermiştir.
Yazarla iletişime geçilerek alternatif model oluşturma konusunda fikir alınmıştır. Yazarın görüşleri dikkate alınarak tek faktörlü bir model üzerinden DFA yapılmış ancak sonuçlar, x2(275) = 960.73, p < .001; GFI= .78, CFI= .83, TLI= .82, RMSEA= .09, and SRMR= .06., tek faktörlü modelin de yeterli düzeyde olmadığını göstermiştir. Modifikasyon İndeksleri dikkate alınarak olunuşturulan diğer modeller de benzer sonuçlar vermiş ve ÖDÖ-G’nin faktör yapısının Latin grubuna uygun olmadığı sonucuna varılmıştır.
Okul Psikolojik Danışmanı Destek Ölçeği
Okul Psikolojik Danışmanı Destek Ölçeği’nin faktör yapısını belirlemek amacıyla PA ve AFA yöntemlerine başvurulmuştur. Paralel Analiz ve AFA sonuçları OPDÖ’nün üçlü faktör yapısına sahip olduğunu ve bu üç faktörün toplam varyansın %68’ini açıkladığını göstermiştir. Bu üç faktör; (a) beklentiler, (b) ilgi ve (c) algılanan destek olarak isimlendirilmiştir. Cronbach’s alpha güvenirlik analizi ölçek toplam puanının yüksek güvenirliğe (.96) sahip olduğunu göstermiştir. Tablo 3’te güvenirlik analizi, betimsel istatistik ve faktörler arası korelasyon sonuçları listelenmiştir.
Sonuç ve Öneriler
Bu çalışmanın amacı kapsamında öğretmenlerin ve okul psikolojik danışmanların öğrencilere verdikleri desteğin boyutunu Latin öğrenciler arasında ölçen ÖDÖ-G ve OPDÖ’nün psikometrik özellikleri incelenmiştir. Doğrulayıcı faktör analizi sonuçları ÖDÖ-G’nin Latin katılımcılara uygun bir ölçek olmadığını ortaya koymuştur. Bunun nedenlerinden biri de, ölçeğin geliştirilmesi aşamasındaki norm grubu ile Latin grubu arasındaki kültürel farklılıklar olarak gösterilebilir. Bu çalışma, ÖDÖ-G’nin Latin grubu için tekrardan uyarlanması gerektiğini göstermiştir.
Çalışmada kullanılan ve norm grup olarak bu çalışmanın katılımcılarının kullanıldığı diğer bir ölçek OPDÖ’nün ise iyi düzeyde prikometrik özelliklerinin olduğu görülmüştür. Okul Psikolojik Danışmanı Destek Ölçeği ÖDÖ-G’den uyarlanmış bir ölçektir; ancak PA ve AFA sonuçları ÖDÖ-G’den farklı bir faktör yapısına sahip olduğunu göstermiştir. Okul Psikolojik Danışmanı Destek Ölçeği üç alt ölçekten oluşmuş olup Algılanan Destek faktörü ÖDÖ-G’den farklı olarak yeni bir faktör olarak ortaya çıkmıştır. Analiz sonuçları, üniversite öğrencileri ve son sınıf lise öğrencilerinin algıladıkları destek düzeylerinin anlamlı düzeyde birbirinden farklı olduğunu ortaya koymuştur.
Bu çalışmanın bulguları, Amerika Birleşik Devletlerinde norm grubu olarak çoğunluğunu Beyazların oluşturduğu katılımcılarla geliştirilen ölçeklerin farklı etnik (ör. Latin, Siyahi) gruplarda veya kültürlerde farklı sonuçlar verebileceğini göstermiştir. Bunun yanı sıra, alanyazında yapılan çalışmalar öğrencilerin öğretmenlerinden veya okul psikolojik danışmanlarından aldıkları destek düzeyinin öğrencinin akademik başarısını, sosyal/duygusal iyi oluşunu ve mesleki gelişimini anlamlı düzeyde etkilediğini göstermiştir. Bu çalışma, Amerika’da en kalabalık etnik grubu oluşturan Latinlerle kullanılabilecek ve diğer kültürlere ve dillere uyarlanabilecek OPDÖ’nün alanyazına kazandırılmasını sağlamıştır.
AUJES Adıyaman University Journal of Educational Sciences
ISSN:2149-2727
DOI: http://dx.doi.org/10.17984/adyuebd.357433
Factorial Validity of Teacher and School Counselor Support Scales
in Latina/o Students
Mehmet Akif Karaman1*, Javier Cavazos Vela2, Ming-Tsan Pierre Lu2 1 Kilis 7 Aralık Üniversity, Muallim Rıfat Faculty of Education, Kilis/Türkiye
2 University of Tezas Rio Grande Valley, College of Education and P-16 Integration, Edinburg/TX AR T I C L E I N F O A B ST R A C T Article History: Received 24.11.2017 Received in revised form 02.04.2018 Accepted 04.06.2018 Available online 30.06.2018
In the current study, we investigated the psychometric properties of two meaningful measures of support from teachers and school counselors among Latina/o students. Examining factorial stability with diverse populations is important to make sure that measures provide valid information about constructs of teacher or counselor support. While researchers have provided evidence of reliability (i.e., consistency), no study has examined validity (e.g., accuracy) of Teacher Support Scale Revised (TSSR) with Latina/o students. Confirmatory and exploratory factor analyses (CFA and EFA) methods were used to evaluate structural validity of the TSSR and School Counselor Support Scale (SCSS). Two different models of the TSSR were analyzed. Findings from multiple CFAs showed that five-factor 22-item of the TSSR had an acceptable model fit. A parallel analysis and EFA were run to determine the factorial structure of the SCSS. Findings indicated that the SCSS had three factors explaining 68% of the variance in the model. The results and implications for research and practice in Latina/o students were discussed
© 2018 AUJES. All rights reserved Keywords: Teacher Support Scale Revised, School Counselor Support Scale, Latina/o students, instrument validation
Introduction
Demographers noted that the Hispanic population is one of the fastest growing groups in the United States (U.S.) with Mexican Americans making up the largest subgroup of the Hispanic population (U.S. Census Bureau, 2012). Similar to other researchers (Author, 2016a; Bulotsky-Shearer, Bouza, Bichay, Fernandez, & Hernandez, 2016; Edwards, 2004), we use Latina/o to refer to individuals who are associated with one of the following: Cuban, Dominican, Mexican, Puerto Rican, Spanish, or communities from Central or South America (U.S. Census Bureau, 2008). Despite this demographic shift in the U.S., Latina/o students have low academic achievement and the highest high school dropout rates (American Council on Education [ACE], 2012). The achievement gap between Latina/o students and their peers in terms of grades and test scores is also well-known (ACE, 2012). Additionally, researchers at the Pew Research Center (2016) estimated that 15% of Latinas/os between ages 25 to 29 received a college degree compared with 40% of
White adults. Latina/o students also rank low on college readiness compared with their white and Asian counterparts (Author, 2016b; Texas Education Agency, 2011). Given that researchers and counselors study or monitor Latina/o students’ perceptions of support from teachers and school counselors as indicators of academic goals and achievement, assessments that demonstrate strong psychometric support for use with Latina/o students need to be identified.
In the current study, we focus on students’ perceptions of support from high school teachers and counselors. Given that the aforementioned forms of support are related with students’ academic achievement and resilience, counselors must find ways to measure and increase students’ perceptions of support. We also believe that the focus should be on those groups who struggle the most with lack of support from school personnel such as Latina/o students. As a result, the purpose of the current study was to identify the factor structures of the Teacher Support Scale Revised (TSSR; McWhirter, 1996) and School Counselor Support Scale (SCSS) with Latina/o students in order to provide the field with measures of teacher and counselor support that have evidence of validity.
Teacher Support
High school teachers are encouraged to provide Latina/o students with various forms of support, including high expectations (White House Initiative on Educational Excellence for Hispanic Americans [WHIEEHA], 2003) and access to college information. Although some researchers found that teachers provided Latina/o students with support, encouragement, and high expectations, other researchers found that teachers communicated low expectations to Latina/o students. Hassinger and Plourde (2005) investigated personal traits and external factors among successful Hispanic high school students. In addition to an internal locus of control, positive disposition, and positive self-esteem, these students had supportive relationships with teachers. Participants in this study emphasized that teachers had high expectations and believed in their academic potential. Additionally, Cavazos vd. (2010) interviewed Latina/o college students and found that students perceived different experiences, expectations, and mentoring from high school teachers. Some students cited teachers who had high expectations of their academic potential. However, researchers found that some high school teachers communicate low expectations to Latina/o students (Marx, 2008). Consequences of low academic expectations may include giving up on educational dreams (Martinez, 2003), disengagement from school (Cagle, 1998), and engaging in self-doubt. Cavazos vd. (2010) examined Latina/o students’ perceptions of high school teachers. Their findings suggested that some Latina/o students received low expectations from teachers, as indicated by a student who said, “My teachers would judge me on GPA and that would hurt me. ‘You’re not in AP. You’re not in an AP class, so therefore you’re not smart” (Author, 2010, p. 67). In summary, the literature contains evidence to suggest that although teachers are supposed to provide Latina/o students with high academic expectations (WHIEEHA, 2003) and access to college information,
there appears to be a gap between these mission statements and the implementation of such standards.
One popular instrument of measuring students’ perceptions of support is the TSSR (McWhirter, 1996). A review of published studies revealed a trend for applications of subscale scores as predictor variables of students’ academic achievement and goals. Reliability on the original Teacher Support Scale (TSS) with 27 items was not available until McWhirter, Rasheed, and Crothers (2000) and Metheny et al. (2008) conducted studies using this instrument. McWhirter et al. (2000) found Cronbach’s alpha of. 96 using the original 27-item measure with high school students. In a similar vein, Ludwig and Warren (2009) found a reliability score of. 96 using a revised 25-item measure in a study with high school students. In addition, Metheny et al. (2008) conducted internal consistency analyses on a 21-item measure and found internal consistency reliability coefficients using Cronbach’s alpha for the following subscales: investment (α=.92), positive regard (α=.89), expectations (α= .88), and accessible (α =.85) to be acceptable. In the current study, we used the 25-item TSSR which was revised by Ludwing and Warren (2009). The difference between the 21-item and 25-item versions is the appraisal subscale. The 25-item version instrument, which was used in the current study, included appraisal subscale. Cavazos, Hold and Flamez (2012) used the TSSR to measure the impact of Latina/o students’ perceptions of support from teachers as predictors of enrollment in Advanced Placement (AP) coursework. Scores on the TSSR had a reliability coefficient of. 97. All of the scores on the subscales for teacher support were adequate to strong: accessible (r = .73), expectations (r = .80), positive regard (r = .85), investment (r = .87), and appraisal (r = .80). They highlighted how students’ perceptions of expectations and appraisal from high school teachers influenced decisions to enroll in AP coursework.
Counselor Support
High school counselors and teachers have different roles in school settings. School counselors follow students’ development through various grades and provide information and support including expectations (Vela-Gude et al., 2009; Villalba et al., 2007) and encouragement to pursue higher education. Given that Latina/o students face numerous challenges to postsecondary education, they are one of the groups that has to be provided with academic, career, social, and emotional support. Although some researchers found that school counselors provided Latina/o students with support, encouragement, and high expectations, other researchers found that counselors communicated low expectations to Latina/o students. Vela-Gude and her colleagues (2009) interviewed Latina/o college students about their experiences with high school counselors. Although seven out of the eight participants indicated that they perceived low expectations, minimal individual counseling, and/or inadequate advisement, one participant provided several examples of high expectations as well as support to reach those expectations. One participated stated, “She had really high expectations of everyone in that program. She had high expectations of all of us, and she was the one that helped us all get to where we wanted to go” (p. 274). In another
study, Jodry, Robles-Pina, and Nichter (2004) examined the home, school, and community experiences of Hispanic high school students that led to success in an AP program. Most students in this study commented that faculty communicated care and high academic expectations. One student provided the following perspective about her high school counselor: “I’ll be the first in my family to graduate from high school. College, I didn’t think about it really until the counselor said I should” (Jodry et al., 2004, p. 28). Although some researchers indicated that Latina/o students had positive experiences with school counselors, there is generally a dearth of literature supporting these perceptions. Chavez-Reyes (2010) and Conchas (2001) found that a number of Mexican-American students’ attempts to receive such services were futile at best. Additionally, given the potential negative consequences of low expectations (e.g., self-doubt or low self-efficacy; Cavazos, 2009), it is surprising that Latina/o students continue to be subjected to low expectations from high school counselors (Vela-Gude et al., 2009). Malott (2010) interviewed adolescents of Mexican origin to examine their perceptions of strengths and challenges of their Mexican American background. Some students described low expectations from school counselors, as indicated in the following comment, “They all expect you to do bad in classes and they don’t pay attention to you because they all think you’re going to fail anyway” (Malott, 2010, p. 16).
One popular instrument of measuring students’ perceptions of school counselor support is the SCSS, which is a similar instrument to the TSSR but with references to school counselors (McWhirter, 1996). A review of published studies (Author, 2014; Author, 2015) revealed a trend for applications of subscale scores as predictor variables in multiple regression models of students’ academic decisions and college-going beliefs. Cavazos Vela, Zamarripa, Balkin, Johnson, and Smith (2014) used the SCSS to measure the extent to which students’ perceptions of support from school counselor predicted enrollment in AP coursework. Reliability of the total score was. 96. Reliability coefficients scores on each subscale ranged from acceptable to strong: accessible (α = .81), expectations (α = .82), positive regard (α = .90), investment (α = .92), and appraisal (α = .87). In another investigation, Vela, Flamez, and Clark (2015) examined how support from school counselors influenced Mexican American adolescents’ college-going beliefs. Reliability coefficients for scores on each subscale were sufficient to strong: accessible (α = .78), expectations (α = .89), positive regard (α = .89), investment (α = .94), and appraisal (α = .84). In summary, researchers (Author, 2012, 2014) have used the SCSS to measure the impact of Latina/o students’ perceptions of school counselor support on students’ educational decisions, behaviors, and college-going beliefs.
Purpose of the Study
Although the TSSR and SCSS were used in the above-mentioned research studies reviewed, these instruments have not been psychometrically evaluated with Latina/o populations. Examining factorial stability with diverse populations is important to make sure that measures provide valid information about constructs of teacher or counselor support (Author, 2016). While researchers have provided
evidence of reliability (i.e., consistency), no study has examined validity (e.g., accuracy) with Latina/o students. This study is important given that Latinas/os have unique experiences related to language practices, acculturation, and family importance (Author,2016a). Similar to other culturally-diverse populations (e.g., Author, 2016a; Datu, Valdez, & King, 2016), Latina/o students might have different conceptualizations of variables of interest. As such, the purpose of the present study was to evaluate the psychometric properties of the TSSR and SCSS scales among a sample of Latina/o students. We aimed to identify a factor structure for teacher and counselor support scores that could be sustained across Latina/o populations. We utilized the questions listed below to guide the study:
1. Is the TSSR scores valid and reliable for the Latina/ o population?
2. Does the SCSS scores has a valid and reliable factor structure with
Latina/o population?
Method
Following Institutional Review Board Approval, we completed a secondary analysis of data to evaluate the factor structure of the TSSR and SCSS scales with Latina/o participants who participated in research studies in the central Southern region of the U.S.
Participant Characteristics
Participants were Latina/o first year college students (n = 183) and 9th grade high school students (n = 124) who participated in research studies in the southern region of the U.S. Participants’ age ranged from 14 to 29 (M = 16.90, SD = 2.35). Our sample consisted of women (n = 134; 44%) and men (n = 173; 56%). Only participants who self-identified as Hispanic, Mexican, or Mexican American were included, resulting in several participants removed from data analysis. As previously mentioned, we use Latina/o to refer to participants in the current study.
Measurement of Constructs
Teacher support. The Teacher Support Scale-Revised (TSSR) was designed
to measure students’ perceptions of teacher support in academic activities (McWhirter, 1996). This 25-item scale measures students’ perceptions of high school teachers and consists of five subscales evaluating (a) positive regard, (b) expectations, (c) investment, (d) appraisal, and (e) accessibility. Positive regard refers to a student’s perception of teachers’ availability, care, and emotional connection. This subscale includes six items. Moreover, expectations, which include five items, relate to students’ perception of teachers’ positive expectations for academic success. Investment is described as a student’s perception of behaviors to help in future endeavors. This subscale includes seven items. Appraisal refers to students’ perceptions of teachers’ evaluation of their work and includes 4 items (Author, 2014; McWhirter, 1996). Finally, accessibility relates to the extent to which a student feels teachers are available for information and includes three items (Metheny et al., 2008). All of the participants responded to a five point Likert-scale
ranging from strongly agree (5) to strongly disagree (1). Students respond to items such as “support my goals for the future,” “push me to succeed,” and “care about me as a person.” Higher scores represent greater perceived levels of teacher support (McWhirter, 1996). Reliability coefficients for scores on the total scale and subscales were measured in previous samples using coefficient alpha. McWhirter et al. (2000) found a coefficient alpha of. 96 in a sample with high school sophomores and Ludwig and Warren (2009) found .96 in a study with high school students. In addition, Metheny et al. (2008) found Cronbach’s alpha for investment (r =.92), positive regard (r =.89), expectations (r =88), and accessible (r =.85).
Counselor support. With the author’s permission, students were given a
similar version of the TSSR where all references to “teachers” were replaced with “school counselors.” This revised 25-item scale measures students’ perceptions of high school counselors and consists of five subscales evaluating (a) investment, (b) positive regard, (c) expectations, (d) accessible, and (e) appraisal. Investment is described as a student’s perception of behaviors to help in future endeavors. Students responded to eight items such as “My high school counselors… are interested in my future.” Positive regard refers to a student’s perception of high school counselors’ availability, care, and emotional connection. Students responded to five items such as “My high school counselors… think I am a hard worker.” Moreover, expectations relate to students’ perception of high school counselors’ positive expectations for academic success. Students responded to five items such as “My high school counselors… want me to do well in school.” Accessible relates to the extent to which a student feels high school counselors are available for information (Metheny et al., 2008). Students respond to three items such as “My high school counselors… will listen if I want to talk about a problem.” Finally, appraisal refers to students’ perceptions of high school counselors’ evaluation of their work (McWhirter, 1996). Reliability coefficients in previous samples for scores on each subscale were acceptable to strong: accessible (α = .81), expectations (α = .82), positive regard (α = .90), investment (α = .92), and appraisal (α = .87).
Data Analysis
Statistical power analysis. We conducted a power analysis to identify a
sample size for detecting model fit using Stevens’ (2009) criteria, n/p ≥ 10. Given our sample size of 307, we consider our sample size sufficient for making statistical inferences about model fit.
Preliminary analysis. After transferring our data into a Statistical Package for
the Social Sciences (SPSS; IBM Corporation, 2013) file, we followed three steps to clean the data. First, the data set was examined for missing data. Next step was to replace missing values within the data by using the SPSS series mean function. Final and third step included detecting multivariate outliers to achieve normality. Researchers observed the data and removed two cases from the data set due to missing responses to the instruments. A descriptive statistic was run to find the percentage of missing values. The results showed that the percentage of missing
values were. 22%. The assumption of normality was examined using the Kolmogorov-Smirnov test and was not met (p< .05). After checking histograms, Q-Q plots, skewness, and kurtosis, a Mahalanobis Distance was conducted to detect multivariate outliers. First, linear regression was run to obtain Mahalanobis Distance. A critical chi-square value (df= 2; α= .05) of 5.99 was identified. Based on the chi-square critical value, 12 cases were removed from the data set reducing the initial sample to n=307.
Primary analysis. A CFA was conducted for the TSSR using AMOS version
23. A one-factor model and five-factor model were created based on McWhirter (1996) and author’s suggestion. We interpreted the chi square statistic (x2) and
p-values, as well as goodness of fit index (GFI), comparative fit index (CFI), Tucker-Lewis index (TLI), standardized root mean square residual (SRMR), and the root mean square error of approximation (RMSEA) metrics of model fit. When inspecting these values, we used Dimitrov’s (2012) standards in which an acceptable model fit is represented in values for the x2 (p> .05), GFI > .90, CFI > .90, TLI > .90, SRMR<
.06, and RMSEA < .08. Reliability estimates in the normative sample were evaluated using Cronbach’s alpha (α) to assess internal consistency. A parallel analysis and exploratory factor analysis (EFA) were conducted to determine factor structure of SCSS.
Results Teacher Support Scale Revised
First, we analyzed the original five-factor model. From the values found in the CFA, the values x2 (265)= 810.15, p < .001; GFI= .83, CFI= .86, TLI= .85, RMSEA= .08,
and SRMR= .06, were detected relating to the suggested five-factor model. Based on modification indices (MIs) and standardized residuals, item 23 (i.e., “My high school teachers take time to get to know me.”) had the highest error covariance with four items and other latent factors. This showed that item 23 measures similar constructs with other four items and were correlated with other subscales. Item 23 was omitted from the model and second analysis was run. The results, x2 (242) = 690.52, p <
.001; GFI= .84, CFI= .88, TLI= .87, RMSEA= .08, and SRMR= .05, indicated that the second model with item removal had a mediocre fit (Dimitrov, 2012). After running the model with item removal, MIs and standardized residuals were once again consulted. Similar to modification mentioned above, item 20 (i.e. “My high school teachers push me to succeed.”) had a high level of error covariance with four items which are under different latent factors. Item 20 was omitted and the analysis was run. The results, x2 (220) = 567.60, p < .001; GFI= .86, CFI= .90, TLI= .89, RMSEA=
.07, and SRMR= .05, indicated that the second model with item removal had an improved fit. We examined MIs and standardized residuals once again to find a possible improvement in the model. None of them which had a high covariance error were under the same latent factor. Thus, similar to previous modifications, item 16 (i.e. “My high school teachers expect me to study.”) was deleted from the model since it had a high error covariance with two items under different factors.
Table 1. Correlations between the Subscales, Means (M), and Standard Deviations (SD) of the TSSR Scale M α 1 2 3 4 1. Investment 4.18 .86 .10 – 2. Positive Regard 4.16 .85 .20 .84* – 3. Expectations 4.53 .71 .14 .71* .70* – 4. Accessibility 4.05 .68 .22 .78* .84* .56* – 5. Appraisal 4.33 .75 .10 .75* .67* .68* .61*
Note. TSSR= Teacher Support Scale-Revised *p< .01
The results, x2 (199) = 492,61, p < .001; GFI= .88, CFI= .91, TLI= .90, RMSEA= .07,
and SRMR= .05, indicated that the last model with item removal had an acceptable fit except for the GFI and x2 values.
The internal consistency of the five-factor 22 items model was evaluated. The Cronbach’s alpha reliability scores ranged from. 68 for Accessibility to .86 for Investment. The total reliability score of the instrument was. 94. Table 1 contains the descriptive statistics, intercorrelations of the scores from the respective subscales, and results from reliability analysis.
Next, we consulted with McWhirter to analyze a different model of the instrument. Based on researcher’s recommendation, we examined the fit of one-factor model. The initial results of one-one-factor model were lower than the initial results of five-factor model, x2(275) = 960.73, p < .001; GFI= .78, CFI= .83, TLI= .82,
RMSEA= .09, and SRMR= .06. Modification indices and standardized residuals were examined for a better model fit and suggested an error covariance (i.e., 65.23) between item 21 (i.e., “My high school teachers are easy to talk to about things besides school.”) and item 23 (i.e. “My high school teachers take time to get to know me.”). The error covariance between two items was significant (p < .05). The results indicated that the model had a better fit than the original model, x2 (274) = 889.38, p
< .001; GFI= .80, CFI= .85, TLI= .84, RMSEA= .08, and SRMR= .06. After the above modification and rerunning the model, the MIs and standardized residuals were examined to improve the model fit. Modification indices suggested an error covariance (i.e., 47.27) between item 16 (i.e., “My high school teachers expect me to study”) and 17 (i.e., “My high school teachers tell me if I’m not working hard enough”). The error covariance between two items was significant (p < .05). The results showed that the second modification was slightly better than the first modification; x2 (273) = 838,72, p < .001; GFI= .80, CFI= .86, TLI= .85, RMSEA= .08,
and SRMR= .06. Although there were several additional modifications, we did not make additional changes since it would not improve the model significantly. The results indicated that one-factor model did not fit the data.
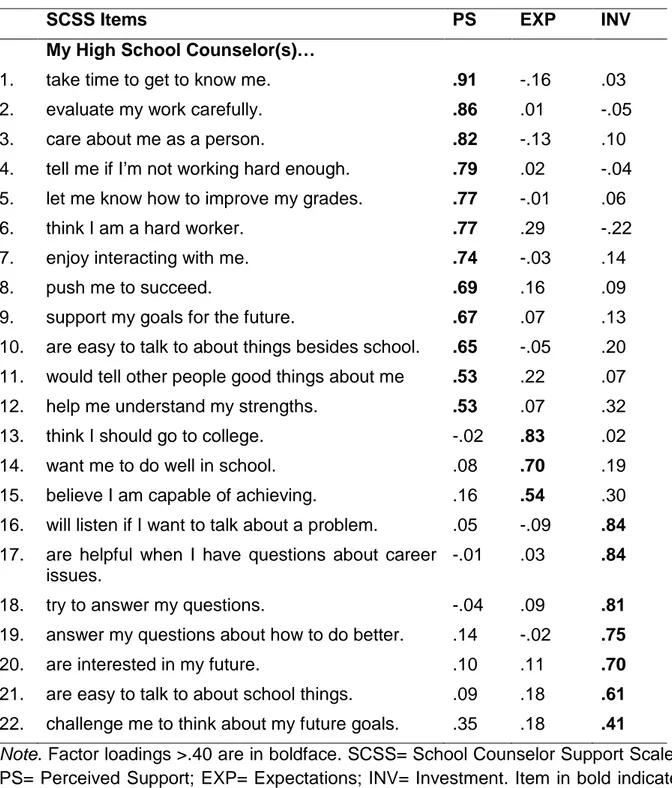
Table 2. Instrument Items and Factor Loadings
SCSS Items PS EXP INV
My High School Counselor(s)…
1. take time to get to know me. .91 -.16 .03
2. evaluate my work carefully. .86 .01 -.05
3. care about me as a person. .82 -.13 .10
4. tell me if I’m not working hard enough. .79 .02 -.04
5. let me know how to improve my grades. .77 -.01 .06
6. think I am a hard worker. .77 .29 -.22
7. enjoy interacting with me. .74 -.03 .14
8. push me to succeed. .69 .16 .09
9. support my goals for the future. .67 .07 .13
10. are easy to talk to about things besides school. .65 -.05 .20
11. would tell other people good things about me .53 .22 .07
12. help me understand my strengths. .53 .07 .32
13. think I should go to college. -.02 .83 .02
14. want me to do well in school. .08 .70 .19
15. believe I am capable of achieving. .16 .54 .30
16. will listen if I want to talk about a problem. .05 -.09 .84
17. are helpful when I have questions about career
issues.
-.01 .03 .84
18. try to answer my questions. -.04 .09 .81
19. answer my questions about how to do better. .14 -.02 .75
20. are interested in my future. .10 .11 .70
21. are easy to talk to about school things. .09 .18 .61
22. challenge me to think about my future goals. .35 .18 .41
Note. Factor loadings >.40 are in boldface. SCSS= School Counselor Support Scale; PS= Perceived Support; EXP= Expectations; INV= Investment. Item in bold indicate scale loading.
Counselor Support Scale
Counselor support scale was used in previous studies (Cavazos Vela, Flamez, & Clark, 2015) but its psychometric properties were not reported. Therefore, we ran a parallel analysis and an EFA to determine the number of components to extract. First, the Kaiser-Meyer-Olkin (KMO) was examined to determine if the data were appropriate for factor analysis. The KMO value of. 96 indicated that the data were appropriate for analysis. ViSta 7.9 program, which is a free statistical program for conducting exploratory data analysis and statistical visualization methods (Young,
Valero-Mora, & Friendly, 2006), was used to run parallel analysis. To determine what factors were retained, Eigenvalues greater than 1 and scree plot analysis were used. Based on the parallel analysis and scree plot, we decided to retain three components. Subsequently, an EFA using principle component analyses with a direct oblimin rotation was conducted to identify three factors. This statistical procedure was conducted to extract maximum variance from the data set. Based on the parallel analysis, the first three eigenvalues accounted approximately 68% of the variance in the model. The identification of the three factors was based on factor loadings of .40 or greater. Tabachnick and Fidell (2013) stated. 32 is a good rule of thumb for the minimum loading of an item. However, we omitted items that had loadings less than .40 and were cross loaded to have a clear factor structure. Of the 25 original items included on the scale, three were eliminated (see Table 2). The remained three factors were named as Expectations, Investment, and Perceived Support. The internal consistency of the scores was evaluated. The Cronbach’s alpha reliability scores ranged from. 79 for Expectations to. 95 for Perceived Support. The total reliability score of instrument was. 96. Table 3 contains the descriptive statistics, intercorrelations of the scores from the respective subscales, and results from reliability analysis.
Table 3. Correlations Between the Subscales, Means (M), and Standard Deviations
(SD) of the SCSS
Scale M α SD 1 2
1. Perceived Support 3.73 .95 .17 --
2. Expectations 4.43 .79 .17 .70* –
3. Investment 4.01 .92 .06 .83* .68*
Note. SCSS= School Counselor Support Scale *p< .01
Additional Evidence of Internal Structure
Further evidence of internal structure was examined through differential item functioning to evaluate differences among subgroups (AERA, APA, & NCME, 2014) for first year college students and 9th grade high school students. To address differences between college and high school student subgroups, multiple independent t tests were conducted using the three subscales of SCSS. Mean and standard deviations of college and high school students are provided in Table 4. A statistically significant difference was noted between college and high school students on Perceived Support, t(305)= 4.736, p<.001. Effect size was medium, d= .57, indicative of moderate differences between the groups. In addition, the difference between groups on Investment scores was statistically different, t(305)= 4.499, p<.001. Effect size was medium, d= .54, indicative of moderate differences between the groups. There was no statistically significant difference between groups on Expectation scores, t(305)= .499, p>.05.
Table 4. Descriptive and Comparative Statistics for the SCSS Items between Groups
Scale
High School Students (n=124)
First Year College Students (n= 183) t test p value Cohen’s d M SD M SD Perceived Support 48.29 8.67 42.46 11.67 4.73 .000 .57 Expectations 13.36 2.01 13.25 1.86 .499 .203 .06 Investment 29.95 4.51 26.83 6.75 4.50 .000 .54 Discussion
The purpose of this study was to identify factor structures for the TSSR and SCSS that could be sustained across Latina/o students. Given the increasing interest in assessing perceptions of support due to the relationship with achievement and counseling outcomes, providing validity evidence for these instruments with diverse populations is important. The final five-factor model for teacher support demonstrated good psychometric properties after removing three items when administered to a Latina/o population. After making relevant modifications based on inspection of modification indices, a modest five-factor structure including 22 items with Latina/o students was confirmed. This finding was consistent with a previous model used by other researchers (e.g., Five-factor 21-item instrument; Metheny et al., 2008). As a result, we suggest that this initial exploration of this scale may provide researchers and school practitioners with a measure to examine perceptions of support using a modified version of this instrument. A reason to have a different factor structure with Latina/o population than original TSSR could be the cultural differences between normative group and Latinas/os. When we look at the previous studies (see Author, 2016a; Cokley, 2015; Lee, IM, & Chee, 2009) using measures developed by dominantly white participant samples demonstrated a different factor structure when evaluated with minorities or different ethnic groups. This study indicated similar results.
Additionally, the three-factor model of counselor support demonstrated good psychometric properties based on parallel analysis and EFA when administrated to a Latina/o population. Unlike the teacher support scale which has five factors, the counselor support scale has three factors: perceived support, expectations, and investment. Although the SCSS items were adapted from the TSSR, the SCSS showed a different factor structure than the TSSR. Accessibility, Appraisal, and Positive Regard subscales were not loaded under the SCSS. In addition, Perceived Support was emerged as a new subscale. Explanations for these findings include that appraisal does not fall into the role of school counselors (Vela et al., 2014) and the large counselor-student ratio in many schools throughout the US. Students might perceive their school counselors to be accessible for individual counseling, advisement, or college information. With these considerations in mind, we suggest that researchers should develop a new instrument to measure perceptions of support
from school counselors that align with the American School Counseling Association’s (ASCA) National Model (2012).
The normative sample included a variety of participants from different education levels. As expected, differences between first year college student and 9th grade high school student subgroups were noted. Hence, the SCSS may demonstrate generalizability in other educational levels (e.g., colleges, high schools, middle schools)
Implications for Practice
Findings from the current study indicate that despite being normed on a mostly White population, the TSSR and SCSS can serve as a measure of perceptions of support among Latina/o students. Given the importance of teacher and counselor support on students’ academic and clinical outcomes, counselors should work to develop and measure support in students. We found evidence of validity with Latina/o students and agree with others who stated that using instruments that are culturally-appropriate is important to measure variables under examination. Informed by the results of this study, school counselors can use the aforementioned scales with students to measure and provide feedback to help increase perceptions of support. If students have low perceptions of support from teachers or counselors, they can use a therapeutic intervention to assess and increase support. Additionally, counselors can use individual items to further explore Latina/o students’ perceptions of support. As one example, if a Latina/o student reports feeling of a “2” on an individual item with 5 being “high support,” counselors can use the following solution-focused questions to further explore meaning: “What does this 2 look like? When was the last time you felt like a 5? What would it take for you to feel like a 5 again?” . Findings that these scales have evidence of validity with Latina/o students could be presented to students in Multicultural Counseling, School Counseling, or Assessment classes in order to facilitate discussion regarding how perceptions of support can be fostered and measured in Latina/o students.
Implications for Research
Based on this study’s findings, there are implications for future research. First, researchers should continue to validate instruments with Latina/o students to determine the degree that some TSSR and SCSS items need to be revised. Additionally, investigations identifying relationships between teacher and counselor support scores with other constructs would demonstrate evidence with other variables and internal structure. If researchers provide convergent, discriminant, and predictive evidences among teacher support, counselor support, and other variables, important scholarship with Latina/o populations might develop. Other important factors to investigate include career self-efficacy, college-going beliefs, academic achievement, and psychological grit. It also is important to validate the TSSR and SCSS instruments in Spanish with Mexican American populations. Similar to other culturally-diverse populations (e.g., Turkish; Author, 2016a), developing and validating instruments in participants’ native language might change factor structures.
Finally, researchers should develop and validate a school counselor support using items specific to school counselors. Given that there was not an available school counselor support scale, we used the TSSR where “teachers” were replaced with “school counselors.” Given that some items and subscales (e.g., appraisal) might not be relevant for school counselors, researchers should develop and validate a school counselor support scale in order to provide practitioners with a meaningful assessment.
Limitations
Despite practical implications for counselors and researchers to use the TSSR and SCSS scales, our results reveal limitations that require further research. First, results of the model in the current study were exploratory and additional factor analyses may provide a more trustworthy depiction of these instruments’ factor models. Second, data collected in the current investigation came from communities with over 90% Mexican Americans. Researchers evaluating the reliability and factor structure of these scales with other Latina/o populations and sub-groups (e.g., Puerto Rican) may provide greater accountability for their unique cultural and academic experiences. Finally, we did not collect information about Latina/o students’ language background. Although we only included English-speaking students who identified as Hispanic, Mexican, Latina/o, or Mexican American, findings could serve as a framework to validate instruments in Spanish with Latina/o populations.
Conclusion
In this study, we described the psychometric evaluation of the TSSR and a similar SCSS with Latina/o students. The results of our exploratory investigation indicated that the TSSR demonstrates a modest five-factor structure has practical implications for counselors and researchers working with Latina/o students. We also found a modest three-factor structure for the counselor support scale. Although further research is needed to further evaluate the factor structure of these scales, we believe that this study provides teachers and counselors with an instrument to measure support among Latina/o students.
References
American Council on Education. (2012). New issue brief explores African American and Hispanic college attainment gaps. Retrieved from
http://www.acenet.edu/news-room/Pages/New-Issue-Brief-Diversity-Attainment-Gaps.aspx
American Educational Research Association, American Psychological Association, & National Council of Measurement in Education. (2014). Standards for educational and psychological testing. Washington, DC: American Educational Research Association.
American School Counselor Association. (2012a). The ASCA national model: A framework for school counseling programs (3rd ed.). Alexandria, VA: Author
Cagle, J. (1998). One Teacher's Perspective on the Difference of Academic Expectations for Hispanic Students: A Case Study, presented at the AnnualMeeting of the American Educational Research Association Conference, San Diego, 1998. San Diego, CA: ERIC
Cavazos, J., Johnson, M. B., Fielding, C., Cavazos, A. G., Castro, V., & Vela-Gude, L. (2010). A qualitative study of resilient Latina/o college students. Journal of Latinos and Education, 9, 172-188. doi: 10.1080/15348431003761166
Cavazos, J., Holt, M. L., & Flamez, B. (2012). Using narrative therapy to help Hispanic students pursue and succeed in higher education: Implications for counselors and counselor educators. Arizona Counseling Journal, 27, 4-14. Cavazos Vela, J., Flamez, B., & *Clark, A. (2015). The role of high school counselors’
support on Latina/o students’ vocational self-efficacy and outcome expectations. Journal of School Counseling, 13(11), 1-28.
Cavazos Vela, J., Zamarripa, M. X., Balkin, R. S., Johnson, M. B., & Smith, R. L. (2014). Understanding Latina/o students’ perceptions of support from school counselors and acculturation as predictors of enrollment in AP coursework. Professional School Counseling, 17, 142-152.
Bulotsky-Shearer, R. J., Bouza, J., Bichay, K., Fernandez, V. A., & Gaona Hernandez, P. (2016). Extending the validity of the family involvement questionnaire-short form for culturally and linguistically diverse families from low-income backgrounds. Psychology in the Schools, 53, 911-925. doi:10.1002/pits.21953
Chavez-Reyes, C. (2010). “Starting at the top:” Identifying and understanding later-generation Chicano students in school. Journal of Latinos and Education, 9, 22-40. doi: 10.1080/15348430903252037
Cokley, K. (2015). A confirmatory factor analysis of the academic motivation scale with black college students. Measurement and Evaluation in Counseling and Development, 48, 124-139. doi:10.1177/0748175614563316
Conchas, G. Q. (2001). Structuring failure and success: Understanding the variability in Latino school engagement. Harvard Educational Review, 71, 475-504. Datu, J. A., Valdez, J. P., & King, R. B. (2016). Perseverance counts but consistency
does not! Validating the Short Grit Scale in a collectivist setting. Current Psychology, 35, 121-130. doi:10.107/s12144-015-9374-2
Edwards, L. M. (2004). Measuring perceived social support in Mexican American youth: Psychometric properties of the multidimensional scale of perceived social support. Hispanic Journal of Behavioral Sciences, 26, 187-194. doi:10.1177/0739986304264374
Hassinger, M., & Plourde, L. A. (2005). "Beating the odds": how bi-lingual Hispanic youth work through adversity to become high achieving students. Education, 126, 316-327.
IBM Corporation. (2013). IBM SPSS Statistics for Windows, Version 22.0. Armonk, NY: IBM Corporation.
Jodry, L., Robles-Pina, R., & Nichter, M. (2004). Hispanic academic advancement theory: An ethnographic study of urban students participating in a high school advanced diploma program. High School Journal, 88, 23-31. doi: 10.1353/hsj.2004.0024
Lee, B., Im, E., & Chee, W. (2009). Psychometric properties of the KPAS in diverse ethnic groups of midlife women. Western Journal of Nursing Research, 31, 1014-1034. doi:10.1177/0193945909341581
Lenz, A. S. (2015). Using single-case research designs to demonstrate evidence for counseling practices. Journal of Counseling and Development, 93, 387-393. doi:10.1002/jcad.12036
Lo Presiti, A., Pace, F., Mondo, M., Nota, L., Casarubia, P., Ferrari, L., Betz, N. E. (2012). An examination of the structure of the career decision self-efficacy scale (short form) among Italian high school students. Journal of Career Assessment, 21, 337-347. doi:10.1177/1069072712471506
Ludwig, K., & Warren, J. (2009). Community violence, school-related protective factors, and psychosocial outcomes in urban youth. Psychology in the Schools, 46, 1061-1073. doi:10.1002/pits.20444
Malott, K. M. (2010). Being Mexican: Strengths and challenges of Mexican-origin adolescents. Journal of School Counseling, 8, 1-39.
Martinez, M. D. (2003). Missing in action: Reconstructing hope and possibility among Latino students placed at risk. Journal of Latinos and Education, 2, 13-21. doi:10.1207/S1532771XJLE0201_3
Marx, S. (2008). Popular White teachers of Latino kids: The strengths of personal experiences and the limitations of whiteness. Urban Education, 43, 29-67 McWhirter, E. H. (1996). Teacher Support Scale (TSS). A measure of support
experiences by high school students from their high school teachers. Unpublished manuscript.
McWhirter, E. H., Rasheed, S., & Crothers, M. (2000). The effects of high school career education on social-cognitive variables. Journal of Counseling Psychology, 47, 330-341. doi:10.1037//0022-0167.47.3.330
Metheny, J., McWhirter, E. H., & O’Neil, M. (2008). Measuring perceived teacher support and its influence on adolescent career development. Journal of Career Assessment, 16, 218-237. doi: 10.1177/1069072707313198
Pew Research Center (2016). The demographic trends shaping American politics in 2016 and beyond. Retrieved from http://www.pewresearch.org/fact-tank/
Stevens, J. P. (2009). Applied multivariate statistics for the social sciences (5th ed.). New York, NY: Routledge.
Tabachnick, B. G., & Fidell, L. S. (2013). Using multivariate statistics (6th ed.). Boston, MA: Pearson Education.
Texas Education Agency. (2015). Texas Academic Performance Reports (TAPR). Retrieved from https://rptsvr1.tea.texas.gov/perfreport/tapr/index.html
U.S. Census Bureau. (2008). Hispanic Origin. Retrieved from http://quickfacts.census.gov/qfd/meta/long_RHI725206.htm
U.S. Census Bureau (2012). Most children younger than age 1 are minorities,
Census Bureau Reports. Retrieved from http://www.census.gov/newsroom/releases/archives/population/cb12-90.html
Vela-Gude, L., Cavazos, J., Johnson, M. B., Fielding, C., Cavazos, A. G., Campos, L., & Rodriguez, I. (2009). “My counselors were never there:” Perceptions from Latina/o college students. Professional School Counseling, 12, 272-279.
Villalba, J. A., Akos, P., Keeter, K., & Ames, A. (2007). Promoting Latino student achievement and development through the ASCA national model. Professional School Counseling, 10, 464-474.
White, M., & Epston, D. (1990). Narrative means to therapeutic ends. New York, NY: W. W. Norton.
White House Initiative on Educational Excellence for Hispanic Americans (2003). From risk to opportunity: Fulfilling the educational needs of Hispanic Americans in the 21st century. Final report of the President’s Advisory
Commission on Educational Excellence for Hispanic Americans.
Washington, DC: Author.
Young, F.W., Valero-Mora, P. & Friendly, M. (2006). Visual statistics seeing data with dynamic interactive graphics. Hoboken, NJ: Wiley and Sons.