IC
ON
A
Volume 2, Issue 2, pp: 1 - 13
ISSN: 2147-9380
available online at: www.iconarp.com
Jour na l of A rc hite cture a nd Pl an ni ng
Abstract
Diagrams are essential in the preliminary stages of design for understanding distributive aspects and assisting the decision-making process. By drawing a schematic graph, designers can visualize in a synthetic way the relationships between many aspects: functions and spaces, distribution of layouts, space adjacency, influence of traffic flows within a facility layout, and so on. This process can be automated through the use of modern Information and Communication Technologies tools (ICT) that allow the designers to manage a large quantity of information.
The work that we will present is part of an on-going research project into how modern parametric software influences decision-making on the basis of automatic and optimized layout distribution. The method involves two phases: the first aims to define the ontological relation
PRELIMINARY DESIGN
THROUGH GRAPHS:
A Tool for Automatic
Layout Distribution
Carlo BIAGINI, Vincenzo
DONATO, Davide PELLIS
Keywords:graph representations, parametric design, automated layout distributions
Carlo Biagini, Prof. Dr., University of Florence, Dept. of Architecture, Florence [email protected]
Vincenzo Donato, International Ph.D. at University of Florence and Technical University of Braunschweig.
[email protected] Davide Pellis, International Ph.D. Student at University of Florence and Technical University of Braunschweig. [email protected]
Jour na l of A rc hite cture a nd Pl an ni ng
2
between spaces, with particular reference to a specific buildingtypology (rules of aggregation of spaces); the second entails the implementation of these rules through the use of specialist software. The generation of ontological relations begins with the collection of data from historical manuals and analyses of case studies. These analyses aim to generate a “relationship matrix” based on preferences of space adjacency. The phase of implementing the previously defined rules is based on the use of Grasshopper to analyse and visualize different layout configurations. The layout is generated by simulating a process involving the collision of spheres, which represents specific functions of the design program. The spheres are attracted or rejected as a function of the relationships matrix, as defined above. The layout thus obtained will remain in a sort of abstract state independent of information about the exterior form, but will still provide a useful tool for the decision-making process. In addition, preliminary results gathered through the analysis of case studies will be presented. These results provide a good variety of layout distributions over a short time for medium and large-scale problems.
INTRODUCTION
In the design process understanding which layout distribution is suitable for a particular context is a complicated task, especially regarding the design of complex buildings that are highly influenced by the functional types (such as airports, hospitals, industrial factories, and so on). Obtaining an optimized distribution in terms of minimization of connections between spaces in advance could give the designer an important advantage.
In the literature different methods have been shown that bring the designer towards an automated layout distribution. Many of them are based on algorithms that lead to abstract solutions in terms of architectural quality; they also generate very complicated numerical results which require a great deal of effort to decode the output data.
One possible approach is to implement an algorithm that can automatically produce an abstract representation of a possible optimized layout distribution. In our work we intend “optimal solution” to mean a layout that presents the minimum distances between functions and spaces. Subsequently this abstract representation can be used as a reference to generate a conventional architectural representation.
To achieve an automated layout distribution it is possible to use the analogy of the cinematic system where spaces, represented by circles or spheres, are inserted in a specific universe governed by dynamic laws. These cycles are attracted or rejected in accordance with the strength of the springs that connect the barycentre of the circles. Once the analysis begins,
Jour na l of A rc hite cture a nd Pl an ni ng
3
these circles assume an equilibrium configuration. Grasshopper, a plug in for Rhinoceros, allows the automatization of this task.
The calculation of the optimal design solution is a function of specific mathematical criteria, based on the transformation of qualitative factors into quantitative parameters. The ontological relations between spaces or functions are expressed through a relationships matrix that considers the adjacency preferences (adjacency, proximity, inclusion separation, and so on). These preferences are converted into different forces of attraction or repulsion, through a dynamic system.
In the article we will present a method to achieve a set of possible optimized distributions starting from a relationship matrix. In addition, we will also show a case study based on the urban distribution analysis of the layout distribution for a complex urban distribution of the Hospital of the city of Florence.
STATE OF THE ARTS
According to Kalay, design can be considered as a problem-solving activity and “the problem it sets out to solve arises from the inability of a current situation to satisfy some needs” (Kalay, 2004). He continues by proposing a series of questions: “How can we tell if a proposed design solution will achieve them? How can we measure the “goodness” and uncover its undesired side and after-effects before constructing the buildings? How can we begin the search for design solutions in the first place?” (Kalay, 2004 p. 205).
An answer can be found in the history of architecture. In particular, research into “best practice in design” has perplexed philosophers and architects since Ancient Greek times. In the first century BC, Vitruvius offered some answers to this question, giving a “good solution” through specific geometrical proportion. Since then, architects and researchers have tried to formulate theories, methods, and tools that will help the designer to “predict” the results (Edwards, 1979).
In recent eras, the starting point for many design methods has been the notion that design is a process of searching for a solution that satisfies a given set of goals and constraints. One possible tool to use in architecture (or indeed in any field that requires similar design activity) is to represent the problem through graphs and diagrams. In fact in the work of Hellen Do and Nigel Gross they explain “graphs and diagrams are the essential representations for thinking, problem solving, and communication in the design disciplines in an abstract form” (Do & Gross, 2001). This abstraction allows the designer to “distil the meaning of the message, focusing attention on its salient characteristics […] which details are preserved, and which ones
Jour na l of A rc hite cture a nd Pl an ni ng
4
are omitted, depend on the subject of communication, on its purpose, on the knowledge of the receiver, on the connect of the commutation, and on the medium used for its transmission” (Kalay, 2004, p. 88).
If we refer to a layout distribution, for instance, it is possible to represent the same floor plan in two different types of encoding, as depicted in the figure below (Figure 1).
Figure 1
A high degree of abstraction, therefore, makes communication more efficient, though not necessarily more effective. Abstraction can help to highlight certain specific features to capture the receiver’s attention. Clearly the balance between the loss of information and abstraction has to be decided in accordance with the knowledge of the receiver, because this form of representation omits a series of information that must be completed by the receiver.
In the Information Technology (IT) age this abstraction was catapulted and converted into a machine language and explored in different forms.
IT tool for design process solving
In the early sixties, Christopher Alexander published the influential book “Notes on the Synthesis of Form” (Alexander, 1964). As a mathematician, he introduced set theory, analysis and algorithms as tools for addressing design problems. At the time, these were only partially implemented through the use of computers, due to the high cost of the technology.
Following this research, in the late ‘60s, scientists and academics began to experiment with computerized algorithms in the field of architecture. “One of the areas where the computer can be helpful to an architect is in space allocation, in finding a large number of possible schemes at a sufficiently early stage of the design process, and choosing the best one for further development” (Terzidis, 2001). But the main problem was the “[…] high number of constraints that have to be simultaneously
Figure 1.Second floor plan of the Gropius House
Jour na l of A rc hite cture a nd Pl an ni ng
5
taken into account in solving a design problem, and it was difficult to find a method to consider them all. Moreover, the only way to arrive at a conclusion was to break down the problem into sub-problems and use a non-deterministic approach” (Terzidis, 2001).
After a few years, new ways were sought to approach design problems using “linguistics” and “logic”. In this instance, the designer confronts the problem through decomposing its structure by grouping constraints into thematic areas (e.g. zoning, circulation), and then considering each group of constraints more or less independently. This information, converted into sentences, allows for the consideration of not only singular elements but also the rules and relationships for achieving a meaningful composition.
For Coons, the design process is a complex phenomenon consisting of intricate nodes in which intuitive imaginative and analytical, mathematical and rational processes are in dialogue. In his work he explains that human reason always shows a great ability for invention, building, comparison and judgement; but is extremely inefficient in executing rational processes that require the manipulation of a large quantity of interrelated data in a complex way. On the other hand, computers are particularly efficient on an analytical level, but completely free of the ability to create. The most logical thing seems to be to find a way of merging the creative capability of the human brain and the analytic and computational capability of the machine (Coons, 1964).
The way in which the human brain differs from the computer is precisely what makes it more efficient during the design process. In terms of learning ability, memory, precision, and operation of an algorithm, the computer is more efficient than the brain. But the brain will always be superior any time it has to make a judgement of value, recognition of form or association of ideas. In other words, the most efficient design process is one that is able to use the brain and the computer in a symbiotic relation (Broadbent, 1970).
Another type of approach that was experimental and partially implemented through experiences with the computer has made it essential to use “heuristic approaches”: “Design synthesis methods are typically inspired by the analogies and guided by the architect’s own or another designer’s previous experience” (Kalay, 2004, p. 255). Techniques of trial and error are usually the basis for a heuristic approach to a solution. In fact, this technique is closer to the “search-and-evaluate” process used in architectural design than any other type. For synthesizing the design solution, one of the most common heuristic methods is to “borrow” from other knowledge areas,
Jour na l of A rc hite cture a nd Pl an ni ng
6
which appear to hold some relevance to the problem. Philip Steadman in 1974 was the first to propose borrowing the metaphor from electrical networks to guide the computational synthesis of architectural form. He found a surprising similarity between a specially constructed graphical representation of architectural floor plans and the physics of electricity, as expressed by Kirchhoff’s law of electrical flow.
A similar metaphor was presented by Arvin and House, which made an analogy with mechanical springs, applying “the principle of dynamic motion and geometrical deformation to rigid and non-rigid objects for the purpose of simulating realistic behaviour and visual effects” (Arvin & House, 2002). Topological design objectives such as adjacencies between spaces and relationships between them could be expressed by the strength of a spring that is linked into the barycentre of a space.
Instead, many researchers affirm that the most common approach to the synthesis of new design solutions is by looking at case studies because it is believed that the current problem under investigation is not fundamentally different from a similar problem that has been encountered in the past.
METHODOLOGY
Usually the preliminary design phase begins with a careful analysis of the preliminary requirement documents, which make it possible to define the number of functional spaces needed. Moreover, the designer has to think of a solution which is compatible with the standard laws, both architectural and urban, and convert the idea into a “boundary condition volume”, in which it is possible to allocate the spaces previous defined.
In this moment the process of searching for the best design solution starts, by proposing several layout configurations. One possible method is to define a relationship matrix that allows a systematic evaluation of the relation between functions and spaces.
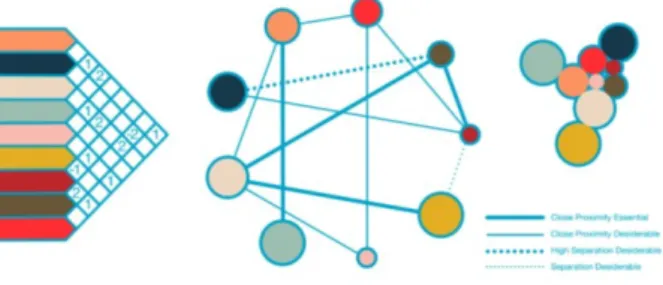
The designer assigns a value to a specific spatial relationship. This spatial relationship could, for example, be subdivided into a five-point scale such as “close proximity essential”, “close proximity desirable”, “separation desirable”, “high separation desirable”, and “no spatial relation”. The value is indicated in the intersection of the rows (Figure 2).
Jour na l of A rc hite cture a nd Pl an ni ng
7
Figure 2The matrix is reviewed for its critical relationships and is represented graphically through a diagram created to illustrate these relationships spatially. In addition, the “mathematical relation” (adjacency) can be represented in a graphical form through a diagram as shown in the figure below (Figure 3).
Figure 3
Through this method one can study different issues related to the preliminary design. It is possible to represent the geographical exposition of spaces (north, south, east and west), the access to daylight or different type of user flows. In this last category, for instance, different types of flows within the building can be identified, subdividing them into public or private users, suppliers, workers, hazardous materials, and so on. Through the graphical overlapping of all of these, it is possible to highlight design criticism and intervene in the decision-making process to achieve a better design solution.
Figure 2.Example of a relationship matrix
SPACE GROUP C
SPACE GROUP A
SPACE GROUP B
Jour na l of A rc hite cture a nd Pl an ni ng
8
Additional steps could be taken to implement this system and achieve an automated distribution. Referring to the work of Arvin and House (Arvin & House, 2002), we can employ a method based on the analogy between dynamic motion and space distribution for solving the problem of layout (using specific CAD software), as shown in the following chapter.
Implementation through Rhino, Grasshopper and Kangaroo
The tools used for the implementation of the method are Grasshopper and Kangaroo. The former, Grasshopper, is a graphic editor for programming that is integrated in the CAD software Rhinoceros. In Grasshopper we can define geometrical algorithms by connecting pre-compiled instructions with “wires” that define the operation flux. The latter, Kangaroo, is a Grasshopper plug-in that allows us to simulate cinematic behaviour of physical particle systems. With Kangaroo we can define linear springs and non-linear attractive or repulsive forces.
Figure 4
The general idea consists of associating a “space” (depicted in the relationship matrix) with a circle, with a proportional area defined in the design requirement document. Moreover, each of these circles is connected to others through springs with specific features of attraction or repulsion according to the relationship matrix previously defined. The final layout distribution is achieved from the collision of multiple circles.
Figure 5 Figure 4. Implementation with
Grasshopper
Figure 5. Relationship matrix, starting configuration and one possible layout
Jour na l of A rc hite cture a nd Pl an ni ng
9
The process is subdivided into two phases: the former is the modelling of circles and the latter is the modelling of spatial relationships through springs.
In the first phase, circles have been modelled with a specific procedure in Grasshopper: each circle’s centre has been connected to all the others with a spring whose rest length and upper cutoff (defined as the distance over which the spring is deactivated) are equal to the sum of the two radii of the circles. The stiffness of the spring must be more than one order of magnitude higher than functional connecting springs.
In the second phase, spatial relationships that are represented through springs are modelled as linear springs if attractive, or inversely proportional to the distance if repulsive. The stiffness of springs is proportional to the level of connection or disconnection relationship. In our test the stiffness of the springs is in the ratio -3:-1:0:1:3 corresponding to the five criteria previously shown (high separation desirable, separation desirable, no spatial relation, close proximity desirable, and close proximity essential).
The simulation considered so far is strictly planar but it is possible to extend it through multiple floors using constraint parallel planes. The procedure involves the definition of the floor position for each circle. It is not possible to link spaces that belong to different floors. A vertical core (stairwells and elevators for instance) must be modelled for each floor and then linked to represent this vertical connection. These links are modelled as linear springs with a lower cutoff equal to the distance between constraint planes. The stiffness of these springs must be in the ratio of approximately 40:1 with the higher value of spatial relationship springs to guarantee the strict vertical alignment through the tiers.
Influence of the initial position
The collision simulation starts from a circular disposition (Figure 5 - b). Initial position influence can be avoided using a “trick” that consists of reducing and increasing the radii of circles during the simulation. Different speeds of increasing and decreasing during this simulation can be tested to achieve a “shaker” effect. To improve the result it is advisable to increase and decrease radii with a linear function that starts from zero and reaches the actual radius length.
If more than one layout configuration exists, different optimized layouts may be achieved in increasing and decreasing cycles with different radii of the circles.
Jour na l of A rc hite cture a nd Pl an ni ng
10
Figure 6In Figure 6 we can see an example of this simulation. From the same initial configuration it is possible to achieve different optimized layouts.
CASE STUDIES
The case studies taken into account are related to a particular typology: the hospital. We have analysed different layout distributions on different detail scale (urban, architectural, department scale) and compared them with the theoretical model.
The theoretical model was gathered from the available Italian literature¹ concerning the definition of the ontological relations occurring in a hospital with particular reference to the “Guide to technical, organizational and managerial principles for the construction and management of high-tech hospitals and assistance - Final Report”. In this document it is possible to extract important information for assembling the relationships matrix, according to the scale of the object that we would like to study.
As an example we will report a case of the layout achieved from the implemented method. The following analysis will compare the optimized layout achieved from the theoretical relationship matrix with the urban distribution of the main
1
The following books and data were used and compared to extract a relationship matrix: Neufert, E. (2007). Architects' data. John Wiley & Sons, 2012; Campolongo, S. and Angeli, F. (2013). Architecture for flexibility in healthcare
Figure 6. Different layout configuration
Jour na l of A rc hite cture a nd Pl an ni ng
11
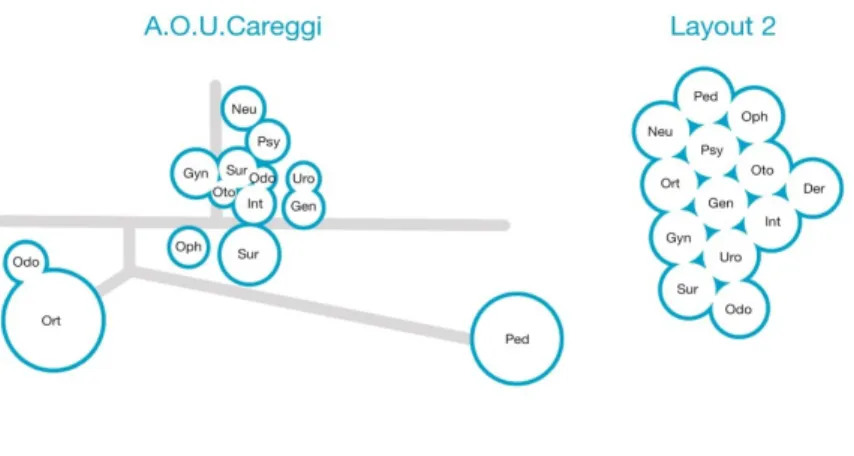
Hospital in Florence: A.O.U. Careggi. Careggi is one of the biggest health centres in Italy and it has a structure composed of a spread pavilion, situated in a unique district of the city.
Recent masterplans have commissioned a partially completed general renovation process that provides, in addition to the substitution of some of the old pavilion, the realization of an underground tunnel that allows most of the pavilions to be connected.
The relationship matrix involves four connections: close collaboration, frequent collaboration, occasional collaboration and no relationship. These relationships have been implemented as attractive springs with a stiffness in ratio 3:2:1:0. For the simulation, circle areas have been set equal.
Figure 7
Figure 7 shows the relationship matrix, the initial graph and two of the possible optimized layouts. In figure 8, we performed a comparison between the actual layout configuration and one of the possible optimized layouts.
Figure 8
The comparison between the two layouts shows some similarities regarding the central core, and some differences
Figure 7.Process of generation of layout for A.O.U. Careggi
Figure 8.Comparison between the existing layout and an optimized layout for Careggi
Jour na l of A rc hite cture a nd Pl an ni ng
12
mainly due to the position of orthopaedics and paediatrics, whilst the latter includes several internal departments.
CONCLUSION
In addition to being an important tool in driving the decision making process for the preliminary step in architectural design, the tool presented in this paper can be used for analysing criticism of any layout distribution and can be a valid method for re-designing existing configurations.
Although the method elaborated is in a preliminary version of development, it shows interesting results and contributes to the automated assessment of layout solutions.
Currently this method allows a free-form layout, dependent only on spatial relationships links. Further development will be on implementing alternative methods that address the optimized layout, towards an architectural-specific shape. Moreover, the development will be oriented towards implementing solar preferential orientation and achieving a multi-floor layout optimization, without specifying the level in advance for each space.
REFERENCES
Arvin, S. A. and House, D. H. (2002), “Modelling architectural design objectives in physically based space planning”,
Automation in Construction, 213-225.
Alexander, C. (1964), Notes on Synthesis of Form. Cambridge, Massachusetts, England: Harvard University Press.
Broadbent, G. H. (1970). La creatività. In S. A. Gregory, Progettazione razionale. Padova: Marsilio.
Coons, S. (1964). Computer Aid Design. First Boston Architectrual Center Conference. Boston: MIT.
Donato V. (2014). Transformability of Existing Building:
An approach based on BIM Technologies, University of
Florence and TU Braunschweig. PhD Thesis, pp. 31-43. Do, E. Y.-L., Gross, M. D., (2001), “Thinking with diagrams in
architectural design”, Artificial Intelligence Review, 15: 135-149.
Edwards, B. (1979). Drawing on the right side of the brain: A
course in enhancing creativity and artistic confidence. New
York: Putnam.
Kalay, Y. E. (2004). Architecture's New Media - Principle, Theory,
and Methods of Computer-Aided Design. Cambridge,
Massachusetts: MIT Press.
Terzidis, K. and Vakalo, E. (1992). “The role of Computers in Architectural Design”. In F. L. Baerle (Ed.),
Jour na l of A rc hite cture a nd Pl an ni ng
13
environmental Metamorphoses: Proceedings 12th
International Conference of the IAPS In Socio-environmental Metamorphoses, pp. 186-191, Halkidiki: Aristotle
University Press.
RESUME
Carlo Biagini, Ph.D in "Building and Territorial Engineering", is assistant professor of Architectural Drawing at the Department of Architecture of the University of Florence. He carries out research activities in the fields of Architectural Representation for Design, Building Survey and Building Information Modeling He is author of many scientific publications in specialised journals, national and international proceedings and monographic volumes.
Vincenzo Donato is Architectural Engineer and he achieved the International Ph.D. in "Processes, Materials and Construction Techniques" at University of Florence (IT) with the Technical University of Braunschweig (DE). He is also “honorary fellow” in the field of Architectural Drawing at University of Florence. He currently collaborate as a designer and BIM specialist for international architectural firms.
David Pellis is a PhD Candidate for the International PhD Course in "Civil and Environmental Engineering" held by University of Florence (IT) and Technical University of Braunschweig (DE). He is specialist in design, analysis and construction of complex shapes.