Contents lists available atScienceDirect
Talanta
journal homepage:www.elsevier.com/locate/talanta
Rapid and real-time detection of arginine enantiomers by QCM sensor
having a Calix[4]arene receptor bearing asymmetric centers
Farabi Temel
a,b, Serkan Erdemir
c, Egemen Ozcelik
a,b, Begum Tabakci
c, Mustafa Tabakci
a,b,∗ aKonya Technical University, Department of Chemical Engineering, 42130, Konya, TurkeybSelçuk University, Department of Chemical Engineering, 42130, Konya, Turkey cSelçuk University, Department of Chemistry, 42130, Konya, Turkey
A R T I C L E I N F O Keywords:
Arginine Calixarene Sensing
Quartz crystal microbalance Sensor
Amino acid
A B S T R A C T
This paper describes the sensing studies of a chiral calix[4]arene receptor (5) having (R)-2-phenylglycinol moiety for arginine enantiomers (D-/L-arginine) by using Quartz Crystal Microbalance (QCM) technique. The initial experiments have revealed that the chiral calix[4]arene 5 coated QCM (CCC-QCM) sensor showed good sensing for arginine enantiomers, such that it has exhibited higher sensing towards D-arginine than that of L-arginine. It has been determined that the sensitivity, limit of detection values of CCC-QCM sensor for the D-/L-arginine solutions as 0.024/0.023 Hz/μM and 0.38/1.29 μM, respectively. On the other hand, the racemic mixture studies were optimized using the response surface methodology with central composite design. Consequently, it has been demonstrated that the QCM sensor modification with a calix[4]arene receptor bearing asymmetric centers provided rapid, real-time, sensitive and effective sensing of arginine enantiomers.
1. Introduction
Amino acids which contain both amino (-NH2) and acid (-COOH) groups are known as one of the most common functional groups in chemistry [1]. Among the amino acids, arginine is the only amino acid molecule having a guanidino group [2]. Arginine plays an important role in the synthesis of creatine, glutamate, polyamines, proline, and NO [3]. Arginine has also some functions in the human body such as cardiovascular, immunological, and endocrine systems [1,3]. On the other hand, it is well known that all amino acids except glycine have chiral feature [4]. Designing and selection of useful analytical methods for recognizing amino acid enantiomers have importance in terms of treatment of metabolic diseases [5]. For the recognition of amino acids, some analytical methods such as HPLC [5,6], fluid chromatography [7], MS spectrometry [8], UV–vis [9], fluorescent [10,11], electrochemical [11],1H NMR [12], potentiometric [13] have been employed and de-veloped. However, usage of these kinds of equipment may have some disadvantages such as high time consuming, expensive analysis, high investment cost and required skilled personnel. Therefore, the sensor devices and methods such as acoustic systems draw attention for de-termination and sense of sensor material-analyte interaction in sensor applications [14]. In acoustic systems, QCM as bulk acoustic devices is useful methods due to its simplicity, cheapness and rapid detection of analytes in both dry and aqueous conditions at even low
concentrations. In literature, there are many studies about applications of QCM for biologic analytes such as carbohydrates, antibiotics, bac-teria, DNA [15–18]. The working principle of the QCM system depends on the relation between the mass of the adsorbed analyte and frequency shift of quartz oscillation. This relation as a mathematical equation can be expressed by the Sauerbrey equation which is defined as [19]:
=
f cf m (1)
where Δf is the change in fundamental frequency in Hz, Δm is observed mass change per unit area in g/cm2on quartz, C
fis the sensitivity factor of the crystal (56.6 Hz μ-1cm2for a 5 MHz AT-cut quartz crystal at room temperature).
One of the major class of supramolecular host systems among macrocyclic oligophenols is known as calixarenes which are formed of phenolic units linked through the ortho positions and have attracted much attention due to the simplicity of their preparation, unlimited chemical modification potential and a unique three-dimensional structure [20]. They are widely used for promising materials for sensor applications due to their sensing ability and sensitivity [21–23].
To the best of our knowledge, calixarenes have never been used as a sensor material for sensing of arginine enantiomers in QCM system. Hence, in this study, we considered that it would be interesting the preparation of a chiral calix[4]arene platform bearing amino alcohol asymmetric centers on its upper rim as a sensing film (Fig. 1) for the
https://doi.org/10.1016/j.talanta.2019.05.093
Received 20 February 2019; Received in revised form 17 May 2019; Accepted 22 May 2019
∗Corresponding author. Konya Technical University, Department of Chemical Engineering, 42130, Konya, Turkey.,
E-mail addresses:[email protected],[email protected](M. Tabakci).
Available online 28 May 2019
0039-9140/ © 2019 Elsevier B.V. All rights reserved.
sensing of arginine enantiomers on QCM crystal surface. Thus, we in-vestigated the sensing ability of this new QCM sensor coated with chiral calix[4]arene towards the D-/L-arginine methyl esters (Fig. 2).
Initial experiments clearly revealed that this new QCM sensor ex-hibited a good sensing ability towards arginine enantiomers. Moreover, the sensing of D-arginine was higher than that of L-arginine. This im-plies that QCM sensor coated with calix[4]arene having asymmetric moieties may provide chiral discrimination of arginine enantiomers. The subsequent studies were performed to elucidate the sensor prop-erties in detail. Limit of detection (LOD) [24] and sensitivity (S) of the sensor [25] were calculated from the analyte concentration studies. Langmuir and Freundlich isotherm models were also studied to eval-uate the sorption phenomena of arginine enantiomers on the sensor surface. On the other hand, the racemic mixture studies were optimized using the response surface methodology (RSM) with central composite
design (CCD). Hence, a series of statistical analysis such as analysis of variance (ANOVA) was carried out to check the accuracy of the fitted model for the racemic mixtures [26].
2. Experimental section
2.1. Reagents and instrumentation
A Stuart-SMP3 apparatus in a sealed capillary was performed to find out all melting points of the synthesized calix[4]arene compounds. For structural determination of all synthesized calix[4]arene compounds, the NMR spectra were recorded on a Varian 400 MHz instrument. FTIR spectroscopy analyses were performed on a PerkinElmer 100 ment. Elemental analysis was carried out on a Leco CHNS-932 instru-ment. Analytical TLC was performed due to monitor the reactions using precoated silica gel plates (SiO2Merck F254). All reagents using for the preparation of compounds and the sensing applications were standard analytical grade from Merck, Sigma-Aldrich, Fluka and used without further purification.
QCM 200 system manufactured by SRS was purchased for the sen-sing experiments in an aqueous media. Quartz crystals, AT-cut, with the resonance frequency 5 MHz oscillated. QCM crystals were cleaned in an Isolab ultrasonic bath. The sensor surface of QCM crystal after mod-ification by calixarene derivative was characterized by atomic force microscope (AFM) (NT-MDT, NTEGRA Spectra) and contact angle measurements (DSA 25, Krüss). The QCM crystals were modified by calixarene derivative by a spin coater (WS-400BZ-6NPP/LITE, Laurell Technologies Corporation). An ISM940E peristaltic pump from Ismatech (Wertheim, Germany) was used to transfer the solutions of arginine enantiomers on the sensor surface. All of the sensing experi-ments were performed in Labconco-5220120 glove box unit (Kansas City, MO, USA).
The experimental procedures for arginine racemic mixtures were optimized by using the response surface methodology (RSM) with central composite design (CCD). The statistic analyses were performed by Design-Expert 10.0.3 software-trial version (Stat-Ease, MN, USA).
2.2. Synthesis
The p-tert-butylcalix[4]arene (1) and its brominated derivative (2) were prepared according to the methods described in the literature, respectively [27,28]. Other calix[4]arene derivatives (3 and 4) and chiral calix[4]arene (5) were synthesized by using the procedures given below.
2.2.1. Compound 3
Compound 2 (1 g, 1.12 mmol) and thiourea (0.85 g, 11.20 mmol) in dry acetonitrile (100 mL) were stirred at reflux for a day. After that, KOH (0.89 g, 22.40 mmol) dissolved in deionized water (20 mL) was added in to the cooled reaction mixture. The mixture was stirred at room temperature for 2 h. After the reaction was completed, most of solvent was evaporated under reduced pressure. The remaining part was neutralized by 1 M HCl. The mixture was extracted by 2x40 mL CH2Cl2. The organic layer was dried over MgSO4and evaporated to give compound 3 (80%) as a white powder. mp: 190°C.1H-NMR (400 MHz,
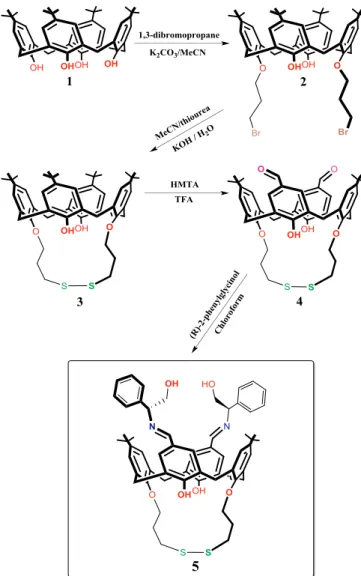
Fig. 1. Synthetic route of chiral calix[4]arene 5 receptor.
CDCl3): δ (ppm) 8.45 (s, 2H), 7.05 (s, 4H, ArH), 7.03 (s, 4H, ArH), 4.25 (d, 4H, J=13.1 Hz, ArCH2Ar), 4.11 (t, 4H, OCH2), 3.45 (m, 4H, CH2S), 3.39 (d, 4H, J=13.1 Hz, ArCH2Ar), 2.40 (brs, 4H, OCH2CH2CH2S), 1.26 (s, 18H, But), 1.15 (s, 18H, But).13C-NMR (CDCl
3, 100 MHz): δ (ppm) 28.43 (OCH2CH2CH2S), 30.51 (ArCH2Ar), 31.18, 31.68 (C(CH3)), 32.38 (OCH2CH2CH2S), 33.83, 34.19 (C(CH3)), 74.65 (OCH2CH2CH2S), 125.41 (ArC-m), 125.86 (ArC-o), 127.18 (ArC-m), 133.00 (ArC-o), 141.71, 147.38 (ArC-p), 149.33, 150.82 (ArC-O).
2.2.2. Compound 4
Compound 3 (1.0 g, 1.26 mmol) and hexamethylenetetramine (HMTA, 7.06 g, 50.40 mmol) were added in trifluoroacetic acid (TFA, 50 mL). The mixture was refluxed until running out of the starting material (compound 3) (TLC). Upon completion, the reaction mixture was cooled to room temperature and adding 1.0 M HCl (100 mL). Resulting mixture was extracted with dichloromethane (2x40 mL). The organic layer was washed with water three times and saturated brine once, and dried over MgSO4. Removing the solvent after filtration gave to compound 4 in 70% yield. mp:182°C [29]. 1H-NMR (400 MHz, CDCl3): δ (ppm) 9.77 (s, 2H), 9.47 (s, 2H), 7.63 (s, 4H, ArH), 7.04 (s, 4H, ArH), 4.22 (d, 4H, J=13.1 Hz, ArCH2Ar), 4.14 (t, 4H, OCH2), 3.53 (d, 4H, J=13.1 Hz, ArCH2Ar), 3.41 (t, 4H, CH2S), 2.42 (brs, 4H, OCH2CH2CH2S), 1.11 (s, 18H, But). 13C-NMR (CDCl3, 100 MHz): δ (ppm) 28.40 (OCH2CH2CH2S), 30.50 (ArCH2Ar), 31.22 (C(CH3), 31.87 (OCH2CH2CH2S), 34.33 (CCH3), 75.04 (OCH2CH2CH2S), 126.39
(ArC-m), 128.49, 128.90 (ArC-o),131.02 (ArC-(ArC-m), 131.72, 148.60 (ArC-p),
149.09, 159.50 (Ar-C-O), 190.94 (C]O).
2.2.3. Chiral calix[4]arene receptor 5
The synthesis of calix[4]arene receptor 5 was carried out as fol-lowing general procedure: (R)-(+)-2-phenylglycinol (3.38 mmol) were added to a solution of 4 (0.50 g, 0.68 mmol) dissolved in CH3Cl (20 mL). After the reaction mixtures were refluxed for 48 h in the pre-sence of MgSO4, they were filtered to remove MgSO4. The solvents were evaporated and the solid residues were recrystallized with CH3Cl/ MeOH to give as colorful crystals 5 in 58% yield. mp: 190-192oC;1 H-NMR (400 MHz, CDCl3): δ (ppm) 9.10 (s, 2H), 8.22 (s, 2H), 7.62 (d, 1H,
J=1.76 Hz, ArH), 7.22-7.44 (m, 13H, ArH, Ph), 7.09 (brs, 3H, ArH, Ph),
7.03 (d, 1H, J=2.15 Hz, ArH), 4.42 (dd, 2H, CHCH2OH), 4.27 (d, 2H,
J=13.1 Hz, ArCH2Ar), 4.18 (d, 2H, J=13.1 Hz, ArCH2Ar), 4.12 (t, 4H, OCH2), 3.86-3.96 (m, 4H, CH2OH), 3.49 (dd, 4H, J=13.1, 5.6 Hz, ArCH2Ar), 3.41 (brs, 4H, CH2S), 2.43 (brs, 4H, OCH2CH2CH2S), 0.98-1.26 (m, 18H, But). 13C-NMR (CDCl
3, 100 MHz): δ (ppm) 28.37 (OCH2CH2CH2S), 30.57, 31.13 (ArCH2Ar), 31.60 (C(CH3)), 32.05 (OCH2CH2CH2S), 34.22 (C(CH3)), 67.81 (CH2-OH), 75.00 (Ph(C)-), 75.61 (OCH2CH2CH2S), 125.92, 126.21 o), 126.37, 127.11
(PhC-p), 127.23, 127.45 (ArC-m), 127.67, 128.02 (ArC-o), 128.40, 128.45
(PhC-m), 128.75, 129.42 (ArC-m), 132.19 (ArC-o), 132.52 (ArC-p), 141.08 (PhC), 148.12 (ArC-p), 149.20, 156.09 (ArC-O), 162.74 (C]N).
2.3. Coating of the chiral calix[4]arene 5 on QCM crystal
A solution of chiral calix[4]arene receptor 5 was prepared as 1.0 mM in chloroform. The surface of the QCM crystal was cleaned in the ultrasonic bath by chloroform and distilled water (DW), respec-tively. After that, the crystal was dried by pure nitrogen. Baseline fre-quency of the bare QCM sensor was measured before coating with ca-lixarene. Then QCM crystal surface was coated with the 3 μL of calixarene solution in 3 mL of chloroform existed in a beaker by the soaking method and the solvent evaporated overnight. After evapora-tion of chloroform, the chiral calix[4]arene 5 coated QCM (CCC-QCM) sensor was obtained by resulting from the self-assembling of the mo-lecules on the QCM surface. The frequency of new QCM sensor was measured to specify the amount of deposited calixarene on crystal surface in every modification processes [30]. For the evaluation of the effect of coating methods on the sensing of arginine enantiomers, the spin coating and the drop casting methods were employed as well as the soaking method. For the fabrication of the QCM sensor by the spin coating method, the solution of calixarene (100 μL, 1 mM in chloro-form) was applied to QCM surface at 1000 rpm and 30 s. In case of the drop-casting method, the solution of calixarene (20 μL, 1 mM in chloroform) was applied to QCM surface, and then the solvent was remained to the evaporation at 60oC for 30 min in drying-oven.
2.4. Sensing assays of arginine enantiomers
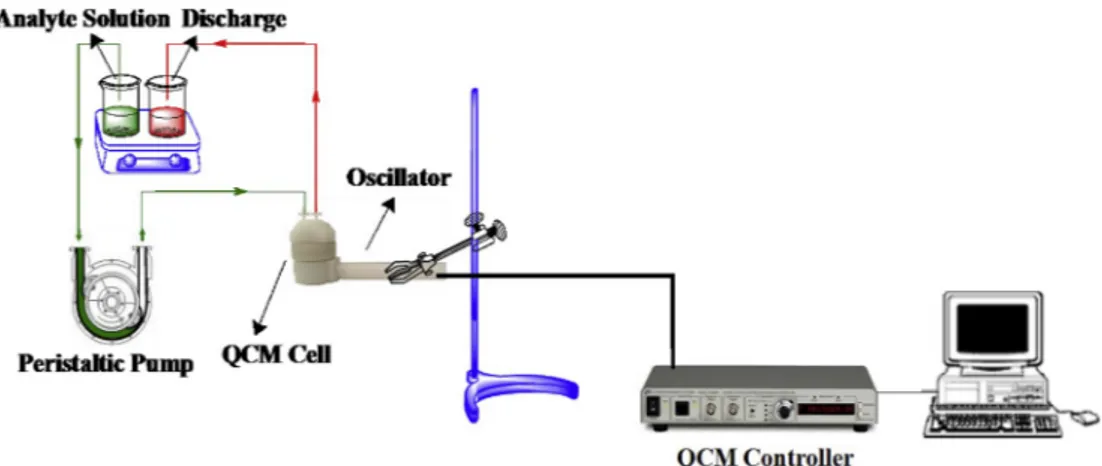
The sensing studies were performed according to the following procedure respectively. The CCC-QCM sensor was placed in the QCM holder which was mounted by QCM flow cell. DW was circulated in QCM flow cell by the peristaltic pump to keep the response at zero level for stabilization of sensors. 1000 μM of arginine enantiomer solutions were circulated in QCM flow cell by a peristaltic pump. The frequency changes of CCC-QCM sensor were monitored as a function of time continuingly during the circulation of arginine enantiomer solutions in the sensing system. A used home-made sensing system (Fig. 3) was given inFig. 3. It was observed that the resonance frequency decreased by the adsorption of arginine enantiomer molecules on CCC-QCM sensor surfaces. After sensing processes, sensor surfaces were subjected to DW to break down the interaction between chiral calix[4]arene and arginine enantiomer molecules. Desorption process was completed by returning the sensor response to the initial frequency level.
3. Results and discussion
3.1. Synthesis and characterization
In this study, the sensing abilities of a Schiff base functionalized calix[4]arene (5) having amino alcohol asymmetric site (Fig. 1) was investigated towards arginine enantiomers through the QCM method. The structural analysis was carried out by a combination of FT-IR,1H, and13C NMR spectroscopy. Calix[4]ærene derivatives 1 and 2 were synthesized according to previous literature methods [27,28], and then 2 was reacted with thiourea in dry acetonitrile to give 3 in 80% yield. The structure of 3 was confirmed by the appearance proton and carbon peaks of CH2S-S at δ 3.45 and δ 32.38 ppm in the 1H and13C NMR spectra, respectively (please see supplementary data,Figs. S1 and S2). Compound 3 was converted to its aldehyde derivative 4 in 70% yields by using hexamethylenetetramine in trifluoroacetic acid. The formation of 4 was confirmed by the appearance of the characteristic aldehyde C]O band at about 1682 cm-1in its FT-IR spectra (please see supple-mentary data,Fig. S3) and by the appearance of aldehyde proton and carbon peaks (HC]O) at δ 9.77 and δ 190.94 ppm in the1H and13C NMR spectra, respectively (please see supplementary data,Figs. S4 and S5). The reaction of compound 4 with (R)-(+)-2-phenylglycinol in chloroform gave the chiral calix[4]arene receptor 5 in 58% yield. Its structure was confirmed by the appearance of Schiff base (HC]N) proton at δ 8.22 ppm and Schiff base (HC]N) carbon at δ 156.09 ppm, and by the disappearance of proton and carbon peaks belongs to al-dehyde group at δ 9.77 and δ 190.94 ppm in1H and13C NMR spectrum of 4, respectively (please see supplementary data,Figs. S6 and S7).
3.2. Real time sensing studies of arginine enantiomers
Initially, the QCM crystal surface was coated with chiral calix[4] arene receptor 5 by the soaking method. In this step, disulfide moiety of calixarene can be strongly adsorbed on the gold surface to afford stable and ordered layer due to the covalent bond formation between gold and sulfur [31,32]. So, the new QCM sensor was used in sensing studies of the arginine enantiomers. It was recorded the frequency changes versus time when analyte enantiomers were injected into the system to in-teract with chiral calix[4]arene receptor on the QCM surface. The fre-quency changes of the CCC-QCM sensor towards arginine enantiomers were given inFig. 4andFig. 5, respectively.
As it is seen inFigs. 4and5, remarkable sensing for arginine en-antiomers was observed by CCC-QCM sensor. After completing of the sensing progress, the DW was injected into the system for desorption of arginine enantiomers on the sensor surface. Hence, the desorption process was successfully performed by DW without need any desorption
agent. The completing of desorption was rapid and easy as well as sensing process. Additionally, the fact that the sensor gave close re-sponses towards both enantiomers indicated that there was weak en-antioselectivity. It is considered that this case could result from the guanidino moiety of arginine. So, the guanidino moieties on arginine structure seem to be more dominant than the chiral amino group in terms of hydrogen bond interactions. Accordingly, it can contribute to the more interaction with asymmetric sites of the calix[4]arene based receptor 5 [33]. Although it is not high, the slight difference in re-cognition ability of calix[4]arene based receptor 5 for arginine
Fig. 4. Frequency changes of the CCC-QCM sensor towards D-arginine during
adsorption and desorption processes ([Arginine]:1000 μM).
Fig. 5. Frequency changes of the CCC-QCM sensor towards L-arginine during
adsorption and desorption processes ([Arginine]:1000 μM).
Fig. 6. Graphical presentation of interactions between moieties of the sensible
film layer and analyte molecules.
Fig. 7. Calibration curve of the CCC-QCM sensor towards arginine enantiomer
enantiomers may be explained with the size-fit concept, three-dimen-sional structures of molecules, steric effects and interactions between moieties of the sensible film layer and analyte molecules such as hy-drogen bonding interactions inFig. 6[34,35].
In further experiments, the CCC-QCM sensor was tested in arginine enantiomer solutions having different concentrations (50, 100, 250, 500 and 1000 μM) (for the results, please see supplementary data,Figs. S8 and S9). Additionally, the calibration curves of frequency changes towards each arginine solution were also given inFig. 7. Both responses of the CCC-QCM sensor increased by increasing arginine concentration. It was also noticed that the differences in responses towards arginine enantiomer solutions which have the same concentration increased dramatically beginning from 500 μM arginine concentration. It may result from weaker interactions between the CCC-QCM sensor and ar-ginine enantiomers due to low analyte concentrations [36–38]. Sensor sensitivity (S) can be easily determined from the slope of calibration curves which are drawn the frequency changes of sensor versus arginine solutions having different concentrations (in units of Hz/μM) [25]. Limit of detection (LOD) of the CCC-QCM sensor for arginine en-antiomers was calculated using a linear range of calibration curves of Fig. 7and Eq.(2)[24]:
= LOD xS
m
3 bl
(2) where Sblis the standard deviation of the response, m is the slope of the calibration curve. Hence, all calculated sensing parameters such as S and LOD were listed in Table 1. Additionally, all experiments were performed at least three times. Although there were little differences in the frequency response of the sensor towards all analyte concentrations, these differences were specified by an error bar inFig. 7. Thus, statis-tical significance was evaluated for both chiral analytes and given also in Table 1. As it seen inTable 1, the significance F is less than 0.05 indicated that the model terms are significant [39]. Detection limits of the CCC-QCM sensor towards arginine enantiomers can be quite com-parable with all type of sensors in the literature [40].
3.3. Adsorption evaluation of arginine sensing
We have evaluated the sensing process of CCC-QCM sensor towards arginine enantiomers in terms of adsorption phenomena. The adsorp-tion phenomena were described by many adsorpadsorp-tion models in the literature. Among the models, Langmuir and Freundlich have been widely used to evaluate adsorption phenomena.
Langmuir isotherm is represented by the Eq.(3)[41]:
= +
C qe/ e (1/q b0 ) ( / )C qe 0 (3)
where Ceis the solution concentration (mg L−1) at equilibrium, qeis the adsorption capacity (mg mg−1) at equilibrium, q
0 indicates the
maximum adsorption capacity (mg mg−1) and b is a Langmuir isotherm constant related to the adsorption energy (L mmol−1). The linear plot of
Ce/qe versus Ce values for the sensing of arginine enantiomers was plotted and given in Fig. S8. The results showed that there was ap-preciable linearity. For this reason, the adsorption process follows Langmuir adsorption isotherm (please see supplementary data, Fig. S11). q0and b can be obtained by the slope and intercept, respectively and were given inTable 2. The maximum adsorption capacity of CCC-QCM sensor towards arginine enantiomers was comparable with other adsorbents in the literature [42–44].
Langmuir isotherm can be classified by a term “RL” a dimensionless constant separation factor to determine whether the adsorption pro-cesses of arginine enantiomers by the QCM sensor are favorable or not, which is defined by the Eq.(4)[45]:
= +
RL 1/(1 bC0) (4)
where b is Langmuir constant related to the energy of adsorption (L mmol−1). The value of R
Lindicates the shape of the isotherms as un-favorable (RL> 1), linear; (RL= 1), favorable (0 < RL< 1), irrever-sible (RL= 0). The estimated values of RLfor the different initial argi-nine enantiomer solutions (from 50 to 1000) were given inTable 2. According to the results, the RLvalues in the between 0 and 1 indicated that sensing of arginine enantiomers by the QCM sensor was favorable. Interactions between arginine enantiomers and the CCC-QCM sensor were also examined by Freundlich isotherm. Linearized Freundlich isotherm equation was given by the Eqn.(5)[46]:
= +
logqe logKf (1/ )n logCe (5)
where Kfis the Freundlich isotherm constant and 1/n is Freundlich exponent. The linear plot of log qeversus log Cevalues for the sensing of arginine enantiomers was plotted (please see supplementary data,Fig. S12). The Kfand n values were estimated by the intercept and slope of this plot and given in Table 2. Given R2values indicated that both Langmuir and Freundlich models can be selected to describe the ad-sorption of arginine enantiomers on the CCC-QCM sensor.
3.4. Effect of calixarene content on the sensor
We have also studied the effect of calixarene contents on sensing of arginine enantiomers. Accordingly, the calixarene solutions in various concentrations were used to prepare a series of CCC-QCM sensors in-cluding various calixarene contents on the QCM surface. These CCC-QCM sensors were used towards arginine enantiomers (for the results please see supplementary data, Fig. S10). The monitoring of an al-teration at the responses by the changing of calixarene contents on the CCC-QCM sensor revealed that the calixarene contents played an im-portant role in the sensing process. Although the calixarene contents on the CCC-QCM sensor were increased, the responses of CCC-QCM sensor were decreased gradually. Herein, it has been considered that the de-crease at responses may be resulted from overlapping of calixarene 5 molecules on the CCC-QCM sensor.
3.5. Effect of the modification method
The spin coating and the drop casting methods were employed to observe the effect of coating methods on sensing of arginine en-antiomers as well as the soaking method. The coating of calixarene 5 by each coating methods onto the QCM surface was given previously. After
Table 1
LOD and S values of the CCC-QCM sensor by soaking method towards arginine enantiomers.
Enantiomers LOD (μM) S (Hz/μM) Linear Range Significance F
D-Arginine 0.38 0.024 50-500 μM (R2=0.999, y=0.024x-0.197) 5.5x10⁻¹⁶
L-Arginine 1.29 0.023 50-1000 μM (R2=0.999, y=0.023x-0.075) 4.1x10⁻¹⁹
Table 2
Langmuir and Freundlich isotherm constants for adsorption of arginine en-antiomers.
Enantiomers Langmuir Freundlich
q0(mg/g) b (L/ mmol) R 2 R L Kf n R2 D-Arginine 559.91 0.370 0.998 0 < RL< 1 0.578 1.069 1.000 L-Arginine 347.34 0.689 0.996 0 < RL< 1 1.222 1.130 0.999
QCM surface modification by soaking, spin coating and drop casting methods, the amount of calixarene 5 on CCC-QCM sensors was de-termined as 71, 72 and 77 Hz, respectively. Herein, the amount of ca-lixarene 5 on CCC-QCM sensors was tried to be kept approximately equal for a good comparison. For the evidence to the coating of calix-arene 5 on CCC-QCM sensors, the contact angles of CCC-QCM sensors were measured. As it seen inFig. 8, the contact angles of bare crystal surface and the CCC-QCM sensor surfaces by soaking, spin coating and drop casting methods were measured as 68o, 91.8o, 82.7o,and 77.6o, respectively. As it is well known, the surface can be grouped due to its high (θ«90o) and low (θ»90o) wettability property [47]. Hence, the increases at contact angle values due to the hydrophobic moieties of calix[4]arene molecules can clearly demonstrate that calixarene 5 was successfully deposited onto the QCM surface by all modification tech-niques.
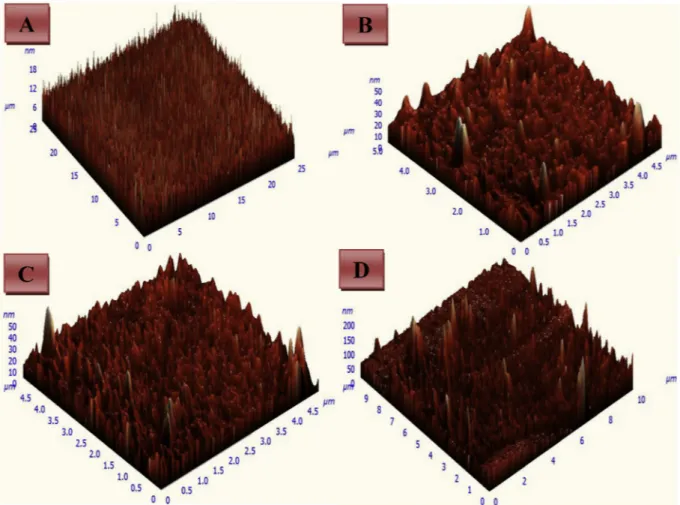
AFM images of the CCC-QCM sensors were given to evaluate the changes at their surface morphologies after deposition. AFM images of bare crystal surface and the CCC-QCM sensors by soaking, spin coating and drop casting methods were given inFig. 9, respectively. However, it was monitored that some large peaks occurred on the QCM surfaces after the coating by each method although the bare crystal surface was observed as smooth (inFig. 9A). Indeed, the CCC-QCM sensors having different surface morphologies were obtained from each coating methods. Therefore, the surface obtained by the soaking method (in Fig. 9B) has some large peaks which have different height and wide-ness. It indicated that calixarene 5 molecules may have been irregularly dispersed on the QCM surface or overlapped each other. In the case of spin coating, the surface of CCC-QCM sensor (inFig. 9C) was smooth locally. This indicates that the calixarene 5 molecules can be scattered on CCC-QCM sensor surface coequally but there are some gaps locally. In the case of the drop-casting method, the surface of CCC-QCM sensor
(inFig. 9D) had no uniform morphology. There were some height and large peaks in several regions of the surface.
3.6. Reproducibility and durability of the sensor
It is well known that the reproducibility and the durability of a sensor are known as fundamental parameters in sensing studies. To investigate the reproducibility of CCC-QCM sensor (109 Hz, by soaking method), it was exposed to solutions of arginine enantiomers at least five times, and the recording frequency changes were given inFig. 10 andFig. 11, respectively. After every adsorption progress, desorption processes were performed via DW. The results showed that the differ-ences in the responses of the QCM sensor remained almost constant after each process. This demonstrated that the CCC-QCM sensor showed a superior reproducibility in sensing of arginine enantiomers.
To measure the durability of CCC-QCM sensor, frequency changes were recorded after the QCM sensor exposed to a solution of each ar-ginine enantiomer in different time intervals. The results (Fig. 12) showed that there was not observed a significant difference in existent frequency changes of arginine enantiomers during 1.5 months. After this time, the frequency changes of the QCM sensor were decreased proportionally to time due to its durability. This result implied the fact that the CCC-QCM sensor can be useful for a long time in the sensing of arginine enantiomers.
3.7. Racemic mixtures assay
Arginine racemic mixtures were investigated by the response sur-face methodology (RSM) to optimize the two parameters such as vo-lume fraction of D-enantiomer in a racemic mixture, the concentration of the racemic mixture. Selected parameters independent variables
Fig. 8. Contact angle images of (A) bare gold surface, the CCC-QCM sensors by (B) soaking, (C) spin coating, (D) drop casting. (For interpretation of the references to
were symbolized as A and B, respectively. The responses of CCC-QCM sensor towards racemic mixtures were specified as the predicted vari-able. A three-factor such as stirring rate, temperature and circulation rate of racemic mixtures were held constant. The level of independent variables was given in Table 3. Central composite design (CCD) was employed by 11 experiments which have three runs at the center points to specify the effect of the two independent variables. The responses of the CCC-QCM sensor towards racemic mixtures under various experi-mental conditions were shown inTable 4. Hence, a series of statistical analysis as an analysis of variance (ANOVA) was examined to check the accuracy of the fitted model. A statistical model developing between
responses of the CCC-QCM sensor towards racemic mixtures and var-ious experimental conditions were achieved via response surface quadratic model fitting method by Design-Expert software according to the following equations:
= + + + +
dF 18.06 0.68A 10.18B 0.85AB 7.895 10x 3 2A 1.61B2 (6)
where dF is the frequency changes of the sensor, A and B are in-dependent variables which are mentioned above.Table 4showed also predicted results for frequency changes of the sensor towards racemic mixtures according to Eqn.(6).
Fig. 9. AFM images of (A) bare gold surface, the CCC-QCM sensors by (B) soaking, (C) spin coating, (D) drop casting. (For interpretation of the references to color in
this figure legend, the reader is referred to the Web version of this article.)
Fig. 10. The reproducibility test of CCC-QCM sensor towards D-arginine
([Arginine]:1000 μM). Fig. 11. The reproducibility test of CCC-QCM sensor QCM sensor towards L-arginine ([Arginine]:1000 μM).
A quadratic model was suggested for racemic mixtures inTable 5. Moreover, ANOVA results for the response surface quadratic model at the sensing of racemic mixtures were shown inTable 6. Herein, F-value of 6790.41 implied that the model was significant for responses of the QCM sensor towards racemic mixtures. Adequate precision indicates a signal to noise ratio; a value greater than four is acceptable [48,49]. As it seen inTable 6, it was greater than four. The p-value (Prob > F) is less than 0.05 indicated that the model terms are significant [39].
Furthermore, the lack of fit F value of 8.68 implied to significance for the sensing of racemic mixtures. The low coefficients of variation (CV
%) indicated high precise the estimate and reliability of the experiment
[50].
Moreover, the “Pred. R2” of 0.9990 is close to “Adj. R2” of 0.9997 which indicates that they are reasonable agreement due to difference less than 0.2. Such a close agreement implied good predictability of the model [50,51]. The experimental (actual) and the predicted values were in good agreement to study the correlation between them. The internally studentized residuals and normal probability plots for re-sponses of the QCM sensor towards racemic mixtures were obtained, and the points follow a straight line which indicated that errors were distributed normally (please see supplementary data,Figs. S13A and S13B) [52,53].
The 3D surface graph which is curvilinear due to the quadratic model and contour for the response surface were shown inFig. 13. The plots show the relationship between the volume fraction of D-en-antiomer in a racemic mixture (D:L) and the concentration of racemic mixture (C (μM)). The 3D surface and contour plot described the effect of parameters on sensor response. Volume fractions of D-enantiomer in racemic mixture and concentrations of racemic mixtures were im-portant factors. Responses of the QCM sensor towards racemic mixtures increased due to an increase at a concentration of racemic mixtures at constant D:L values.Fig. 13A and B indicated also that responses of the QCM sensor towards racemic mixtures in each concentration remained between responses of the QCM sensor towards D- and L-enantiomer, individually. Moreover, responses towards D-enantiomer increased better gradually than that of L-enantiomer. Indeed, it was understood that differences on responses increased by an increase at a concentra-tion of racemic mixtures. Consequently, the racemic mixture studies indicated that the CCC-QCM sensor can be useful for enantioselective recognition of the arginine enantiomers.
4. Conclusion
In the present study, a Schiff base functionalized calix[4]arene re-ceptor bearing amino alcohol asymmetric site as a sensor material was successfully deposited on the QCM surface. Hence, it was fabricated the chiral calix[4]arene coated QCM sensor (CCC-QCM) for the sensing of arginine enantiomers. The CCC-QCM sensor gave a good response to the arginine enantiomers. However, there was a little difference in sensing values between arginine enantiomers. It was considered that size-fit concept, three-dimensional structures of molecules, steric effects and interactions between moieties of the sensible film layer and analyte molecules such as hydrogen bonding interactions may play a major role on this difference. In further experiments, the sensing ability of the CCC-QCM sensor was investigated towards various concentrations of arginine enantiomers. It has been determined that the sensitivities are 0.024 and 0.023 Hz/μM, and the limit of detection are 0.38 and 1.29 μM, respectively. Additionally, the racemic mixture studies re-vealed that the enantioselective recognition of arginine enantiomers was achieved by the CCC-QCM sensor. Thus, it was produced a new QCM sensor for arginine enantiomers having outstanding properties
Fig. 12. The durability test of CCC-QCM sensor towards arginine enantiomers
([Arginine]:1000 μM).
Table 3
Independent variables and level for a frequency change of the CCC-QCM sensor. Independent Variables Unit Symbol Level
-1 0 1
Volume fraction of D-enantiomer in racemic
mixture - A 0.0 0.5 1.0
Conc. of racemic mixture μM B 250 625 1000
Table 4
Predictive and experimental results in terms of CCD.
Run Experimental conditions Frequency changes of 5 modified QCM sensor (Hz) A B (μM) Experimental Predicted %Error
1 0.5 250 6.20 6.31 1.77 2 0.5 625 18.10 18.06 0.22 3 0.5 1000 26.50 26.61 0.42 4 0.5 625 18.20 18.06 0.77 5 1.0 250 6.10 6.05 0.82 6 0.0 1000 25.20 25.15 0.20 7 0.0 625 17.20 17.31 0.64 8 1.0 625 18.70 18.81 0.59 9 1.0 1000 28.20 28.15 0.18 10 0.0 250 6.50 6.45 0.77 11 0.5 625 18.10 18.06 0.22 Table 5
Sequential model sum of squares.
Source Sum of squares Degrees of freedom Mean square F Value p Value Remark
Mean vs Total 3247.36 1 3247.36 - -
-Linear vs Mean 625.00 2 312.50 248.68 < 0.0001
-2FIavs Linear 2.89 1 2.89 2.82 0.1367
-Quadratic vs 2FIa 7.07 2 3.53 189.01 < 0.0001 Suggested
Cubic vs Quadratic 0.017 2 8.333x10⁻³ 0.33 0.7449
-Residual 0.077 3 0.026 - -
-Total 3882.42 11 352.95 - -
such as rapid, real-time, sensitive, effective detection, durable and ea-sily recoverable with DW.
Acknowledgments
We thank the Scientific and Technological Research Council of Turkey (TÜBİTAK-Grant Number 115Z249) and the Research Foundation of the Selçuk University (SUBAP-Grant Number 16401003), Konya, Turkey and for financial support of this work produced from Farabi Temel's Ph.D. Thesis.
Appendix A. Supplementary data
Supplementary data to this article can be found online athttps:// doi.org/10.1016/j.talanta.2019.05.093.
References
[1] G. Wu, Amino acids: metabolism, functions, and nutrition, Amino Acids 37 (2009) 1–17.
[2] S. Khezri, M. Bahram, N. Samadi, A dual-mode nanosensor based on the inner filter effect of gold nanoparticles on the fluorescence of CdS quantum dots for sensitive detection of arginine, Anal. Methods 9 (2017) 6513–6524.
[3] G. Liu, L. Xiao, W. Cao, T. Fang, G. Jia, X. Chen, H. Zhao, C. Wu, J. Wang, Changes in the metabolome of rats after exposure to arginine and N-carbamylglutamate in combination with diquat, a compound that causes oxidative stress, assessed by 1H NMR spectroscopy, Food & Function 7 (2016) 964–974.
[4] D.G. Morris, Stereochemistry, Royal Society of Chemistry, 2001.
[5] Q. Bi, S. Dong, Y. Sun, X. Lu, L. Zhao, An electrochemical sensor based on cellulose nanocrystal for the enantioselective discrimination of chiral amino acids, Anal. Biochem. 508 (2016) 50–57.
[6] I. Ilisz, A. Péter, W. Lindner, State-of-the-art enantioseparations of natural and unnatural amino acids by high-performance liquid chromatography, Trac. Trends
Anal. Chem. 81 (2016) 11–22.
[7] L. Sánchez-Hernández, J.L. Bernal, M.J.d. Nozal, L. Toribio, Chiral analysis of aromatic amino acids in food supplements using subcritical fluid chromatography and Chirobiotic T2 column, J. Supercrit. Fluids 107 (2016) 519–525.
Yu and Yao, 2017 X. Yu, Z.-P. Yao, Chiral differentiation of amino acids through bi-nuclear copper bound tetramers by ion mobility mass spectrometry, Anal. Chim. Acta. 981 (2017) 70–92.
[9] M. Tabakcı, B. Tabakcı, M. Yılmaz, Design and synthesis of new chiral calix[4] arenes as liquid phase extraction agents for amino acid methylesters and chiral α-amines, J. Inclusion Phenom. Macrocycl. Chem. 53 (2005) 51–56.
[10] S. Erdemir, Synthesis of novel chiral schiff base and amino alcohol derivatives of calix[4]arene and chiral recognition properties, J. Mol. Struct. 1007 (2012) 235–241.
Zhang et al., 2017 X. Zhang, S. Chen, P. Xu, Q. Yu, Z. Dai, Synthesis of new chiral fluorescent sensors and their applications in enantioselective dis-crimination, Tetrahedron Lett. 58 (2017) 2850–2855.
[12] G. Gao, C. Lv, Q. Li, L. Ai, J. Zhang, Enantiomeric discrimination of α-hydroxy acids and N-Ts-α-amino acids by 1H NMR spectroscopy, Tetrahedron Lett. 56 (2015) 6742–6746.
[13] X. Yin, J. Ding, S. Zhang, J. Kong, Enantioselective sensing of chiral amino acids by potentiometric sensors based on optical active polyaniline films, Biosens. Bioelectron. 21 (2006) 2184–2187.
[14] Y.Q. Fu, J.K. Luo, N.T. Nguyen, A.J. Walton, A.J. Flewitt, X.T. Zu, Y. Li, G. McHale, A. Matthews, E. Iborra, H. Du, W.I. Milne, Advances in piezoelectric thin films for acoustic biosensors, acoustofluidics and lab-on-chip applications, Prog. Mater. Sci. 89 (2017) 31–91.
[15] R.-Z. Hao, H.-B. Song, G.-M. Zuo, R.-F. Yang, H.-P. Wei, D.-B. Wang, Z.-Q. Cui, Z. Zhang, Z.-X. Cheng, X.-E. Zhang, DNA probe functionalized QCM biosensor based on gold nanoparticle amplification for Bacillus anthracis detection, Biosens. Bioelectron. 26 (2011) 3398–3404.
[16] P. Jearanaikoon, P. Prakrankamanant, C. Leelayuwat, S. Wanram, T. Limpaiboon, C. Promptmas, The evaluation of loop-mediated isothermal amplification-quartz crystal microbalance (LAMP-QCM) biosensor as a real-time measurement of HPV16 DNA, J. Virol Methods 229 (2016) 8–11.
[17] N. Karaseva, T. Ermolaeva, B. Mizaikoff, Piezoelectric sensors using molecularly imprinted nanospheres for the detection of antibiotics, Sensor. Actuator. B Chem. 225 (2016) 199–208.
[18] Z. Pei, J. Saint-Guirons, C. Käck, B. Ingemarsson, T. Aastrup, Real-time analysis of the carbohydrates on cell surfaces using a QCM biosensor: a lectin-based approach,
Fig. 13. (A) 3D surface, (B) contour plots for the frequency change of CCC-QCM sensor towards arginine racemic mixtures. Table 6
ANOVA results for response surface quadratic model.a
Source Sum of squares Degrees of freedom Mean square F Value p Value Remark
Model 634.96 5 126.99 6790.41 < 0.0001 significant
Residual 0.094 5 0.019 - -
-Lack of Fit 0.087 3 0.029 8.68 0.1050 not significant
Pure Error 6.667x10⁻³ 2 3.333x10⁻³ - -
-a R2= 0.9999; R2
Biosens. Bioelectron. 35 (2012) 200–205. [19] G. Sauerbrey, Phys. Verhandl. 8 (1957) 113.
[20] A. Yılmaz, B. Tabakcı, M. Tabakcı, New diamino derivatives ofp-tert-butylcalix[4] arene for oxyanion recognition: synthesis and complexation studies, Supramol. Chem. 21 (2009) 435–441.
[21] K.V. Kostyukevych, R.V. Khristosenko, A.S. Pavluchenko, A.A. Vakhula, Z.I. Kazantseva, I.A. Koshets, Y.M. Shirshov, A nanostructural model of ethanol adsorption in thin calixarene films, Sensor. Actuator. B Chem. 223 (2016) 470–480. [22] G.-P. Nikoleli, D.P. Nikolelis, G. Evtugyn, T. Hianik, Advances in lipid film based
biosensors, Trac. Trends Anal. Chem. 79 (2016) 210–221.
[23] F. Temel, E. Özçelik, A.G. Türe, M. Tabakcı, Sensing abilities of functionalized calix [4]arene coated QCM sensors towards volatile organic compounds in aqueous media, Appl. Surf. Sci. 412 (2017) 238–251.
[24] G.L. Long, J.D. Winefordner, Limit of detection a closer look at the IUPAC defini-tion, Anal. Chem. 55 (1983) 712A–724A.
[25] I.A. Koshets, Z.I. Kazantseva, A.E. Belyaev, V.I. Kalchenko, Sensitivity of re-sorcinarene films towards aliphatic alcohols, Sensor. Actuator. B Chem. 140 (2009) 104–108.
[26] R. Meng, J. Kang, Determination of the stereoisomeric impurities of sitafloxacin by capillary electrophoresis with dual chiral additives, J. Chromatogr. A 1506 (2017) 120–127.
[27] C.D. Gutsche, B. Dhawan, K.H. No, R. Muthukrishnan, Calixarenes. 4. The synthesis, characterization, and properties of the calixarenes from p-tert-butylphenol, J. Am. Chem. Soc. 103 (1981) 3782–3792.
[28] Z.-T. Li, G.-Z. Ji, C.-X. Zhao, S.-D. Yuan, H. Ding, C. Huang, A.-L. Du, M. Wei, Self-assembling calix[4]arene [2]catenanes. Preorganization, conformation, selectivity, and efficiency, J. Org. Chem. 64 (1999) 3572–3584.
[29] H.M. Chawla, N. Pant, B. Srivastava, S. Upreti, Convenient direct synthesis of bis-formylated calix[4]arenes via ipso substitution, Org. Lett. 8 (2006) 2237–2240. [30] V.I. Kalchenko, I.A. Koshets, E.P. Matsas, O.N. Kopylov, A. Solovyov,
Z.I. Kazantseva, Y.U.M. Shirshov, Calixarene-based QCM Sensors Array and its Response to Volatile Organic Vapours, (2002).
[31] H. Häkkinen, The gold–sulfur interface at the nanoscale, Nat. Chem. 4 (2012) 443. [32] W.C. Su, W.G. Zhang, S. Zhang, J. Fan, X. Yin, M.L. Luo, S.C. Ng, A novel strategy
for rapid real-time chiral discrimination of enantiomers using serum albumin functionalized QCM biosensor, Biosens. Bioelectron. 25 (2009) 488–492. [33] K.-x. Xu, H.-j. Kong, F.-l. Zu, L. Yang, C.-j. Wang, A pair of chiral fluorescent sensors
for enantioselective recognition of mandelate in water, Spectrochim. Acta Mol. Biomol. Spectrosc. 118 (2014) 811–815.
[34] F.N. Memon, S. Memon, Sorption and desorption of basic dyes from industrial wastewater using calix[4]arene based impregnated material, Separ. Sci. Technol. 50 (2014) 1135–1146.
[35] L. Mutihac, J.H. Lee, J.S. Kim, J. Vicens, Recognition of amino acids by functio-nalized calixarenes, Chem. Soc. Rev. 40 (2011) 2777–2796.
[36] Y. Wang, X. Zhou, C. Xu, Y. Jin, B. Li, Gold nanorods as visual sensing platform for chiral recognition with naked eyes, Sci. Rep. 8 (2018) 5296.
[37] R. Li, C. Zhu, W. Li, X. Zhang, Y. Ji, A new nanosensor for the chiral recognition of
cysteine enantiomers based on gold nanorods, New J. Chem. 42 (2018) 12706–12710.
[38] H.-S. Guo, J.-M. Kim, S.-J. Kim, S.-M. Chang, W.-S. Kim, Versatile method for chiral recognition by the quartz crystal microbalance: chiral mandelic acid as the detec-tion model, Langmuir 25 (2009) 648–652.
[39] B.K. Körbahti, A. Tanyolaç, Electrochemical treatment of simulated textile waste-water with industrial components and Levafix Blue CA reactive dye: optimization through response surface methodology, J. Hazard Mater. 151 (2008) 422–431. [40] N. Verma, A.K. Singh, M. Singh, L-arginine biosensors: a comprehensive review,
Biochemistry and Biophysics Reports 12 (2017) 228–239.
[41] W.J. Weber, Physicochemical Processes for Water Quality Control, Wiley-Interscience, 1972.
[42] M. Liu, J. Huang, Y. Deng, Adsorption behaviors of l-arginine from aqueous solu-tions on a spherical cellulose adsorbent containing the sulfonic group, Bioresour. Technol. 98 (2007) 1144–1148.
[43] J.E. Krohn, M. Tsapatsis, Phenylalanine and arginine adsorption in zeolites X, Y, and β, Langmuir 22 (2006) 9350–9356.
[44] Q. Gao, W. Xu, Y. Xu, D. Wu, Y. Sun, F. Deng, W. Shen, Amino acid adsorption on mesoporous Materials: influence of types of amino acids, modification of meso-porous materials, and solution conditions, J. Phys. Chem. B 112 (2008) 2261–2267. [45] O. Hamdaoui, Dynamic sorption of methylene blue by cedar sawdust and crushed
brick in fixed bed columns, J. Hazard Mater. 138 (2006) 293–303.
[46] M. Rao, A.V. Parwate, A.G. Bhole, Removal of Cr6+and Ni2+from aqueous solution using bagasse and fly ash, Waste Manag. 22 (2002) 821–830.
[47] Y. Yuan, T.R. Lee, Contact angle and wetting properties, in: G. Bracco, B. Holst (Eds.), Surface Science Techniques, Springer Berlin Heidelberg, Berlin, Heidelberg, 2013, pp. 3–34.
[48] S. Mannan, A. Fakhru'l-Razi, M.Z. Alam, Optimization of process parameters for the bioconversion of activated sludge by Penicillium corylophilum, using response surface methodology, J. Environ. Sci. 19 (2007) 23–28.
[49] M.Y. Noordin, V.C. Venkatesh, S. Sharif, S. Elting, A. Abdullah, Application of re-sponse surface methodology in describing the performance of coated carbide tools when turning AISI 1045 steel, J. Mater. Process. Technol. 145 (2004) 46–58. [50] M. Amini, H. Younesi, N. Bahramifar, A.A.Z. Lorestani, F. Ghorbani, A. Daneshi,
M. Sharifzadeh, Application of response surface methodology for optimization of lead biosorption in an aqueous solution by Aspergillus Niger, J. Hazard Mater. 154 (2008) 694–702.
[51] J.P. Silva, S. Sousa, I. Gonçalves, J.J. Porter, S. Ferreira-Dias, Modelling adsorption of acid orange 7 dye in aqueous solutions to spent brewery grains, Separ. Purif. Technol. 40 (2004) 163–170.
[52] K. Lee, S. Hamid, Simple response surface methodology: investigation on advance photocatalytic oxidation of 4-chlorophenoxyacetic acid using UV-active ZnO pho-tocatalyst, Materials 8 (2015) 339–354.
[53] A. Asfaram, M. Ghaedi, A. Goudarzi, M. Rajabi, Response surface methodology approach for optimization of simultaneous dye and metal ion ultrasound-assisted adsorption onto Mn doped Fe3O4-NPs loaded on AC: kinetic and isothermal studies, Dalton Trans. 44 (2015) 14707–14723.
![Fig. 4. Frequency changes of the CCC-QCM sensor towards D-arginine during adsorption and desorption processes ([Arginine]:1000 μM).](https://thumb-eu.123doks.com/thumbv2/9libnet/4977943.100930/4.892.460.833.86.321/frequency-changes-sensor-arginine-adsorption-desorption-processes-arginine.webp)