Photoluminescence and piezoelectricity investigation of
La
1.98Nd
0.02Ti
2O
7, Sm
1.98Ce
0.02Ti
2O
7and Er
1.98Gd
0.02Ti
2O
7multifunctional materials
ESRAÖZTÜRK∗, EBRUSARILMAZKaramano˘glu Mehmetbey University, Faculty of Engineering, Department of Metallurgy and Materials Engineering, Karaman, Turkey
Nd3+ doped La2Ti2O7, Ce4+ doped Sm2Ti2O7 and Gd3+ doped Er2Ti2O7have been synthesized at different reaction
temperatures using solid state reaction method, and characterized using X-ray diffraction (XRD), scanning electron microscopy (SEM), differential thermal analysis (DTA), thermogravimetric analysis (TG). Excitation spectra, emission spectra and decay time curves of the samples were investigated by photoluminescence spectrophotometer (PL) and typical transitions of rare earth ions were observed. Dielectric properties, piezoelectric properties and Curie temperature of the obtained luminescent materials were measured for electrical characterization. The results showed that all materials have both photoluminescent and piezoelectric properties and show high Curie temperature.
Keywords: multi-functional smart material; titanates; photoluminescent material; piezoelectric material
1.
Introduction
RE2Ti2O7 type titanates have cubic pyrochlore crystal structure or monoclinic crystal structure of perovskite type. The crystal structure depends on the ionic radii of RE3+ ions (RE = trivalent rare earth ions) [1, 2]. The rare earth titanates with RE3+ ions having radii larger than Sm3+ form structures of perovskite type while with other rare earth ions with smaller radii they form cubic py-rochlore type structures. Thus, it is expected that Sm2Ti2O7 would have a cubic pyrochlore crystal structure. Sm2Ti2O7 was applied as an electronic material in the past [3,4]. In this regard, Er2Ti2O7 belongs to a series of rare-earth pyrochlore com-pounds having the general formula of RE2Ti2O7. The spins of RE3+ ions are located in the face centred cubic (fcc) array of corner sharing tetra-hedra forming this pyrochlore lattice [5, 6]. The monoclinic structure of La2Ti2O7has a layered pe-rovskite structure with monoclinic crystal system and different distances of donor-donor in differ-ent directions of the lanthanide ions, which offers ∗E-mail: [email protected]
the possibility of high concentration ion doping. Also, La2Ti2O7is an excellent host crystal for rare earth ions to produce a variety of photolumines-cence properties [7, 8]. Due to excellent electro-optic and piezoelectric properties and high Curie temperature, La2Ti2O7has been studied as a mate-rial for electrical and optical devices [9,10].
The aim of this study was to investigate RE2Ti2O7 type host crystal in terms of photo-luminescence and piezoelectric properties. Thus, Nd3+doped La2Ti2O7, Ce4+doped Sm2Ti2O7and Gd3+doped Er2Ti2O7were selected for the experi-ments. The compounds were sythesized using solid state reaction method. The photoluminescence and piezoelectric properties were obtained by doping the RE2Ti2O7 host crystal (RE: La3+, Sm4+ and Er3+) with a small amount of rare earth ions (Nd3+, Ce4+and Gd3+).
2.
Experimental
1 mol% Nd3+ doped La2Ti2O7, 1 mol% Ce4+ doped Sm2Ti2O7 and 1 mol% Gd3+ doped Er2Ti2O7 powders were prepared by a solid state reaction method. The starting
608 ESRAÖZTÜRKet al.
powders were weighed in nominal composi-tion of La1.98Nd0.02Ti2O7, Sm1.98Ce0.02Ti2O7 and Er1.98Gd0.02Ti2O7 from La2O3 (99.99 %, Acros), Sm2O3 (99.99 %, Aldrich), Er2O3 (99.9 %, Aldrich), Nd2O3(99.9 %, Acros), CeO2(99.95 %, Aldrich), Gd2O3 (99.9 %, Acros) and TiO2 (99.95 %, Aldrich) and well mixed in an agate mor-tar. To determine the decomposition and the oxi-dation process of the powder mixtures the mate-rials were analyzed by the simultaneous differen-tial thermal analysis (DTA) and thermogravimet-ric (TG) analysis (Seiko Instruments Inc./Exstar TG/DTA 630) at a heating rate of 10 °C/min from room temperature to 1300 °C. The powder mix-tures were packed into an alumina crucible and an-nealed in a muffle furnace in an open atmosphere. The samples were preheated at 800 °C for 3 h and then calcined from room temperature to a high tem-perature of 1050 °C, 1100 °C, 1200 °C, 1300 °C, 1400 °C for 24 hours. The annealed powder sam-ples were analyzed by X-ray powder diffraction technique (XRD) with a BRUKER AXS D8 AD-VANCE model X-ray diffractometer, which oper-ated at 40 kV and 30 mA (CuKα radiation) in a step-scan mode (0.02 °/2θ). The microstructure and elemental analyses of the samples were per-formed using a LEO 440 model scanning electron microscope at an accelerating voltage of 20 kV. Photoluminescence spectra of the samples were recorded using a photoluminescence spectropho-tometer (Photon Technology International (PTI), QuantaMasterTM30).
For dielectric and piezoelectric measurements, aqueous slurries were prepared by adding 2 wt.% polyvinyl alcohol as a binding agent (99 % purity, Sigma-Aldrich) to the deionized water, and then 5 vol.% solids which contained La1.98Nd0.02Ti2O7, Sm1.98Ce0.02Ti2O7 and Er1.98Gd0.02Ti2O7 pow-ders. The mixed samples were pressed into 10 mm diameter pellets under 250 MPa pressure by uni-axial pressing and heated at 1400 °C for 4 hours under open atmosphere to eliminate the binding agent. After this stage, the thickness and diameter of the pelletized samples were measured. The ex-perimental and relative density of the samples were measured according to Archimedes method. The pelletized sample was coated with a silver paste
(99.9 %) heated and fired at 650 °C for 1 h for the electrical measurements. The capacitance (C) and loss tangent (tanδ) were measured at 1 kHz using an LCR-meter (Hioki IM3536). An electric field of 9 to 18 kV/mm was applied to the pelletized sam-ples in a silicon oil bath at 120 °C for 30 minutes. After 24 hours, piezoelectric charge constant (d33) of the samples was measured by a d33-meter. To determine Curie temperature (Tc) of sintered pow-der samples at the last heating stage, a simultane-ous differential thermal analysis (DTA) and ther-mogravimetric (TG) analysis system was used.
3.
Results and discussion
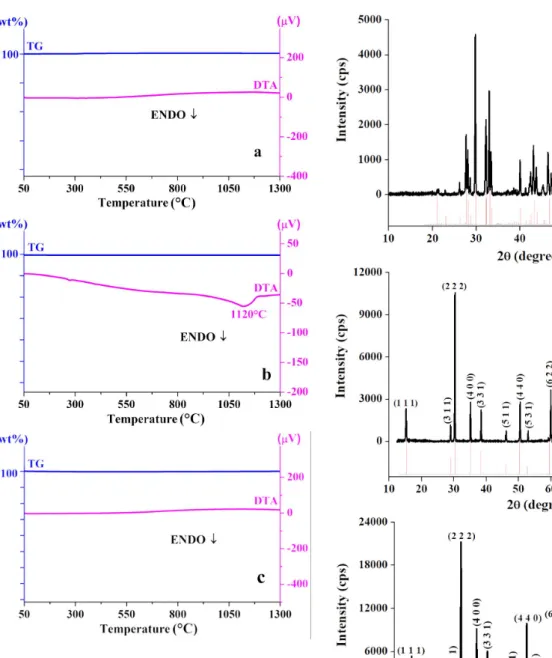
The TG-DTA curves of the starting materials mixture are shown in Fig.1a, Fig.1b and Fig.1c. In Fig.1, no mass loss is observed in the thermo-grams. It is an expected result because all starting materials were the oxide compounds. In Fig. 1a and Fig. 1c no exothermic/endothermic peaks are revealed, however, in the termogram (Fig. 1b) an endothermic peak at 1120 °C attributed to phase formation of Sm1.98Ce0.02Ti2O7is observed.
The powder samples were calcined at different times and temperatures, i.e. from room temperature up to 1050 °C, 1100 °C, 1200 °C, 1300 °C, 1400 °C for 24 hours. After the calcination processes, the XRD analysis was performed. The all peaks for La1.98Nd0.02Ti2O7 calcined at 1400 °C, can be at-tributed to the La2Ti2O7phase (PDF Card No. 01-076-3299), revealing that Nd3+ions have been effi-ciently incoroprated into the host crystal La2Ti2O7. The strongest peak of the La1.98Nd0.02Ti2O7 struc-ture is centered at 2θ = 29.7801° and it corre-sponds to the crystalline plane with Miller indices of (2 1 2). La1.98Nd0.02Ti2O7has a monoclinic sys-tem with the unit cell parameters a = 7.80896 Å, b = 5.54608 Å, c = 13.01425 Å, α = 90°, β= 98.658°, γ = 90°. Fig.2b presents the XRD pattern of Sm1.98Ce0.02Ti2O7. The sharpest diffrac-tion peaks at 2θ values of 14.7°, 28.6°, 30.3°, 35.4°, 38.2°, 50.5° and 60.2° indicate the planes (1 1 1), (3 1 1), (2 2 2), (4 0 0), (3 3 1), (4 4 0) and (6 2 2), respectively and are consis-tent with PDF Card No. 01-072-9772. This con-firms the formation of Sm2Ti2O7and Ce4+doping
Fig. 1. TG/DTA curves of starting materials mixtures of (a) La1.98Nd0.02Ti2O7, (b) Sm1.98Ce0.02Ti2O7,
(c) Er1.98Gd0.02Ti2O7.
into Sm2Ti2O7host crystal. Sm1.98Ce0.02Ti2O7has a cubic crystal system with unit cell parameters a = b = c 10.231 Å, α = β = γ = 90°. Fig. 2c shows the XRD pattern of Er1.98Gd0.02Ti2O7. It is shown that the XRD pattern of Er1.98Gd0.02Ti2O7 is in a good agreement with the perfect py-rochlore, PDF Card No. 01-075-8543. The cubic unit cell parameters of Er1.98Gd0.02Ti2O7are a = b = c = 10.0965 Å, α = β = γ = 90°.
The SEM images of the La1.98Nd0.02Ti2O7, Sm1.98Ce0.02Ti2O7and Er1.98Gd0.02Ti2O7powders
Fig. 2. XRD patterns of (a) La1.98Nd0.02Ti2O7, (b)
Sm1.98Ce0.02Ti2O7 and (c) Er1.98Gd0.02Ti2O7
calcined at 1400 °C for 24 h.
prepared by solid state reaction are shown in Fig.3. The grain size distribution range is of 0.6 µm to 4.0 µm and it reveals the polycrystalline na-ture of the material. The EDX analysis does not show any impurity atoms. The difference between
610 ESRAÖZTÜRKet al.
the calculated and observed percentages of the ele-ments is typical of polycrystalline samples (Fig.4).
Fig. 3. SEM images of (a) La1.98Nd0.02Ti2O7, (b)
Sm1.98Ce0.02Ti2O7and (c) Er1.98Gd0.02Ti2O7.
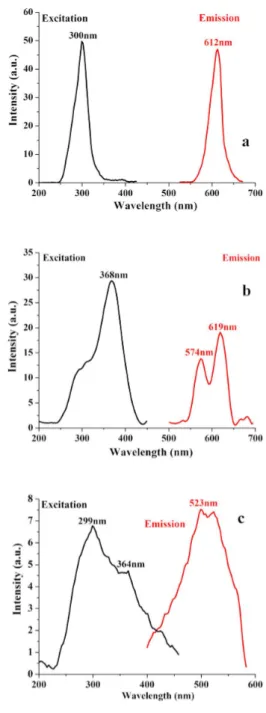
Fig.5a shows the excitation and emission spec-tra of La1.98Nd0.02Ti2O7. It can be seen that the excitation and emission peaks occur at 300 nm
Fig. 4. EDX analysis results of (a) La1.98Nd0.02Ti2O7,
(b) Sm1.98Ce0.02Ti2O7 and (c)
Er1.98Gd0.02Ti2O7.
and 612 nm, respectively. La3+ ions have a [Xe] 4f
0 inert gas configuration symbolized by a 1S0 ground state. Excited states can be caused by p → d transition leading to the electronic configuration 5s25p55d1 which gives rise to the triplet3P
1,3D2 and 3F3 states and the singlet 1P1, 1D2 and 1F3 states. The excited state of La3+ ion results from p → d transition, and the crystal field surround-ing the ion is approximated by an Oh field. The energy transition of La3+ arises from 1S0 →1F3 (∼300 nm). The La3+ ions with unfilled 4f or-bitals act as a sensitizer and enhance the emission
of Ti3+. The observed emission may be attributed to Ti3+ center in the La2Ti2O7 which is enhanced by the presence of La3+ ions. It has been re-ported earlier that the transition metal activator, Ti3+ ion, has spectral stimulated emission (SE) at about 611 nm (2E →2T2). The ions that do not pos-sess 4f electrons are reported to have no electronic energy levels that can induce excitation and lumi-nescence processes in or near the visible region. However, the emission peak observed at 612 nm is sharp and it can be attributed to the unfilled 4f orbital of the RE (La) added [11].
Trivalent samarium with 4f
5 configuration has complex energy levels and various possible tran-sitions between f → f levels. The trantran-sitions be-tween f levels have high selectivity and sharp line spectra. The excitation and emission spectra of Sm1.98Ce0.02Ti2O7 are shown in Fig. 5b. The broad excitation band located at 368 originates from 6H5/2 → 4D3/2 which are attributed to the f → f forbidden transitions of Sm3+. The emission spectrum of Sm1.98Ce0.02Ti2O7 exhibits two obvi-ous maxima located at 574 nm and 619 nm, being assigned to transitions from the excited4G5/2state to6HJ(J = 5/2, 7/2) levels of the Sm3+[12–15].
Fig. 5c shows excitation and emission spectra of Er1.98Gd0.02Ti2O7. The excitation spectrum con-sists of a broad band with two maxima at 299 nmn and 364 nm. These maxima belong to intra-4f-shell transitions of Er3+ from the ground state4I15/2 to higher energy levels,2K13/2and4G9/2. In the emis-sion spectrum, a broad band with one maximum at 523 nm is observed and attributed to the transition from the 2H11/2 state to the 4I15/2 ground state of Er3+[16,17].
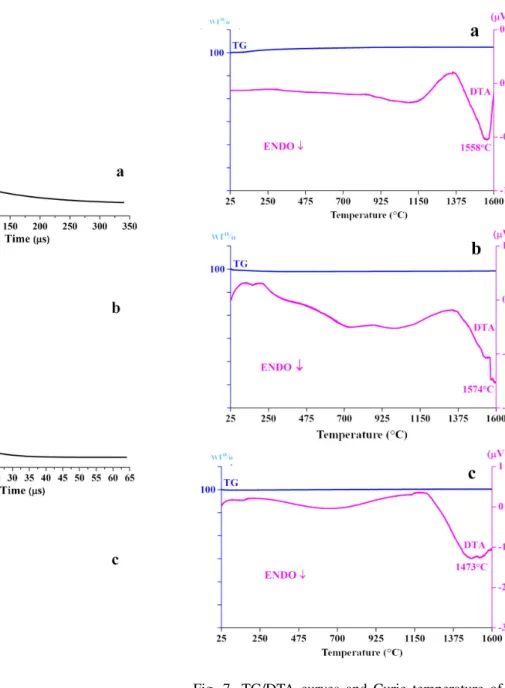
Decay time curves of La1.98Nd0.02Ti2O7 (for emission of La3+ ion at 612 nm, λex: 300 nm), Sm1.98Ce0.02Ti2O7 (for 4G5/2 → 6H7/2 transi-tion of Sm3+ ion at 619 nm, λex: 368 nm) and Er1.98Gd0.02Ti2O7 (for 2H11/2 →4I15/2 transition of Er3+ ion at 523 nm, λex: 299 nm) are shown in Fig.6a, Fig. 6b and Fig.6c. The decay curves are simulated and decay times are calculated using the single exponential function:
I(t) = I0· exp(−t/τ) (1)
Fig. 5. The excitation and emission spectra of (a) La1.98Nd0.02Ti2O7(λem: 612 nm, λex: 300 nm),
(b) Sm1.98Ce0.02Ti2O7 (λem: 619 nm, λex:
368 nm) and (c) Er1.98Gd0.02Ti2O7 (λem:
523 nm, λex: 299 nm).
where I0 is the initial intensity and τ is the de-cay time constant. According to the fitting results, the decay times are 5.224 µs, 2.0 µs and 6.022 µs for La1.98Nd0.02Ti2O7, Sm1.98Ce0.02Ti2O7 and Er1.98Gd0.02Ti2O7phosphors, respectively.
612 ESRAÖZTÜRKet al.
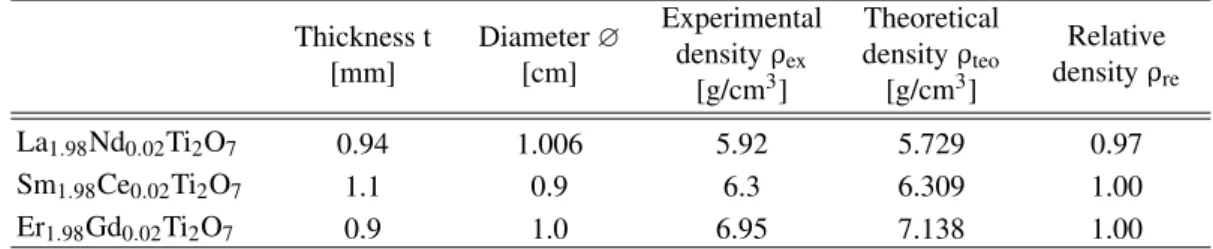
Table 1. Thickness t, diameter ∅ and relative densities of the pelletized samples. Thickness t [mm] Diameter ∅ [cm] Experimental density ρex [g/cm3] Theoretical density ρteo [g/cm3] Relative density ρre La1.98Nd0.02Ti2O7 0.94 1.006 5.92 5.729 0.97 Sm1.98Ce0.02Ti2O7 1.1 0.9 6.3 6.309 1.00 Er1.98Gd0.02Ti2O7 0.9 1.0 6.95 7.138 1.00
Table 2. Capacitance C, dielectric constant Er, loss tangent tanδ, piezoelectric charge constant d33 and Curie
temperature Tcof the samples.
Capacitance C [F] Dielectric constant Er Loss tangent, tanδ [%] Piezoelectric charge constant d33 [pC/N] Curie temperature Tc[°C] La1.98Nd0.02Ti2O7 14.74 12 2.15 0.53 1558 Sm1.98Ce0.02Ti2O7 22.52 36 1.22 0.5 1574 Er1.98Gd0.02Ti2O7 16.3 21.12 3.6 0.5 1560
For the dielectric and piezoelectric measure-ments, thickness (t) and diameter (∅) of the pel-letized samples were measured and the densities were calculated using the Archimedes method. The dimensions and densities are shown in Table1. Af-ter that, the capacitance C and loss tangent tanδ of pelletized samples coated with silver paste were measured and dielectric constant Erwas calculated using the equation2:
Er= C · t/A · E0 (2)
Then, the pelletized samples were exposed to an electric field of 9 kV/mm to 18 kV/mm in a silicon oil bath at 120 °C for 30 minutes. After 24 hours, piezoelectric charge constant d33 of all samples was measured by a d33-meter. Curie tem-perature Tcof sintered powder samples annealed at 1400 °C for 4 h was determined using a TG/DTA system (Fig.7). The first endotermic peak tempera-ture in the termograms belonging to any phase tran-sition is attributed to Curie temperature because the material loses its piezoelectric properties at tem-peratures above Curie temperature [18, 19]. The capacitance C, dielectric constant Er, loss tangent tanδ, piezoelectric charge constant d33 and Curie temperature of the pelletized samples are listed in Table2. When comparing the electrical properties,
Sm1.98Ce0.02Ti2O7 has the largest dielectric con-stant. All these materials have similar piezoelectric constant and Curie temperature.
4.
Conclusions
In this work, we sythesized and character-ized multifinctional materials La1.98Nd0.02Ti2O7, Sm1.98Ce0.02Ti2O7 and Er1.98Gd0.02Ti2O7. The materials have photoluminescent and piezoelectric properties. The 4G5/2 → 6H
7/2 (619 nm) transi-tion of Sm3+ has the strongest intensity and can be applied to orange-red emitting display mate-rials. In particular, the emission peaks are cen-tered in the green region, and these color coordi-nates are desirable. Such partial emission in the green region only with favorable color coordinates is very rare for Er3+ other than in inorganic ox-ide host, where emission with moderate intensity is observed between 500 nm and 700 nm. Ad-ditionally, La1.98Nd0.02Ti2O7, Sm1.98Ce0.02Ti2O7 and Er1.98Gd0.02Ti2O7 have high Curie tempera-ture which is 1558 °C, 1574 °C and 1560 °C, respectively. The obtained results indicate that the La1.98Nd0.02Ti2O7, Sm1.98Ce0.02Ti2O7 and Er1.98Gd0.02Ti2O7are multifunctional smart mate-rial with promising red and green PL useful for op-toelectronic applications.
Fig. 6. Decay curves of (a) La1.98Nd0.02Ti2O7 (λem:
612 nm), (b) Sm1.98Ce0.02Ti2O7(λem: 619 nm)
and (c) Er1.98Gd0.02Ti2O7(λem: 523 nm).
Acknowledgements
The authors would like to thank the TUBITAK (The Sci-entific and Technological Research Council of Turkey) for the support to the Project Numbered 114Z438.
Fig. 7. TG/DTA curves and Curie temperature of (a) La1.98Nd0.02Ti2O7, (b) Sm1.98Ce0.02Ti2O7 and
(c) Er1.98Gd0.02Ti2O7.
References
[1] EWINGR.C., WEBERW.J., LIANJ., J. Appl. Phys., 95 (2004), 5929.
[2] SUBRAMANIAN M.A., ARAVAMUDAN G., SUBBA
RAOG.V., Prog. Solid State Chem., 15 (1983), 55. [3] JAFARM., SENGUPTAP., ACHARYS.N., TYAGIA.K.,
J. Eur. Ceram. Soc.,34 (2014), 4373.
[4] RABANAL M.E., VÁREZ A., AMADOR U., DOM
-PABLO E.A., GARCIA-ALVARADO F., J. Mater. Pro-cess. Technol.,92 – 93 (1999), 529.
614 ESRAÖZTÜRKet al.
[6] RAMIREZA.P., Annu. Rev. Mater. Sci., 24 (1994), 453. [7] DIALLO P.T., BOUTINAUD P., MAHIOU R., COUS
-SEINSJ.C., J. Alloy. Compd., 275 – 277 (1998), 307. [8] YANGH.H., CHENGH., TANGY.G., LU Z.G., Am.
Ceram. Soc., 92 (2009), 931.
[9] TITOV Y.A., SYCH A.M., MARKIV V.Y., BELYAV
-INAN.M., KAPSHUKA.A., YASCHUKV.P., J. Alloy. Compd.,316 (2001), 309.
[10] LI A.D., WANG Y.J., HUANG S., CHENG J.B., WUD., MINGN.B., J. Cryst. Growth., 268 (2004), 198. [11] LYJO J.K., DAYAS K.R., DAMODAR S., KRISH
-NAN B., KRISHNANKUTTY K., NAMPOORI V.P.N., RADHAKRISHNANP., Spectrochim. Acta A, 71 (2008), 1281.
[12] LI Y.-C., CHANG Y.-H., LIN Y.-F., CHANG Y.-S., LINY.-J., J. Alloy. Compd., 439 (2007), 367.
[13] DORDEVIC V., NIKOLIC M.G., ANTIC Ž., MITRIC M., DRAMICANIN M.D., Acta Phys. Pol. A, 120 (2011), 303.
[14] NARESHV., BUDDHUDUS., J. Lumin., 147 (2014), 63. [15] DENG H., ZHAOZ., WANGJ., HEIZ., LIM., NOH
H.M., JEONG J.H., YUR., J. Solid State Chem., 228 (2015), 110.
[16] LIY.-C., CHANGY.-H., LINY.-F., LINY.-J., Appl. Phys. Lett.,89 (2006), 081110.
[17] LIA., SUNL., ZHENGZ., WUW., LIUW., YANGY., LUT., SUW., J. Lumin., 128 (2008), 239.
[18] MANIM.K., VIOLAG., HALLJ., GRASSOS., REECE
M.J., J. Magn. Magn. Mater., 382 (2015), 202. [19] FERK G., DROFENIK M., LISJAK D., HAMLER A.,
JAGLI ˇCI ´C Z., MAKOVEC D., J. Magn. Magn. Mater., 350 (2015), 124.
Received 2018-12-19 Accepted 2019-04-23