İSTANBUL BİLGİ ÜNİVERSİTESİ SOSYAL BİLİMLER ENSTİTÜSÜ
KLİNİK PSİKOLOJİ YÜKSEK LİSANS PROGRAMI
TURKISH ADAPTATION OF THE INTUITIVE EATING SCALE –2
EGENUR BAKINER 115629006
PROF. DR. HALE BOLAK BORATAV
İSTANBUL 2017
Acknowledgments
I had support from many great people in the process of completing my thesis. I owe many thanks to these wonderful people.
Firstly, I would like to thank my thesis advisor Prof. Dr. Hale Bolak Boratav for her valuable guidance and support. She was always there for me whenever I needed something, and she gave her time although she had a heavy schedule. Without her help, it would be impossible to finish this thesis.
I want to thank Asst. Prof. Ümit Akırmak for his guidance and patience with me. His vast knowledge in advanced statistical analyses made it possible for me to complete this thesis. He always encouraged me and answered all my questions patiently and kindly.
I also want to thank Asst. Prof. Gülin Güneri Akay. She gave me the idea to adapt this useful scale to Turkish and guided me throughout the process. Thanks to her, I was able to fill a gap in the assessment of eating behaviors in Turkish. Her support was very valuable to me.
I want to thank my classmates who always encouraged me to finish my thesis. Gökçe, Derya, Emel, Selcan, Öykü, Onur, Funda, Sena, Didem, Mehmet and Selma; thank you all!
Lastly, I want to express my gratitude and love to my wonderful family, my mother Sevdiye Bakıner, my father Kemal Bakıner, my brother Onur Bakıner and my fiancée Çağlar Yücebilgiç for their unconditional love and support. Without them this thesis could not be completed since I would be incomplete.
TABLE OF CONTENT
Title Page ... i
Approval ... ii
Acknowledgments ... iii
List of Tables ... vii
List of Appendices ... viii
List of Figures ... viii
Abstract ... ix
Özet ... x
Chapter 1. Introduction ... 1
1.1 Intuitive Eating ... 1
1.1.1 Unconditional Permission to Eat ... 1
1.1.2 Eating for Physical Rather Than Emotional Reasons ... 2
1.1.3 Reliance on Internal Hunger and Satiety Cues ... 2
1.1.4 Intuitive Eating and Physical Health ... 3
1.1.5 Intuitive Eating and Psychological Health ... 4
1.1.6 How Intuitive Eating Patterns are Lost ... 5
1.1.6.1 Objectification Theory ... 5
1.1.6.2 Parenting ... 7
1.1.6.2.1 Well-Intentioned Parental Restrictions ... 7
1.1.6.2.2 Effect of Parents’ Eating Behaviors ... 7
1.1.7 Importance and Benefits of Intuitive Eating ... 8
1.1.7.1 Health at Every Size versus Dieting Approach 8 1.2 What is Non-Intuitive Eating?: Emotional Eating ... 9
1.2.1 Inadequate Affect Regulation ... 9
1.2.2. Escape Theory ... 9
1.2.3 Restraint Theory ... 10
1.3 Is Intuitive Eating an Anti-Thesis of Disordered Eating? .... 10
1.4. The Intuitive Eating Scale ... 11
1.6 Present Study ... 12 1.6.1 Hypotheses ... 13 1.6.1.1 Study 1 ... 13 1.6.1.2 Study 2 ... 13 Chapter 2. Study 1 ... 14 2.1 Method ... 14 2.1.1 Participants ... 14 2.1.2 Instruments ... 15
2.1.2.1 Informed Consent Form... 15
2.1.2.2 Demographic Information Form ... 15
2.1.2.3 The IES-2 ... 15
2.1.2.4 Turkish Version of the IES-2 ... 17
2.1.2.5 Rosenberg Self-Esteem Scale ... 17
2.1.2.6 Maudsley Obsessive Compulsive Inventory ... 17
2.1.2.7 EAT-26 ... 18
2.1.2.8 Social Physique Anxiety Scale ... 18
2.1.3 Procedure... 18
2.2 Results ... 19
2.2.1 Descriptive Statistics ... 19
2.2.2 Exploratory Factor Analysis ... 22
2.2.3 Reliability... 27 2.2.3.1 Internal Reliability ... 27 2.2.3.2 Test-Retest Reliability ... 27 2.2.4 Validity ... 27 2.2.4.1 Construct Validity ... 27 2.2.4.2 Criterion Validity ... 28
Chapter 3. Study 2: Confirmatory Factor Analysis of the IES-2 ... 30
3.1 Method ... 30
3.1.1 Participants ... 30
3.1.2 Instruments ... 31
3.1.2.1 Informed Consent Form ... 31
3.1.2.3 Turkish Version of the IES-2 ... 31
3.1.3 Procedure... 31
3.2 Results ... 32
3.2.1 Descriptive Statistics ... 32
3.2.2 Confirmatory Factor Analysis ... 32
Chapter 4. Discussion ... 39
4.1 Clinical Implications ... 44
4.2 Limitations and Suggestions for Future Research ... 45
Chapter 5. Conclusion ... 47
References ... 48
List of Tables
Table 1 - Descriptive Statistics for All Study 1 Variables ... 19 Table 2 - Means, Standard Deviations and Minimum-Maximum Values for Female Participants ... 20 Table 3 - Means, Standard Deviations and Minimum-Maximum Values for Male Participants ... 20 Table 4- Item-Factor Loadings of the IES-2 ... 25 Table 5 - Correlations of the IES-2 Total Scores and the IES-2 Subscale Scores ... 28 Table 6 - Correlations of the IES-2 Scores, Maudsley Obsessive Compulsive Inventory, Rosenberg Self-Esteem Scale, Social Physique Anxiety Scale, EAT-26 and Participants’ BMI ... 29 Table 7 - Descriptive Statistics for All Study 2 Variables ... 32 Table 8 – Goodness of Fit Indices for Various Statistical Models of CFA for the IES-2 ... 33 Table 9 - Goodness of Fit Indices for Various Statistical Models of Second-Order CFA for the IES-2 ... 34 Table 10 - Goodness of Fit Indices for Second-Order CFA for the IES-2 with Study 1’s Sample Data ... 35 Table 11 - First and Second-Order CFA Values of the IES-2 ... 36
List of Appendices
Appendix A: Demographic Information Form ... 55
Appendix B: Maudsley Obsessive-Compulsive Inventory, Checking and Rumination Subscales ... 56
Appendix C: Rosenberg Self-Esteem Scale ... 57
Appendix D: Turkish EAT-26 ... 58
Appendix E: Turkish Social Physique Anxiety Scale ... 59
Appendix F: The Turkish IES-2 ... 60
Appendix G: The Modified Turkish IES-2 and Scoring Instructions ... 61
List of Figures
Figure 1 - Tylka and Sabik’s (2010) combination of the tenets of objectification theory, social comparison theory and self-esteem ... 6Figure 2- Mean Scores for Female Participants ... 21
Figure 3- Mean Scores for Male Participants ... 21
Figure 4 – Parallel Analysis of the IES-2 Data ... 23
Abstract
The primary purpose of this study is to adapt the Intuitive Eating Scale-2, which was originally developed in the USA, to Turkish and to assess its reliability and validity in the Turkish population. The IES-2 was originally developed to contain 23 items and 4 subscales: Eating for Physical Rather Than Emotional Reasons (EPR), Unconditional Permission to Eat (UPE), Reliance on Hunger and Satiety Cues (RHSC) and Body-Food Choice Congruence (B-FCC). In the first study, an exploratory factor analysis was conducted to evaluate the factor structure of the Turkish IES-2 and it revealed a similar four-factor structure as in the original study. 2 items were omitted from the Turkish IES-2 due to low KMO value and low primary loading. Reliability and validity study was conducted with 264 people from the normal population. Results indicate that the Turkish IES-2 is a reliable and valid scale for the assessment of intuitive eating. In the second study, it was checked if the four-factor structure could be confirmed with a different sample of 271 participants through confirmatory factor analysis. Another aim of the second study was to check if the four factors of the IES-2 load on to a higher factor, intuitive eating. The results indicated that the data fit well and the four-factor structure was confirmed with a different sample. A second-order CFA revealed an overall acceptable fit and except for UPE, first-order factors loaded highly on to higher-order intuitive eating factor in the Turkish sample. Consequently, the results of the present study demonstrated that IES-2 is a valid and reliable instrument for adult population in Turkey. The Turkish IES-2 can be a useful tool for identifying individuals who do not have the ability to distinguish physical hunger from emotional hunger. The findings are discussed along with the limitations and clinical implications of the study and with suggestions for future research.
Özet
Bu çalışmanın amacı ABD’de geliştirilen Sezgisel Yeme Ölçeği-2’yi Türkçe’ye adapte etmek ve Türk popülasyonda geçerlik ve güvenilirlik analizlerini yapmaktır. SYÖ-2 orijinal halinde 23 madde ve 4 alt ölçeğe sahiptir: Duygusal Değil Fiziksel Sebeplerle Yeme, Yemeye Şartsız İzin Verme, Açlık ve Doygunluk İpuçlarına Güvenme ve Vücut-Yemek Seçim Uyumu. İlk çalışmada SYÖ-2’nin Türkçe versiyonunun faktör yapısını değerlendirmek için keşfedici faktör analizi uygulanmış ve orijinal çalışmadakine benzer bir şekilde dört faktörlü bir yapı bulunmuştur. Türkçe versiyonunda biri düşük KMO değeri ve biri kendi faktörüne düşük şekilde yüklenmesi sebebiyle iki madde çıkarılmıştır. Geçerlik ve güvenirlik analizleri normal popülasyondan 264 katılımcı ile gerçekleştirilmiştir. Sonuçlar SYÖ-2’nin Türkçe versiyonunun sezgisel yemeyi ölçmede geçerli ve güvenilir bir ölçek olduğunu ortaya koymuştur. İkinci çalışmada 271 kişilik bir başka örneklemde dörtlü faktör yapısının iyi bir şekilde uyum gösterip göstermediğine doğrulayıcı faktör analizi yoluyla bakılmıştır. İkinci çalışmanın bir başka amacı SYÖ-2’nin dört faktörünün daha yüksek bir faktöre, sezgisel yemeye, yüklenip yüklenmediğini görmektir. Sonuçlar faktör yapısının bir başka örneklemde de yeterli şekilde uyduğunu ve ‘Yemeye Şartsız İzin Verme’ faktörü dışındaki faktörlerin Türk örneklemde sezgisel yemeye yüksek düzeyde yüklendiğini göstermiştir. Sonuç olarak bu çalışmanın sonuçları SYÖ-2’nin Türk yetişkin popülasyonda geçerli ve güvenilir bir ölçek olduğunu ortaya koymuştur. SYÖ-2’nin Türkçe versiyonu fiziksel açlığı duygusal açlıktan ayırt edemeyen bireylerin saptanması için faydalı bir araç olabilir. Bulgular, çalışmanın sınırlıkları, klinik çıkarımlar ve gelecek çalışmalar için öneriler tartışılmıştır.
CHAPTER 1: INTRODUCTION
1.1 INTUITIVE EATINGUntil recently, eating behaviors were mainly classified as pathological and non-pathological. Most studies focused on how pathological eating behaviors developed, how these behaviors could be healed and how the researchers could measure and interpret them. However non-pathological eating behaviors do not necessarily have to be adaptive (Tylka & Wilcox, 2006) and studies on adaptive eating behaviors were underrepresented in the literature. Intuitive eating is one of the adaptive types of eating behaviors. It is mainly characterized as eating in response to physiological hunger and satiety cues, and not to emotional or external ones (Tylka, 2006). According to Tylka and Kroon Van Diest (2013) people who eat intuitively do not get preoccupied about food. Although they do care about taste, they mainly value their body’s functioning in their food choices. They trust their internal cues about when, what and how to eat (Tylka & Kroon Van Diest, 2013).
Intuitive eating is a term that is used by several psychologist and nutritionists (Carper, Fisher & Birch, 2000; Tylka, 2006, Tribole & Resch, 1995). They claim that intuitive eating is adaptive since it mainly focuses on what the body needs and people who eat intuitively are in contact with their internal physiological states and they are not preoccupied with food (Tylka, 2006). According to these scholars, there are three central features of intuitive eating: (a) unconditional permission to eat, (b) eating for physical rather than emotional reasons, and (c) reliance on internal hunger and satiety cues.
1.1.1 Unconditional Permission to Eat.
According to Tribole and Resch, people who give themselves unconditional permission to eat do so as a response to their internal physiological hunger signals and eat the food they desire at a particular moment (Tribole & Resch, 1995). They do not perceive certain types of food as unacceptable and do not avoid them. They trust their bodies about when, what and how to eat (Tylka, 2006).
On the contrary people who restrict themselves about eating and have ‘conditions’ in their eating behaviors try to limit and control their eating, and get preoccupied about food (Polivy & Herman, 1999). Because of the restriction about food and the preoccupation that comes with it, the likelihood of conditional eaters to eat more than the intuitive eaters increases. In one study, researchers found out that restrained eaters break their restraint especially when they believe their previous meal was high in calorie and tasted good. The cognitive preoccupation is important in this overeating behavior since it is based on the perception of the restrained eaters (Woody, Costanzo & Liefer, 1981).
1.1.2 Eating for Physical Rather Than Emotional Reasons
People who eat intuitively depend on their physical cues. When they feel hungry, they eat and they do not take their emotions into account. Herman and Polivy proposed a boundary model to explain the difference between individuals who eat intuitively and who restrict themselves. People who do not diet have only two boundaries: hunger and satiety. When hungry they eat and when their body sends the signals of satiety they stop eating. This is not the case for people who restrict their eating since they have a third unnatural diet boundary (as cited in Tylka 2006). But when there is a rupture in this boundary, the eating behavior may get out of control and lose its connection with bodily signals. People who diet may eat ‘unpermitted’ food when their mood changes. This paves the way to eating in negative mood states (Costanzo, Reichmann, Friedman & Musante, 2001).
1.1.3 Reliance on Internal Hunger and Satiety Cues
Relying on internal hunger and satiety cues are inborn processes that all human beings have. Research has revealed that young children have an inner sense of balance about food. When they were given a low-energy or high-energy meal as the first course and then had the chance to choose from a variety of food, they chose high-energy or low-energy foods respectively, thus balancing their first course (Birch & Deysher, 1985). In another study, Birch, McPhee and Sullivan (1989) made children drink beverages that changed in caloric density in several different conditions and water in one
condition. Independent from the caloric density of the beverage, the children ate food that had fewer calories when compared to water condition (Birch, McPhee & Sullivan, 1989). These show that even young children balance their energy intake and have an innate compensation mechanism about food. However this process may change due to environmental reasons. Societal thin ideals or parenting practices regarding eating may be the two of many reasons; these will be elaborated on below. When society values dieting and being thin (Fredrickson & Roberts, 1997) or when parents interfere with their children’s eating patterns with the concern that they cannot regulate their eating behaviors (Birch & Fisher, 1998), this innate mechanism disappears and people start to rely on external cues about eating.
1.1.4 Intuitive eating and physical health
Intuitive eating is based on physiological cues; therefore the body is in charge of eating decisions. If we consider that the body will intuitively try to balance its choices, intuitive eating is also expected to contribute to physical health. According to Gast, Campbell Nielson, Hunt and Leiker (2015) since intuitive eaters value their internal physiological mechanisms, they also engage in physical activity for their internal physiological needs rather than relying on external factors. In their study, they found that for intuitive eaters being physically active for intuitive eaters is part of the self-concept. Intuitive eaters engage in physical activity if they enjoy it and if it gives internal satisfaction. This is not the case for non-intuitive eaters: they mostly engage in physical activity because of external factors like pressure from society (Gast, Campbell Nielson, Hunt & Leiker, 2015).
The intuitive eating approach is mostly used in health-focused applications. Especially in obesity treatment calorie-restraining diet programs are not always successful and gaining the weight that was lost is common (Péneau, Ménard, Méjean, Bellisle & Hercberg, 2013). On the other hand intuitive eating is an innate mechanism and its main focus is not weight loss; it creates balance within the body. Thus, a new trend is blooming in the treatment of obesity: not focusing on weight loss and putting health at the center.
In one research, obese women were separated into two groups; diet and non-diet group. These groups were then compared in several aspects. Weight loss only occurred in the diet group. Despite this fact both the diet and non-diet groups improved in cholesterol, LDL, triglycerides and blood pressure. It cannot be claimed that weight-loss approaches are unhealthy since both of these groups improved (Bacon et al., 2002). At this point one may think that intuitive eating approaches and weight loss approaches do not differ in terms of creating physical health outcomes. Although this may be true, the real difference mostly shows itself in psychological health outcomes.
1.1.5 Intuitive eating and psychological health
According to Tylka (2006) intuitive eating is a highly adaptive phenomenon not only in the realm of nutrition but also in psychological well-being. She claims that women who eat more intuitively care less about societal thin ideals. With the increase of intuitive eating optimism, self-esteem and satisfaction with life also increase (Tylka, 2006). Bacon et al.’s (2002) study also examined how diet and non-diet groups differ in attrition and self-evaluation. The real difference was found here: while 42% of the diet group dropped out, only 8% of the non-diet group dropped out. Participants in the non-diet group showed significant improvement in scores on the Rosenberg Self-Esteem Scale (RSES) one year after the treatment. On the other hand participants in the diet group showed an immediate improvement in RSES; however this improvement was not maintained. ‘The program made me feel better about myself’ was validated by 93% of the non-diet group and only 51% of the diet group. Also the dropouts of the diet group mostly indicated that they felt like they were failing the program. This was not the case for dropouts from the non-diet group (Bacon et al., 2002). As it was said above, although these two groups did not differ much with regards to physical health, the difference was huge with regards to psychological health. Intuitive eating approaches are not programs to succeed or fail; they signify mainly a return to the innate mechanism that all
human beings have when they are born. As a result, returning to this innate mechanism has much better psychological outcomes than the programs that impose restraint and boundaries to natural mechanisms.
1.1.6 How intuitive eating patterns are lost
No infant in the world diets. Human beings are born with intuitive eating patterns. In an environment where unconditional acceptance lacks and imposition of rigid rules on eating behavior exists this tendency towards intuitive eating may disappear for some individuals (Carper, Fisher & Birch, 2000). The contemporary life style that is characterized by food advertisements, dieting industry and restaurants that serve large portions may be examples of non-accepting environment (Van Dyke & Drinkwater, 2013). When people start dieting as a result of a non-accepting environment they may forget to rely on their bodily signals and may lose touch with their hunger and satiety cues (Birch & Fisher, 2000). Below, two of the possible processes that contribute to the disappearance of intuitive eating patterns in most individuals are specified.
1.1.6.1 Objectification Theory
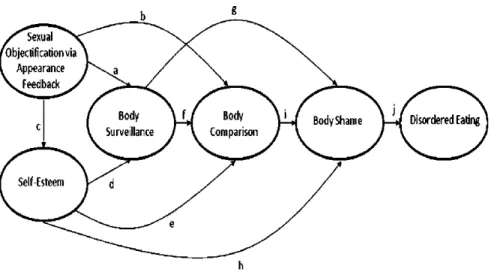
According to objectification theory, starting in young ages, women start to perceive themselves through the lens of others (Fredrickson & Roberts, 1997). If the observers’ perspective is negative, women also start to perceive themselves in a negative way (Augustus-Horvath & Tylka, 2011). In the objectification process, the body is perceived as a separate entity and the rest of the person is not taken into consideration. Experiences of objectification lead women to internalize this third person gaze and this may pave the way for ‘self-objectification’ (Fredrickson & Roberts, 1997). The self-objectification process may lead to increased body shame, decreased awareness of internal states, increased appearance anxiety (Mercurio & Landry, 2008), and even eating disorders (Augustus-Horvath & Tylka, 2011); but even if things do not get that serious, most women become chronic dieters to achieve the thin ideals of society.
the person does not fit the beauty standards of the society, that she should try to achieve that standard and that right now she is inadequate since she does not fit this standard (Tylka & Sabik, 2010). These processes contribute to self objectification and give a sense of inadequacy. Tylka and Sabik (2010) elaborated their idea with a figure:
As it can be seen from the figure, starting with sexual objectification via appearance feedback from others, several processes get activated and they all interact with each other. At the end of these processes, there is one final destination: disordered eating.
Objectification theory mainly focuses on women, but its basic principles can be applied to men too. Constant self-objectification paves way to body surveillance, anxiety, body shame and reduced awareness about internal bodily states (Moradi, 2010). Since relying on internal cues and body appreciation are strong predictors of intuitive eating (Tylka & Hill, 2004), objectification and self-objectification that are created as a result of this process are huge threats for intuitive eating patterns.
Figure 1. Tylka and Sabik (2010) combined the tenets of
1.1.6.2 Parenting
1.1.6.2.1 Well-Intentioned Parental Restrictions
As mentioned before, environmental factors may disrupt the tendency of intuitive eating that human beings have from birth. However this environment does not always have to be a non-accepting and objectifying environment. Well-intentioned behaviors may also cause the loss of intuitive eating patterns. Parents may force their children to eat more (e.g. trying to make the child eat more vegetables) or eat less (e.g. trying to make the child eat less junk food) because of health concerns (Birch & Fisher, 1998). Although well-intentioned acts, strict parental control in feeding paves way to poorer self-regulation in young children (Faith, Scanlon, Birch, Francis & Sherry, 2004). According to Carper, Fisher and Birch (2000), parental pressures to eat and to restrict the food intake both change behavior in girls as young as 5 years old (Birch & Fisher, 2000). This makes children focus less on their bodily signals and more on emotional and external cues.
1.1.6.2.2 Effect of Parents’ Eating Behaviors
In their study, Birch and Fisher (2000) found out that a mother’s perception of their own body and weight is an indicator of restriction in child feeding (Birch & Fisher, 2000). This brings up questions about how parents’ eating behaviors affect their child-feeding practices. According to Pike and Rodin’s (1991) study, mothers of daughters with disordered eating have a longer history of dieting and have more disordered eating patterns themselves. These findings suggest a transmission of disordered eating patterns (Pike & Rodin, 1991). In another study, it was found that even 5-year-old girls know about dieting behaviors and their responses to the questions about dieting are similar to responses of older children and adults if their mothers are dieting. These answers were much more articulated than the answers of children whose mothers were not on a diet. So it can be said that transmission of dieting information occurs much earlier than dieting behavior in children (Abramovitz & Birch, 2000).
As it can be seen from previous studies, parental eating behaviors have a great effect on children’s eating patterns. When more disordered eating patterns are transmitted from the previous generation, the risk of developing disordered eating patterns increases. This, in turn, is a huge risk factor for losing the intuitive eating patterns. Being constantly exposed to dieting behavior, the children lose their connection with internal states at a very young age.
1.1.7 Importance and benefits of intuitive eating
As indicated earlier, intuitive eating is an innate, adaptive process. The presence of intuitive eating correlates positively with psychological well-being and negatively with eating disorder symptomatology (Tylka & Wilcox, 2006). These theoretical findings have clinical implications and traditional weight loss approaches are gradually getting abandoned. Approaches that focus on health and innate mechanisms are starting to be implemented. Below is a comparison of traditional dieting approaches and health at every size approaches.
1.1.7.1 Health at every size versus dieting approaches
Numerous studies proved that intuitive eating strategies are much more sustainable and health-related than energy-restricted dieting. There is a high risk of developing maladaptive eating patterns like emotional eating when dieting (Péneau, Ménard, Méjean, Bellisle & Hercberg, 2013). Contrary to dieting, intuitive eating programs focus more on health rather than size and weight loss (Bacon, Stern, Van Loan & Keim, 2005). Also rather than increased cognitive restraint, decreased constraint is encouraged in ‘health at every size’ programs. These programs aim to increase the reliance on intuitive regulation (Bacon, Stern, Van Loan & Keim, 2005). Research reveals that these programs achieve long-term weight maintenance among obese or overweight women (Bacon, Stern, Loan & Keim, 2005) and lower body mass index (BMI) (Tylka, 2006; Tylka & Kroon Van Diest, 2013). However, physical benefits are not the only benefits that ‘health in every size’ programs provide. These programs also increase psychological well-being. In one study, Bacon, Stern, Van Loan and Keim (2005)
implemented two different programs with different groups. One group was dieting and the other was in an intuitive eating program. 100% of the individuals in the second group reported feeling better about themselves and this ratio was only 47% in the diet group. Also after a brief amount of time with improvement, the individuals in the diet group demonstrated a worsening of self-esteem and more than half of these individuals expressed that they felt like they failed. None of the individuals in intuitive eating program expressed these kinds of feelings (Bacon, Stern, Van Loan & Keim, 2005).
1.2 WHAT IS NON-INTUITIVE EATING?: EMOTIONAL EATING Emotional eating is the opposite of intuitive eating. Rather than depending on bodily signals, emotional eaters depend on emotional states for their eating behaviors. Researchers have found that emotional eaters overeat in negative and stressful situations because food distracts them and helps them escape disturbing mood states (Telch, 1997). There are different approaches on why people eat when they feel emotional. These approaches are briefly explained below.
1.2.1 Inadequate affect regulation
The models that focus on the role of inadequate affect regulation in emotional eating claim that emotional eaters eat as a response to aversive mood since they have learned that eating distracts them from those negative mood states (Telch, 1997).
1.2.2 Escape Theory
This theory claims that emotional eating (or overeating in the sense that it is more than what the body needs) is a response to threatening self-awareness. When an individual’s body becomes subjected to internal or external high standards, it becomes harder to attain those standards. Thus, emotional eaters want to escape from that threatening awareness of self by moving their focus to other external stimuli, like food (Heatherton & Baumeister, 1991).
1.2.3 Restraint Theory
Herman and Polivy claim that negative affect causes emotional eating (or overeating in the sense that it is more than what the body needs) especially for individuals who are restrained eaters (as cited in Spoor, Bekker, Van Strien, & van Heck, 2007). The more these individuals try to limit their energy intake, the more they get preoccupied about food (Polivy & Herman, 1999).
1.3 IS INTUITIVE EATING AN ANTI-THESIS OF DISORDERED EATING?
As mentioned above, intuitive eating is an adaptive eating behavior that all human beings have from birth onwards. This behavior may change due to environmental and psychological reasons. Psychological well-being is not only an absence of pathology. It has its own dynamics and strengths (Seligman & Csikszentmihalyi, 2000). However, research about eating disorders usually only focuses on pathology or lack of pathology. Tylka and Wilcox (2006) claim that this is the wrong approach since a low level of pathology does not equal adaptive eating. Although intuitive eating usually correlates with absence of eating disorder symptoms, it cannot be reduced only to that. Tylka and Wilcox (2006) proved this in a study, in which they aimed to understand how the Intuitive Eating Scale subscales are related to eating disorder symptoms. They found that unconditional permission to eat and ED symptomatology have a strong negative relationship. Thus, it is not possible to perceive unconditional permission to eat as a concept independent from the absence of ED symptomatology. However this was not the case for the other two subscales, namely, eating for physical rather than emotional reasons and reliance on hunger/satiety cues. The authors found that these two make additional contributions to well-being indices. With this finding, the authors proved that intuitive eating is a concept worth examining that does not only represent lack of ED symptomatology (Tylka & Wilcox, 2006).
1.4 THE INTUITIVE EATING SCALE
The IES was developed in 2006 by Tracy Tylka (Tylka, 2006). Tylka noted that most instruments that assess eating behaviors were focused on pathology, and wanted to develop an instrument that assesses intuitive eating which is a type of adaptive eating. Her study was based on three central features of intuitive eating: (a) unconditional permission to eat when hungry and what food is desired, (b) eating for physical rather than emotional reasons, and (c) reliance on internal hunger and satiety cues to determine when and how much to eat (Tylka, 2006). These features later became the three factors of Intuitive Eating Scale. These three first-order factors loaded on a higher-order intuitive eating factor.
The IES is a scale based on these three factors and has 21 items. It has been validated in a sample of college women. Its psychometric properties are good. It is stable over a 3-week period, the relationship between first and second administration found to be .90. Also, the scale has been found to be internally consistent (α= .85) (Tylka, 2006).
1.5 THE INTUITIVE EATING SCALE - 2
Tylka and Kroon Van Diest developed the IES-2 (Tylka & Kroon Van Diest, 2013). There are several reasons why the original IES did not seem inadequate. First, these researchers thought the IES did not assess an important component of intuitive eating, which is gentle nutrition. Gentle nutrition can be explained as the tendency to choose food to honor health and body functioning as well as good taste. This is added as the fourth factor (Body-Food Choice Congruence). Second, they thought that the majority of the items in the IES assessed the absence of intuitive eating. In developing the IES-2 they added items that assess the presence of intuitive eating. Also the items that assessed the absence of intuitive eating were reverse-scored. Since reverse scoring made the scoring process more complicated, all new items were designed to be positively scored. Lastly, since Cronbach’s alpha for the original RHSC subscale was low to mid .70s, they added and replaced some items to improve its internal consistency. As a result, Tylka and Kroon Van Diest added 17 more items and one more
factor to the original IES. Its psychometric properties were evaluated in a larger sample and male participants were also included. After factor analysis, 15 items were deleted and the final 23 items remained (11 original, 12 newly developed items). It has 4 first-order factors and these factors load on a higher-order intuitive eating factor. The present study is conducted with this 23-item, 4-factor Intuitive Eating Scale-2.
1.6 PRESENT STUDY
Although there are numerous studies on and various scales measuring eating disorder symptomatology, adaptive eating has not received that much research attention. Consistent with the research trend in the world, in Turkey eating behaviors are usually assessed with scales that aim to distinguish disturbed and non-disturbed eating. The scales that were adapted to Turkish like EAT-40 (Erol & Savaşır, 1989), EAT-26 (Ergüney-Okumuş & Sertel-Berk, 2016) and EDE-Q (Yücel, Polat, İkiz, Pirim-Düşgör, Yavuz & Sertel-Berk, 2011) are all examples of such scales and to my knowledge there are no scales in Turkish to assess adaptive eating patterns independent from pathology. As mentioned above, low ED symptomatology does not mean that the person has healthy eating behaviors. Adaptive eating is an independent concept. Intuitive eating approaches are important especially for people who have binge eating patterns. According to Güneri Akay (2016), the adaptation of the IES-2 to Turkish is important because it will give a chance to compare intuitive eating behaviors in Turkey with international data. Also it will provide an opportunity to identify individuals who do not have the ability to distinguish physical hunger from emotional hunger. Clinically, it will be possible to intervene these individuals before they are diagnosed with eating disorders. This is especially important in Turkey since a 2010 study claims that obesity prevalence has increased to 42% in women and 26.9% in men (MedCHAMPS, 2011). If clinicians can intervene before diagnosis, programs like health at every size (mentioned above) can be implemented and more serious health risks can be prevented beforehand.
1.6.1 Hypotheses. 1.6.1.1 Study 1
a. Intuitive eating will be higher in men than women. Although the media affect both men and women, in the modern world, women get more affected by the thin ideal that is promoted by the media. Thus, I hypothesize that women will have lower intuitive eating scores.
b. Intuitive eating will not increase linearly with age, especially for women. Recent studies have found that women between the ages 18-36 gain more weight than younger or older age categories of women. It is claimed that this weight gain might be related to contraception use, university transitions, eating fast food and quitting smoking (Wane, van Uffelen & Brown, 2010). It is possible that women in these ages are more likely to have dieting behaviors. Thus, I expect that women in mid 20’s and 30’s will have the lowest IES-2 total score.
c. In the previous studies (Tylka, 2006; Tylka & Kroon Van Diest, 2013; Camilleri et al., 2015) score on the IES-2 was found to correlate positively with different types of psychological well-being indices. I expect that this pattern will be seen in this study too. Thus, the IES-2 will be correlated positively with the Rosenberg Self-Esteem Scale and the IES-2 will be correlated negatively with EAT-26, Maudsley Obsessive-Compulsive Inventory and Social Physique Anxiety Scale; these scales assess disordered eating, obsessive thoughts and social anxiety about body, respectively.
d. The IES-2 will be negatively correlated with participants’ BMI, since higher BMI indicates elevated weight.
1.6.1.2 Study 2.
e. After confirmatory factor analysis, the overall model would provide a good fit to the data in a different sample.
f. The first-order factors would load on a second-order intuitive eating factor.
CHAPTER 2: STUDY 1
2.1 METHOD2.1.1 Participants
Anyone above the age of 18 was eligible to participate in this study. The participants were contacted through Internet and the scales were uploaded on Survey Monkey. Convenience sampling was used. 342 people participated to the study. 264 completed surveys were eligible for the analysis. Of these 264 participants, 217 were women (82.20%) and 47 (17.80%) were men. Ages of participants varied between 18 and 66 (M= 33.56, SD= 12.83). 143 (54.2%) of the participants were either bachelor’s level students or graduates, 103 (39%) were master or doctorate level students or graduates. Only 15 (5.7%) were high school graduates. Remaining 3 participants (1.1%) reported to have higher education level than doctorate level. 93 (35.2%) of the participants were married and 171 (64.8%) of them were unmarried. In all participants, minimum weight was 40 kg and maximum weight was 115 kg (M=64.90, SD=13.08). From all participants, minimum height was 150 centimeters and maximum height was 191 centimeters. Mean height of the participants was 166.4 and the standard deviation was 7.67. The participants only reported their height and weight in demographic information form. Their BMI was calculated by the researcher with this formula in SPSS: (weight in kilograms)/(height in meters)²
89 (33.7%) participants were university students. 225 (85.2%) participants reported that they do not diet whereas 39 (14.8%) participants reported that they diet. When asked about the health problems in the last 6 months (participants had the chance to choose more than one option), 0.8% indicated that they had a traffic accident, 16.3% indicated that gained or lost excessive weight, 0.8% indicated that they had an important surgery, 27.3% indicated that they had psychological problems and 56.8% indicated that they had other unspecified problems. 6.81% indicated that they did not have any health related problems in the last 6 months.
63.6% percent of the participants lived with their families, followed by 9.5% living alone, 9.1% living with friends, 8.7% living in a dormitory. 9.1% chose ‘other’ in which most participants indicated that they live with their partners or relatives. Monthly household income of the participants was less than 1000 Turkish Liras for 0.8%, 1000-2999 Turkish Liras for 9.1%, 3000-4999 Turkish Liras for 20.1%, 5000-6999 Turkish Liras for 18.2%, 7000-8999 Turkish Liras for 10.2%, 9000-9999 Turkish Liras for 5.3% and more than 10000 Turkish Liras for 36.4%.
2.1.2 Instruments
2.1.2.1 Informed Consent Form
There was an informed consent form that the participants signed before enrolling in the study. Although the aim of the study was not extensively explained in this form, the participants knew that the study was about eating attitudes. The participants were informed that if they were interested in the study, the debriefing could be done via e-mail.
2.1.2.2 Demographic Information Form
The data were collected anonymously, so the form did not ask for a name. The form included questions about participants’ age, gender, self-reported height and weight, education, marital status, health status, the people they live with and monthly household income.
2.1.2.3 The Intuitive Eating Scale – 2 (IES – 2)
The IES-2 was originally developed by Tylka and Kroon Van Diest (2013). It includes 4 factors: 1) Eating for Physical Rather Than Emotional Reasons, 2) Unconditional Permission to Eat, 3) Reliance on Hunger and Satiety Cues, 4) Body-Food Choice Congruence. The first three factors are present in the first version of the IES (Tylka, 2006) but fourth factor is recently added to the scale. There are 23 items that are scored in 5-Likert-type scale. There is a total intuitive eating score and higher scores indicate greater level of intuitive eating. The IES-2 has good psychometric properties (α= .87 for women, α=.89 for men).
7- I find myself eating when I’m feeling emotional (e.g., anxious, depressed, sad), even when I’m not physically hungry.
8- I find myself eating when I am lonely, even when I’m not physically hungry.
9- I use food to help me soothe my negative emotions.
10- I find myself eating when I am stressed out, even when I’m not physically hungry.
11- I am able to cope with my negative emotions (e.g., anxiety, sadness) without turning to food for comfort.
12- When I am bored, I do NOT eat just for something to do. 13- When I am lonely, I do NOT turn to food for comfort.
14- I find other ways to cope with stress and anxiety than by eating. Unconditional Permission to Eat has six items:
1- I try to avoid certain foods high in fat, carbohydrates, or calories. 2- I have forbidden foods that I don’t allow myself to eat.
3- I get mad at myself for eating something unhealthy. 4- If I am craving a certain food, I allow myself to have it. 5- I allow myself to eat what food I desire at the moment.
6- I do NOT follow eating rules or dieting plans that dictate what, when, and/or how much to eat.
Relying on Hunger and Satiety Cues has six items: 15- I trust my body to tell me when to eat. 16- I trust my body to tell me what to eat. 17- I trust my body to tell me how much to eat. 18- I rely on my hunger signals to tell me when to eat.
19- I rely on my fullness (satiety) signals to tell me when to stop eating.
20- I trust my body to tell me when to stop eating. Body-Food Choice Congruence has three items:
21- Most of the time, I desire to eat nutritious foods.
22- I mostly eat foods that make my body perform efficiently (well). 23- I mostly eat foods that give my body energy and stamina.
The full table of translated items can be found in Appendix F. 2.1.2.4 Turkish Version of the IES-2
The original IES-2 was forward translated to Turkish by the author. The advisor, fluent in English and a second scholar whose native language is English performed the back translations. The author and the advisors compared the back translations with the original scale and fine-tuned the translation. Dr. Tracy Tylka who developed the original IES scale (Tylka, 2006) and took part in the development process of the IES-2 (Tylka & Kroon Van Diest, 2013) supported the adaptation process and gave her suggestions about item arrangement. A pilot test was done and the last shape of the scale’s Turkish version was given.
2.1.2.5 Rosenberg Self-Esteem Scale
Rosenberg Self-Esteem Scale (RSES) (Rosenberg, 1965) is a self-report measure that aims to assess self-worth and self-acceptance. There are 10 items that are scored in 5-Likert-type scale (1-strongly disagree, 5- strongly agree). Higher scores mean higher self-esteem. RSES is a widely used scale in psychological research and has good psychometric values (α=.77).
RSES was standardized to Turkish by Çuhadaroğlu (1986) and the Turkish version also has high internal reliability (α=.82)
2.1.2.6 Maudsley Obsessive-Compulsive Inventory
Maudsley Obsessive-Compulsive Inventory (MOCI) aims to assess obsessive-compulsive behaviors and traits. It was originally developed by Hodgson and Rachman (Hodgson & Rachman, 1977). There are 30 items in true-false format (true answers are 1 point and false answers are 0 point) and it gives a total “obsessionality” score and subscale scores. There are four subscales in the original inventory: Checking, Cleaning, Slowness and Doubting.
MOCI was standardized to Turkish by Erol and Savaşır in 1988 (Erol & Savaşır, 1988). In this version, the authors added 7 more items from the Minnesota Multi Phasic Inventory (MMPI), making the total item
number 37. Also they added Rumination subscale. In this study only Checking and Rumination subscales (total of 11 items) were used since it was hypothesized that eating patterns would be mainly related to these two subscales.
2.1.2.7 EAT-26
EAT-26 is a self-report measure that aims to assess disturbances in eating patterns. There are 26 items that are scored in 6-Likert-type scale. The original scale was developed by Garner, Olmsted, Bohr and Garfinkel in 1982 (Garner, Olmsted, Bohr & Garfinkel, 1982). It is a shortened and more economic version of EAT-40 scale that was developed by Garner and Garfinkel (1979) and is highly correlated with EAT-40 (r = 0.98) (Garner, Olmsted, Bohr & Garfinkel, 1982). It has three factors: dieting, bulimia and food occupation and oral control. The cut-off score is 20, with scores above 20 showing the presence of disturbances in eating patterns. Although it is a shortened version of EAT-40, EAT-26 has good psychometric properties (α=.90).
EAT-26 is standardized to Turkish by Ergüney-Okumuş and Sertel-Berk (2016) and this version also has high internal reliability (α=.75). 2.1.2.8 Social Physique Anxiety Scale (SPAS)
Social Physique Anxiety Scale (SPAS) is a self-report measure that aims to assess individuals’ anxiety about their physical appearances. The original scale was developed by Hart, Leary and Rejeski (1989). There are 12 items that are scored in 5-Likert-type scale. The scores range from 12 to 60 and anxiety about physical appearance increases as the score increase. The scale has high internal reliability (α=.90).
SPAS was standardized to Turkish by Mülazımoğlu-Ballı and Aşçı (2006) and this version also has high internal reliability (α=.81 for girls, α=.77 for boys). In the Turkish version, the items are scored in 6-Likert-type scale.
2.1.3 Procedure
The data were collected via Survey Monkey. The link was distributed through social media, acquaintances of the author, and the
academic advisors. After informed consent form, the participants filled the different scales. Survey Monkey randomized the scale sequences. After the scales, the participants filled the demographic information form. 139 (52.65%) of the participants gave their e-mail addresses for a second application of the IES-2 in order to assess test-retest reliability. In this second application the participants only filled the IES-2 with no demographic information or other scales. The data was analyzed in SPSS 21.
2.2. RESULTS
2.2.1 Descriptive Statistics
Descriptive statistics of the scales with means and standard deviations for all study variables are listed in Table 1. It should be noted that all descriptive statistics were calculated after and according to exploratory factor analysis’ results.
Table 1
Descriptive Statistics for All Study 1 Variables
N Min. Max. Mean Std. Deviation IES-2 Total 264 1.57 4.86 3.37 0.64 EPR 264 1.00 5.00 3.25 1.03 UPE 264 1.00 5.00 3.35 0.73 RHSC 264 1.00 5.00 3.57 0.87 BFCC 264 1.00 5.00 3.29 0.90 Maudsley OCI 264 .00 10.00 3.62 2.70 Rosenberg SES 264 21.00 33.00 26.14 1.81 Social Physique Anxiety Scale 264 12.00 71.00 38.95 12.46 EAT-26 264 .00 41.00 10.54 8.17 BMI 262 15.06 37.11 23.33 3.97 Weight 262 40 115 64.90 13.08 Height 264 150 191 166.46 7.67
Men (M = 3.66, SD = 0.57) had higher total IES-2 scores than women (M = 3.31, SD = 0.64). This pattern was also visible in subscales and can be seen in Table 2 and 3. This can be related to the fact the women are
targeted more in the objectification process (mentioned above, Fredrickson & Roberts, 1997). Independent-Samples T-test was conducted to check if the gender difference in the IES-2 total scores was significantly different. Although there was an asymmetrical male-female distribution, Levene’s test for equality of variances revealed that equal variances could be assumed. T-test results revealed that the mean difference between male and female scores were statistically significant: t(262) = -3.41, p = 0.001.
Table 2
Means, Standard Deviations and Minimum-Maximum Values for Female Participants
N Minimum Maximum Mean Std. Deviation
IES-2 Total 217 1.57 4.86 3.31 0.64
EPR 217 1.00 5.00 3.13 1.02
UPE 217 1.00 5.00 3.33 0.69
RHSC 217 1.00 5.00 3.54 0.88
BFCC 217 1.00 5.00 3.27 0.90
One-way ANOVA was conducted to check the differences of the IES-2 total scores of age groups in each gender. Data were tested for normality and homogeneity of variance. In both female and male data the distribution was normal and the variances were homogenous. One-way ANOVA was used. A quadratic, non-linear trend was expected and the results revealed that the groups were significantly different and the trend was non-linear (F(1, 211) = 4.713, p = 0.03). Planned contrasts revealed
Table 3
Means, Standard Deviations and Minimum-Maximum Values for Male Participants
N Minimum Maximum Mean Std. Deviation
IES-2 Total 47 2.57 4.81 3.65 0.56
EPR 47 1.88 5.00 3.81 0.87
UPE 47 1.60 5.00 3.44 0.89
RHSC 47 2.00 5.00 3.71 0.81
that the age group of 26-35 had the lowest IES-2 scores among women (t(211)= 2.90, p = 0.004). In male data, there was no significant difference (F(1, 43) = 0.295, p = 0.59, t(43)= -0.676, p = 0.503). This may be caused by the fact that the total number of male participants was 47 and this might not give a reliable result about the difference among different age groups; however a non-linear pattern also existed in male data. Although not significantly different, age group of 36-45 had the lowest IES-2 scores among male participants.
Figure 2. Mean Scores for Female Participants
Figure 3. Mean Scores for Male Participants
60 62 64 66 68 70 72 74 18-25 26-35 36-45 46 and above 60 62 64 66 68 70 72 74 76 78 80 18-25 26-35 36-45 46 and above
2.2.2 Exploratory Factor Analysis
To assess the factor structure of the IES-2, exploratory factor analysis was conducted on 23 items. All the analyses were conducted in SPSS 21. Kaiser-Meyer-Olkin Measure of Sampling Adequacy was found to be 0.88, thus the data had adequate common variance allowing an EFA. The significance of Bartlett’s test of sphericity, χ2 (253) = 3901.316, p<0.001, suggested that the correlation matrix is factorable (Tabachnick & Fidell, 2007). Common factor analysis with principal axis factoring and direct oblimin rotation was used since the factors were expected to be correlated. Delta weight was specified to be 0 since this value allows moderate correlation between the factors. The number of factors was determined by factor eigenvalues above 1.0 and a noticeable change in the slopes within the scree plot (Tabachnick & Fidell, 2007).
Five factors had eigenvalues greater than 1.0. Initial eigenvalues and percentage of variance accounted for by each of these factors were 8.13 and 35.35% for Factor 1, 2.61 and 11.36% for Factor 2, 2.21 and 9.63% for Factor 3, 1.52 and 6.62% for Factor 4 and 1.14 and 4.97% for Factor 5. Together they accounted for 67.94% of the variance. In the scree plot, it was not clear where a notable change starts; after factor 3 or 4. So the factor analysis was run again and the number of factors was fixed to 3 and 4 respectively. In 3-factor structure the results were not interpretable since the items that were in the same factor were negatively correlated. That is why the factor number was fixed to 4 and the structure became interpretable.
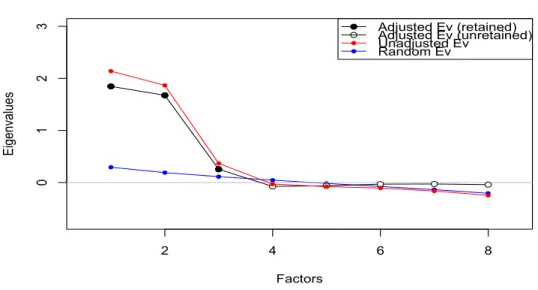
To be sure about the factor structure, a parallel analysis in R was conducted since it estimates the number of factors in a data set more accurately. Parallel analysis shows eigenvalues of existing data set along with random data set that has identical dimensionality and the intersection point is accepted as the appropriate factor number (Brown, 2006). Parallel analysis also suggested that the four factors should remain.
The factor-item structure is the same with original IES-2 factor-item structure. In interpreting the rotated factor pattern, items with a factor loading of 0.40 were considered to represent the factor (Camilleri et al., 2015). Two items were excluded. One of them was in Factor 4 (item 21- Most of the time, I desire to eat nutritious foods). The item had KMO value that is lower than 0.5 and thus it was dropped (Field, 2009). After this exclusion the factor analysis was computed again and this time item 6 (I do NOT follow eating rules or dieting plans that dictate what, when, and/or how much to eat) in Factor 2 had primary loadings less than .40 and it was also dropped.
The first factor is Eating for Physical Rather than Emotional Reasons and it is composed of items 7-8-9-10-11-12-13-14. The factor loadings change between 0.46 and 0.94. The item that has the biggest loading is 10. The second factor is Unconditional Permission to Eat and it is composed of items 1-2-3-4-5. The factor loadings change between 0.50 and 0.71. The item that has the biggest loading is 1. The third factor is Reliance
2 4 6 8 0 1 2 3 Parallel Analysis Factors Ei ge nv al ue s Adjusted Ev (retained) Adjusted Ev (unretained) Unadjusted Ev Random Ev
on Hunger and Satiety Cues and it is composed of items 15-16-17-18-19-20. The factor loadings change between 0.69 and 0.86. The item that has the biggest loading is 17. The fourth factor is Body-Food Choice Congruence and it is composed of items 22-23. The factor loadings are 0.77 and 0.96. The item that has the biggest loading is 22. Table 4 presents the pattern matrix of item-factor loadings of the IES-2.
! b le 4 -Fact or L oa d in gs o f th e IE S -2 tt er n M at ri x Fa ct or 1 2 3 4 - I fi nd m ys el f ea ti ng w he n I am s tre ss ed o ut , e ve n w he n I’m n ot p hy si ca ll y hu ng ry . .9 4 I fi nd m ys el f ea ti ng w he n I am lo ne ly , e ve n w he n I’m n ot p hy si ca ll y hu ng ry . .9 2 I us e fo od to h el p m e so ot he m y ne ga ti ve e m ot io ns . .9 2 I fi nd m ys el f ea ti ng w he n I’m f ee li ng e m ot io na l (e .g ., an xi ou s, d ep re ss ed , s ad ), e ve n w he n I’m n ot phys ic al ly hungr y. .8 8 - Wh en I a m lo ne ly , I d o N O T tu rn to f oo d fo r co m fo rt . .7 5 - I fi nd o th er w ay s to c op e w it h st re ss a nd a nx ie ty th an b y ea ti ng . .6 8 .1 6 .1 1 - Wh en I a m b or ed , I d o N O T e at ju st f or s om et hi ng to d o. .5 5 .1 6 - I am a bl e to c op e w it h m y ne ga ti ve e m ot io ns (e .g ., an xi et y, s ad ne ss ) w it ho ut tu rn in g to f oo d fo r co m fo rt . .4 6 .2 4 I try to a vo id c ert ai n fo od s hi gh in f at , c arb oh yd ra te s, o r ca lo ri es . -.1 1 .7 0 25
26 ! ! I ha ve f orb id de n fo od s th at I do n’t a ll ow m ys el f to e at . .1 5 .6 2 -.1 4 I al lo w m ys el f to e at w ha t f oo d I de si re a t t he m om en t. .5 5 .1 6 I ge t m ad a t m ys el f fo r ea ti ng s om et hi ng u nh ea lt hy . .1 5 .5 2 If I am c ra vi ng a c ert ai n fo od , I al lo w m ys el f to h av e it . -.1 0 .5 0 le te d) I do N O T f ol lo w e at in g ru le s or di et in g pl an s th at d ic ta te w ha t, w he n, a nd /o r ho w m uc h to e at . .1 2 .2 4 .1 6 -.1 2 - I tru st m y bo dy to te ll m e ho w m uc h to e at . .8 6 - I re ly o n m y hu ng er si gn al s to te ll m e w he n to e at . .8 6 - I tru st m y bo dy to te ll m e w he n to s to p ea ti ng . .8 4 - I re ly o n m y fu ll ne ss (s at ie ty ) si gn al s to te ll m e w he n to s to p ea ti ng . .7 8 - I tru st m y bo dy to te ll m e w he n to e at . .1 3 .7 1 - I tru st m y bo dy to te ll m e w ha t t o ea t. 23 I m os tl y ea t f oo ds th at g iv e m y bo dy e ne rg y an d st am in a. .1 0 .6 9 - I m os tl y ea t f oo ds th at m ak e m y bo dy p erf orm e ff ic ie nt ly (w el l). .9 6 - I tru st m y bo dy to te ll m e w he n to s to p ea ti ng . .7 7 bl e 4 co nt .
2.2.3 Reliability
2.2.3.1 Internal Reliability
The Cronbach’s Alpha of the overall IES-2 was computed to be .89. With regard to subscales Cronbach’s Alphas of .93 for Eating for Physical Rather than Emotional Reasons (EPR), .70 for Unconditional Permission to Eat (UPE), .92 for Reliance on Hunger and Satiety Cues (RHSC), .86 for Body-Food Choice Congruence (B-FCC) were computed.
2.2.3.2 Test-Retest Reliability
Test–retest reliability was computed by calculating the intra- class correlation coefficients (ICC) for the IES-2 scores (Shrout & Fleiss, 1979). This ICC was estimated from a one-way random effect ANOVA model with the participant as the random effect (Shrout & Fleiss, 1979).
Of the 264 participants, 58 completed the scale twice. Mean test-retest interval was 24.5 days (SD: 6.764, range:18-45 days). ICC were 0.89 for the IES-2 total score (95% CI: 0.82, 0.94), 0.87 for Eating for Physical Reasons (95% CI: 0.78, 0.92), 0.68 for Unconditional Permission to Eat (95% CI: 0.47, 0.81), 0.86 for Reliance on Hunger and Satiety Cues (95% CI: 0.77, 0.92) and 0.82 for Body-Food Choice Congruence (95% CI: 0.70, 0.89). These ICC indicated a high test–retest reliability for almost all scores except for Unconditional Permission to Eat where test– retest reliability was moderate.
2.2.4 Validity
2.2.4.1 Construct Validity
In the present study, construct validity was evaluated through the examination of the IES-2 subscales. The subscales were all found to have positive significant correlations with the total IES-2 mean. Only Unconditional Permission to Eat did not correlate or found to be negatively correlated with other factors. The possible reason for that is discussed in the discussion. The findings are presented in Table 5.
Table 5
Correlations of the IES-2 Total Scores and the IES-2 Subscale Scores IES-2 Total EPR UPE RHSC BFCC
IES-2 Total 1 .89** .34** .80** .36** EPR .89** 1 .08 .57** .27** UPE .34** .08 1 .11 -.17** RHSC .80** .57** .11 1 .28** BFCC .36** .27** -.17** .28** 1 ** p < 0.01 2.2.4.2 Criterion Validity
To determine the criterion validity, the correlations between the total IES-2 scores and scores of Rosenberg Self-Esteem Scale, EAT-26, Maudsley Obsessive-Compulsive Inventory and Social Physique Anxiety Scale were calculated. Negative correlations were expected between the IES-2 scores and subscale scores and scores of EAT-26, Maudsley Obsessive-Compulsive Inventory and Social Physique Anxiety Scale and the participants’ BMI. On the other hand, positive correlation was expected between the IES-2 scores and Rosenberg Self-Esteem Scale since RSES is a scale that measures psychological well-being. Table 6 shows that the data were in the expected pattern.
Table 6
Correlation of the IES-2 Scores, Maudsley Obsessive Compulsive Inventory, Rosenberg Self-Esteem Scale, Social Physique Anxiety Scale, EAT-26 and Participants’ BMI ** p < 0.01 IES-2 Total Maudsley OCI Rosenberg SES Social Physique Anxiety Scale EAT-26 BMI IES-2 Total 1 -.30** .33** -.63** -.26** -.25** Maudsley OCI -.30 ** 1 -.27** .33** .22** .01 Rosenberg SES .33 ** -.27** 1 -.40** .00 .01 Social Physique Anxiety Scale -.63** .33** -.40** 1 .37** .26** EAT-26 -.26** .22** .00 .37** 1 .05** BMI -.25** .01 .01 .26** .05** 1
CHAPTER 3: STUDY 2 – CONFIRMATORY FACTOR
ANALYSIS OF THE IES-2
In Study 2, a confirmatory factor analysis was conducted to determine if the 21-item, 4-factor structure would be confirmed in a different sample. Also, a second-order confirmatory factor analysis was conducted to see if first-order factors load on a higher-order intuitive eating factor.
To be sure that Sample 1 and Sample 2 does not have significant differences on the IES-2 total score, EPR, UPE, RHSC, B-FCC scores, weight and height independent-samples T-test was conducted. The results revealed that the groups did not have significant differences in any of these measures except height.
3.1 METHOD 3.1.1 Participants
Anyone above the age of 18 was eligible to participate in this study. The participants were contacted through Internet and the scales were uploaded on Survey Monkey. Convenience sampling was used. 338 people participated to the study. 271 completed surveys were eligible for the analysis. Of these 271 participants, 227 were women (83.8%) and 42 (15.5%) were men. 2 (0.7%) people classified their gender as ‘other’. Ages of participants varied between 18 and 63 (M = 28.22, SD = 11.30). 181 (66.8%) of the participants were either bachelor’s level students or graduates, 77 (28.4%) were master or doctorate level students or graduates. 161 (59.4%) participants were university students. Only 13 (4.8%) were high school graduates. 39 (14.4%) of the participants were married and 232 (85.6%) of them were unmarried. From all participants, minimum weight was 40 kg and maximum weight was 117 kg (M = 63.25, SD = 12.98). From all participants, minimum height was 150 centimeters and maximum height was 192 centimeters (M = 167.8, SD = 7.54). 209 (77.1%) participants reported that they did not diet whereas 62 (22.9%) participants reported that they dieted. When asked about the health problems in the last 6 months (participants had the chance to choose more than one option), 0.7%
indicated that they had a traffic accident, 11.1% indicated that gained or lost excessive weight, 2.2% indicated that they had an important surgery, 21.4% indicated that they had psychological problems and 8.9% indicated that they had other unspecified problems. 65.7% indicated that they did not have any health related problems in the last 6 months. 63.1% percent of the participants live with their families, and this is followed by 14% living alone, 10.7% living with friends, 6.3% living in a dormitory. 5.9% chose ‘other’ in most participants indicated that they live with their partners or relatives. Monthly household income of the participants was less than 1000 Turkish Liras for 0.7%, 1000-2999 Turkish Liras for 9.6%, 3000-4999 Turkish Liras for 18.1%, 5000-6999 Turkish Liras for 22.5%, 7000-8999 Turkish Liras for 13.7%, 9000-9999 Turkish Liras for 8.5% and more than 10000 Turkish Liras for 26.9%.
3.1.2 Instruments
3.1.2.1 Informed Consent Form
There was an informed consent form that the participants signed before enrolling in the study. Although the aim of the study was not extensively explained in this form, the participants knew that the study was about eating attitudes. The participants were informed that if they were interested in the study, the debriefing could be done via e-mail.
3.1.2.2 Demographic Information Form
The data were collected anonymously, so the form did not ask for a name. The form included questions about participants’ age, gender, self-reported height and weight, education, marital status, health status, the people they live with and monthly household income.
3.1.2.3 Turkish Version of the IES-2
Turkish version of the IES-2 that was used in Study 1 was used in this study.
3.1.3 Procedure
The data were collected via Survey Monkey. The link was distributed through social media and acquaintances of the author and the advisors. After informed consent form, the participants filled the Turkish
version of the IES-2. After that, the participants filled the demographic information form. The data was analyzed in SPSS 21, R 3.3.3 and R Studio 1.0.136.
3.2. RESULTS
3.2.1 Descriptive Statistics
Descriptive statistics with means and standard deviations for all study variables are listed in Table 7.
Table 7
Descriptive Statistics for All Study 2 Variables
Min. Max. Mean Std. Dev.
IES-2 TOTAL 1.62 4.67 3.33 0.53 EPR 1.00 5.00 3.30 0.86 UPE 1.20 5.00 3.22 0.77 RHSC 1.00 5.00 3.47 0.76 BFCC 1.00 5.00 3.29 0.80 BMI 15.9 39.1 22.35 3.75 Weight 40 117 63.25 12.98 Height 150 192 167.80 7.54
3.2.2 Confirmatory Factor Analysis
The CFA aimed to test whether the four-factor model would be confirmed in a different data set. CFA was conducted in R 3.3.3 and R Studio 1.0.136. Since the data was ordinal, Unweighted Least Squares (ULS) was used as the estimation method as ULS provides more accurate and less variable parameter estimates and more precise standard errors and better coverage rates (Forero, Maydeu-Olivares & Gallardo-Pujol, 2009; Koğar & Yılmaz Koğar, 2015). In the French adaptation of the IES-2, Camilleri et al. (2015) also used ULS as the estimation method (Camilleri et al., 2015).
According to Brown (2006), good model fit should have these properties: RMSEA (≤ .06, 90% CI ≤ .06, CFit ns), SRMR (≤ .08), CFI (≥ .95), and TLI (≥ .95) (Brown, 2006). Considering these values, the
adequate fit to the data: RMSEA = 0.057 (90% CI= 0.048-0.066), SRMR = 0.07, CFI = 0.98, TLI = 0.97.
To see if it was possible to improve the model fit, modification indices that bigger than 10 were checked. The largest indices suggested that items 3 and 12 might have double loading. To be sure about the possible double loading of these items, EFA results were checked once again and it was seen that these items loaded only on their own factors. The other items that had high modification indices were also checked and it was seen that items 4 and 5, 15 and 18, 19 and 20, 7 and 10, and 15 and 19 had similarly worded phrases. Tylka and Kroon Van Diest (2013) also hypothesized that these items would share method variance because of similar wording. That is why correlated errors between these items were estimated in this study too (Tylka & Kroon Van Diest, 2013). After these estimations, CFA was conducted again and all the goodness of fit indices got much better results and the data had better fit. First order CFA results and modified results are given in Table 8.
Table 8
Goodness of Fit Indices for Various Statistical Models of CFA for the IES-2
Model χ2 df χ2/df CFI TLI RMSEA 90% CI SRMR
Four Factors/ Second-Order 344.068 183 0.44 0.98 0.97 0.057 0.048-0.066 0.07 Four Factors-modified/ Second-Order 280.137 178 1.57 0.99 0.98 0.046 0.036- 0.056 0.06
Second-order CFA was conducted to see if four factors load on a higher intuitive eating factor. Two of the goodness of fit indices were a bit higher than the accepted baselines (RMSEA=0.073, 90% CI= 0.065-0.082), and SRMR=0.082). The others were acceptable (CFI=0.962, TLI=0.957). Modification indices were checked to see if it is possible to make the data fit better and once again it was seen that the largest modification indices were