Clinical Study
Is Mean Platelet Volume Really a Severity Marker for
Obstructive Sleep Apnea Syndrome without Comorbidities?
Sinem Nedime Sökücü,
1Cengiz Özdemir,
1Levent Dalar,
2Levent Karasulu,
1Fenay AydJn,
1and Sedat Alt
Jn
11Sleep Laboratory, Yedikule Chest Disease and Thoracic Surgery Training and Research Hospital, Zeytinburnu, Istanbul, Turkey 2Department of Pulmonary Medicine, School of Medicine, Istanbul Bilim University, Sisli, 34600 Istanbul, Turkey
Correspondence should be addressed to Sinem Nedime S¨ok¨uc¨u; [email protected]
Received 29 June 2014; Revised 20 August 2014; Accepted 22 August 2014; Published 17 September 2014 Academic Editor: Charlie Strange
Copyright © 2014 Sinem Nedime S¨ok¨uc¨u et al. This is an open access article distributed under the Creative Commons Attribution License, which permits unrestricted use, distribution, and reproduction in any medium, provided the original work is properly cited.
Obstructive sleep apnea syndrome (OSAS) is a common disorder that can lead to significant cardiovascular complications. Several studies have reported increased platelet activation and aggregation in patients with OSAS. In this study we aimed to show a correlation between mean platelet volume (MPV) and severity of OSAS in patients with OSAS without any overt cardiac disease or diabetes. The polysomnography recordings of 556 consecutive patients admitted to the sleep laboratory between January 2012 and July 2012 were retrospectively evaluated. The relationship between polysomnographic parameters and biochemical parameters was assessed. Polysomnographic results of 200 patients (154 males [77%]; mean age, 44.5± 11.4 years) were included. No correlation was observed between MPV and the average oxygen saturation index, the minimum desaturation index, or the oxygen desaturation index in the study population as well as in severe OSAS group (AHI> 30). The only correlation was found between MPV and AHI in the severe OSAS group(𝑃 = 0.010). MPV was not correlated with OSAS severity in patients without any overt cardiac disease or diabetes. These findings raise doubts about the suggestion that MPV might be a marker for OSAS severity, as recommended in earlier studies. Thus, further prospective data are needed.
1. Introduction
Obstructive sleep apnea (OSA) is characterized by recurrent episodes of partial or complete upper airway obstruction during sleep. It occurs as combined episodes of apnea and hypopnea that cause sleep fragmentation or excessive daytime sleepiness. It is a common disorder affecting 2% and 4% of middle aged women and men, respectively [1]. The severity of OSAS is estimated by the number of apnea-hypopnea episodes per hour of sleep and is expressed as the apnea-hypopnea index (AHI) [2]. Although the underlying mechanisms and etiologies are not completely understood, OSAS can lead to significant cardiovascular complications [3], including heart failure, acute myocardial infarction, arrhythmias, hypertension, pulmonary hypertension, and stroke [4]. Increased platelet activation and aggregation are closely related to cardiovascular complications [5]. Several
studies have reported increased platelet activation and aggre-gation in patients with OSAS [6,7].
It has been shown that platelet size, measured by mean platelet volume (MPV), correlates with platelet reactivity and is an easy and useful tool for indirect monitoring of platelet activity. Larger platelets have higher thrombotic potential [8]. MPV plays an important role in the pathophysiology of cardiovascular diseases [8, 9]. The association between increased platelet activation and aggregation is closely asso-ciated with cardiovascular complications. Increased MPV occurs in patients with hypertension, hypercholesterolemia, diabetes mellitus, acute myocardial infarction, acute ischemic stroke, and coronary artery calcification [10,11].
The relationship between MPV and disease severity in patients with OSAS has been evaluated and MPV increases in patients with OSAS when used as an indicator of platelet acti-vation [12,13]. Continuous positive airway pressure (CPAP)
Volume 2014, Article ID 754839, 7 pages http://dx.doi.org/10.1155/2014/754839
therapy is shown to decrease platelet activation in patients with OSAS [14,15]. In this study, relation between MPV and severity of OSAS in nondiabetic patients without any overt cardiac disease was evaluated.
2. Patients and Methods
2.1. Patients. A total of 556 patients consecutively admitted to the sleep laboratory between January 2012 and July 2012 who are with symptoms of nocturnal snoring and/or excess daytime sleepiness and who underwent a polysomnographic evaluation were retrospectively evaluated. Patients having AH˙I< 5 were grouped as control and others were grouped according to their AHI value as mild, moderate, and severe OSAS.
Inclusion criteria were patients who are with symptoms of nocturnal snoring and/or excessive daytime sleepiness and who underwent polysomnographic evaluation at our sleep laboratory. Exclusion criteria were any known cardiac disease (congestive heart failure, ischemic vascular disease, or arrhythmias), lung disease (chronic obstructive pulmonary disease and asthma), diabetes mellitus (defined as fasting plasma glucose>126 mg/dL and/or antidiabetic treatment), chronic renal or hepatic diseases, use of acetylsalicylic acid or any other antiaggregant therapy (dipyridamole, ticlo-pidine, and clopidogrel) within the last month, abnormal haematocrit and/or abnormal white blood cell count and/or abnormal platelet number, and pure or mainly central apnea on a polysomnographic evaluation. The cardiac disease his-tory evaluation was conducted through a detailed medical history and an evaluation of earlier ECGs, tests, and coronary angiography. Use of acetylsalicylic acid or other antiaggregant therapy was evaluated not only by history taking but also by assessing 3 months of pharmacy records. Rapid eye move-ment (REM) induced OSAS and positional OSAS patients were excluded from the study because in those patient groups severity of the disease changes day to day depending on the REM percentage of the sleep and time duration spent in supine position. For our study the definition of positional OSAS is accepted as total AHI > 5, nonsupine AHI < 5, and supine AHI/nonsupine AHI≥ 2. The definition of REM-OSAS is accepted as total AHI> 5, REM AHI < 5, and REM AHI/non-REM AHI≥ 2.
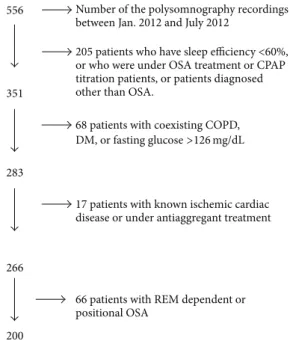
In total, 200 of the 556 met the inclusion and exclusion criteria and were enrolled in the study (Figure 1). Detailed medical history, physical examination, electrocardiogram (ECG), and chest X-ray were assessed from the patient folders. This retrospective study protocol was approved by the institutional ethics committee. Informed written consent was obtained from all subjects before the polysomnography.
2.2. Procedure. Standard overnight polysomnography was performed in all patients using an Embla N7000 (Embla, Medcare Flaga, Iceland) data acquisition and analysis system in the sleep laboratory from 22.00 to 06.00 h. The physiolog-ical signals monitored included EEG (C4-M1, C3-M2, O2-M1, and O1-M2), electrooculography, and submental EMG. The following were also measured: ribcage and abdominal effort measured by respiratory inductive plethysmography
556
351
283
266
200
205 patients who have sleep efficiency <60%, or who were under OSA treatment or CPAP titration patients, or patients diagnosed other than OSA.
68 patients with coexisting COPD,
17 patients with known ischemic cardiac disease or under antiaggregant treatment
66 patients with REM dependent or positional OSA
Number of the polysomnography recordings between Jan. 2012 and July 2012
DM, or fasting glucose>126 mg/dL
REM: rapid eye movement
Figure 1: Exclusion chart of patients.
(RIP) (XactTrace, Medcare Flaga), body position, measured by calibrated sensor, snoring sound measured with a piezo-electric sensor, and oronasal flow measured with a nasal pressure cannula (Medcare Flaga), SpO2(8000J, Nonin Med-ical, Plymouth, MN, USA) with averaging time set at 3 seconds. The ECG (lead II) was sampled at 512 Hz. Sleep stages and arousals were scored using the Somnologica Studio software package (Medcare Flaga) according to standard criteria [16] by two experienced scorers who had 80–95% concordance with each other. Respiratory events were scored as follows. Apnea was defined as a cessation of airflow for≥10 seconds. Apnea was classified as obstructive in the presence of continued movement in the RIP and as central in the absence of movement in the RIP. Hypopnea was defined as a≥50% reduction in oronasal flow amplitude ≥10 seconds, accompanied by≥3% desaturation or arousal. Classification of a hypopnea as obstructive, central, or mixed performed calibrated respiratory inductance plethysmography. Hypop-nea was classified as obstructive in the presence of continued movement in the RIP [16]. The oxygen desaturation index (ODI) is the number of times per hour of sleep in which the blood’s oxygen level drops by 3 percent or more from baseline.
2.3. Blood Assays. Fasting (8 hours) venous blood samples were drawn from the antecubital vein between 7 and 8 AM after polysomnography and after a 20 min rest. Tripotas-sium ethylenediaminetetraacetic acid based anticoagulated blood samples were drawn and assessed within 30 minutes. Complete blood count analyses were performed using the Abbott Cell-Dyne 3700 System (Abbott Diagnostics, Santa Clara, CA, USA) and biochemical analyses were performed
using the Olympus AU2700 Plus Analyzer (Beckman Coulter, Tokyo, Japan).
2.4. Statistical Analysis. The statistical analysis was per-formed with SPSS for Windows version 16.0 (SPSS, Chicago, IL, USA). All variables were tested for normality with the Kolmogorov-Smirnov test. Normally distributed continuous variables are expressed as mean± standard deviation. Non-normally distributed continuous variables are summarized as medians.
Categorical variables are expressed as numbers (per-centages). Comparisons between independent groups were made using the Mann-Whitney𝑈 test. Correlations between noncontinuous variables and continuous variables with a nonnormal distribution were assessed using Spearman’s cor-relation. Correlations between continuous variables were assessed using Pearson’s correlation. Comparisons between groups were evaluated by one-way analysis of variance fol-lowed by the Bonferroni method. A𝑃 < 0.05 was considered statistically significant.
3. Results
A total of 200 patients were included (154 males [77%]; mean age, 44.5 ± 11.4 years). The study subjects were categorized into four groups according to AHI (<5, normal; 5–15, mild OSAS; 15–30, moderate OSAS;>30, severe OSAS). As the severity of OSAS increased, male, older, heavier, and smoker patients became predominant (Table 1). A significant difference was found between cases with AHI< 5 and those with severe OSAS (AHI > 30) in terms of sex, age, body mass index (BMI), smoking ratio, and pack-year smoking history (𝑃 = 0.001, 𝑃 = 0.014, 𝑃 = 0.001, 𝑃 = 0.231, and𝑃 = 0.015, resp.). No difference was found in terms of hypertensive patient ratios between the groups.
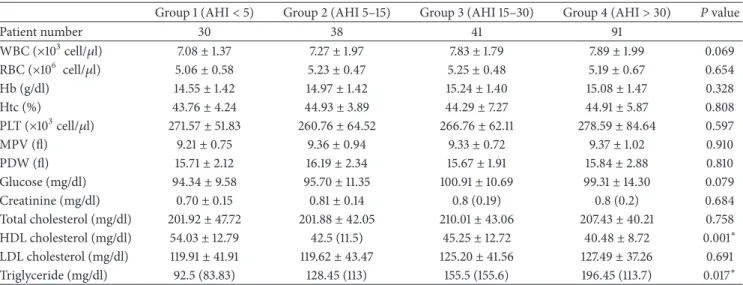
The polysomnographic characteristics of the groups are shown in Table 2. No differences were observed between the controls and patients with mild, moderate, or severe OSAS according to white blood cells, red blood cells, haemoglobin, haematocrit, platelets, MPV, platelet distri-bution width (PDW), glucose, creatinine, total cholesterol, or low-density lipoprotein cholesterol (Table 3). Both high-density lipoprotein (HDL) and triglycerides were signifi-cantly higher in the severe OSAS group, as compared to those in the normal population (𝑃 = 0.001 and 𝑃 = 0.013).
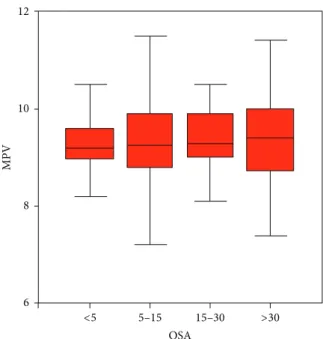
No correlation was observed between MPV and AHI, average saturation, minimum desaturation, time duration with SpO2 < 90%, oxygen desaturation index, or OSAS groups in the whole patient population (Table 4) (Figure 2). Also no correlation was found between MPV and average saturation, minimum desaturation, or the oxygen desatura-tion index in the severe OSAS subgroup. A correladesatura-tion was found between MPV and AHI in the severe OSAS group (𝑃 = 0.010) (Table 5). No correlation was found between MPV and smoking history (𝑃 = 0.240) and sex (𝑃 = 0.887).
4. Discussion
The only correlation that was found in our study is that MPV is positively correlated with AHI in severe OSAS group
12 10 8 6 <5 5–15 15–30 >30 MPV OSA
Figure 2: Box plot graphic of MPV and OSAS groups.
but no significant relationship between OSAS and hypoxia parameters and MPV or PDW was found. Results of earlier studies conducted in nondiabetic subjects with OSAS showed that MPV and PDW are associated with the degree of hypoxia and OSAS severity. These results underline the importance of OSAS as a risk factor for vascular atherothrombotic disease and MPV as a risk factor [12,13]. However, the relationship between OSAS severity and MPV could disappear if a more detailed history was taken, and all patients with cardiac and lung diseases were excluded.
MPV reflects platelet activity. The exact mechanism of platelet activation in patients with OSAS is unclear but possible mechanisms are an indirect effect of increased sym-pathetic activation causing catecholamine discharge that acti-vates platelets, chronic intermittent hypoxia causing platelet activation directly, and chronic inflammation [17, 18]. In a previous study, a significant difference was found between the control group and severe OSAS in terms of MPV values, and severe OSAS was independently correlated with AHI and the desaturation index in a multivariate regression analysis. We found no correlation between any group in terms of MPV, AHI, or the desaturation index [12]. We only found a correlation between MPV and AHI in patients with severe OSAS. Also an explanation for this could be that in our control and mild OSAS groups ODI and time duration with Sat 02<90% were relatively less compared to severe OSAS group. In a recently published study, MPV was not found to be different in mild and moderate OSAS but it was significantly high in severe OSAS. Also as reported by Karakas et al. in our study desaturation ratios were found to be similar in mild and moderate OSAS. [19]. This could be because of the fact that as the severity of the disease increases, patients become more prone to cardiovascular risks so we did not observe this relation in mild and moderate OSAS groups. As the disease severity increases, systemic inflammation also increases and
Table 1: Demographic and anthropometric characteristics of the patients.
Group 1 (AHI< 5) Group 2 (AHI 5–15) Group 3 (AHI 15–30) Group 4 (AHI> 30) 𝑃 value
Patient number 30 38 41 91
Sex (male %) 15 (50%) 30 (78.9%) 33 (80.5%) 76 (83.5%) 0.002∗
Age (years) 38.43± 12.79 43.50± 12.15 47.27± 10.95 45.64± 10.15 0.006∗
Hypertension (%) 4 (13.3%) 8 (21.1%) 8 (19.5%) 23 (25.3%) 0.566
Smokers (%) 14 (46.7%) 18 (47.4%) 20 (48.8%) 62 (68.1%) 0.037∗
Pack-year smoking history 1.5 (10) 1.5 (17.25) 2.0 (15) 15 (24) 0.001∗
Patient number 30 38 41 91
BMI (kg/m2) 26.91± 4.61 29.10± 4.51 30.01± 4.52 31.75± 4.53 0.001∗
Neck circumference (cm) 35.55± 3.63 38.45± 3.31 39.33± 3.31 40.71± 7.89 0.001 Waist circumference (cm) 92.17± 10.96 98.68± 8.76 101.61± 9.33 104.19± 14.26 0.001 Hip circumference (cm) 101.16± 7.35 103.74± 6.59 106.85± 16.54 107.98± 7.78 0.006
Waist to hip ratio 0.91± 0.075 0.95± 0.066 0.96± 0.099 0.97± 0.115 0.062
∗P< 0.05.
Table 2: Sleep characteristics of the patients.
Group 1 (AHI< 5) Group 2 (AHI 5–15) Group 3 (AHI 15–30) Group 4 (AHI> 30) 𝑃 value
Patient number 30 38 41 91 TST (min) 415.15± 50.81 383.33± 54.11 386.55± 57.39 380.59± 64.38 0.05 Sleep efficiency (%TST) 86.52± 9.09 80.47± 10.09 80.79± 10.03 83.03± 10.24 0.052 Stage 1 (%TST) 5.34± 1.92 6.72± 2.47 7.52± 2.87 10.6 (9.1) 0.001∗ Stage 2 (%TST) 51.98± 7.16 52.09± 6.53 50.83± 9.83 53.37± 10.26 0.510 Stage 3 (%TST) 20.86± 6.70 19.98± 7.19 21.00± 9.53 16 (13.2) 0.001∗ REM (%TST) 21.56± 6.32 20.72± 5.72 20.64± 6.57 17.08± 7.17 0.001∗ AHI (events/hour) 2.84± 1.41 9.58± 2.91 21.12± 3.88 54.17± 18.81 0.001∗ Average SpO2 (%) 96.79± 1.47 94.13± 12.65 95.35± 1.59 95.17± 1.54 0.296 Minimum SpO2(%) 91.70± 3.88 88.55± 4.72 82.29± 12.82 74.98± 14.09 0.001∗ Time duration with SpO2< %90 0.001 (0.001) 1.78± 4.04 3.5 (9.25) 23.1 (71.9) 0.001∗
ODI 1.5 (2.57) 7 (7.47) 20.85± 6.16 49.42± 20.41 0.001∗
TST: total sleep time; AHI: apnea hypopnea index; REM: rapid eye movement; AHI: apnea-hypopnea index; ODI: oxygen desaturation index;∗P< 0.05.
Table 3: Full blood count and biochemical characteristics of the groups.
Group 1 (AHI< 5) Group 2 (AHI 5–15) Group 3 (AHI 15–30) Group 4 (AHI> 30) 𝑃 value
Patient number 30 38 41 91 WBC (×103cell/𝜇l) 7.08± 1.37 7.27± 1.97 7.83± 1.79 7.89± 1.99 0.069 RBC (×106 cell/𝜇l) 5.06± 0.58 5.23± 0.47 5.25± 0.48 5.19± 0.67 0.654 Hb (g/dl) 14.55± 1.42 14.97± 1.42 15.24± 1.40 15.08± 1.47 0.328 Htc (%) 43.76± 4.24 44.93± 3.89 44.29± 7.27 44.91± 5.87 0.808 PLT (×103cell/𝜇l) 271.57± 51.83 260.76± 64.52 266.76± 62.11 278.59± 84.64 0.597 MPV (fl) 9.21± 0.75 9.36± 0.94 9.33± 0.72 9.37± 1.02 0.910 PDW (fl) 15.71± 2.12 16.19± 2.34 15.67± 1.91 15.84± 2.88 0.810 Glucose (mg/dl) 94.34± 9.58 95.70± 11.35 100.91± 10.69 99.31± 14.30 0.079 Creatinine (mg/dl) 0.70± 0.15 0.81± 0.14 0.8 (0.19) 0.8 (0.2) 0.684 Total cholesterol (mg/dl) 201.92± 47.72 201.88± 42.05 210.01± 43.06 207.43± 40.21 0.758 HDL cholesterol (mg/dl) 54.03± 12.79 42.5 (11.5) 45.25± 12.72 40.48± 8.72 0.001∗ LDL cholesterol (mg/dl) 119.91± 41.91 119.62± 43.47 125.20± 41.56 127.49± 37.26 0.691 Triglyceride (mg/dl) 92.5 (83.83) 128.45 (113) 155.5 (155.6) 196.45 (113.7) 0.017∗
WBC: white blood cells; RBC: red blood cells; MPV: mean platelet volume; PDW: platelet distribution width; HDL: high-density lipoprotein cholesterol; LDL: low-density lipoprotein cholesterol; VLDL: very low density lipoprotein cholesterol;∗P< 0.05.
Table 4: Correlation analyses and P values of MPV and PDW with polysomnographic parameters in the whole group.
Average SpO2(%) Minimum SpO2(%) Time duration with SpO2< %90 Oxygen desaturation index AHI (events/hour)
MPV 0.875 0.446 0.277 0.165 0.098
PDW 0.647 0.749 0.857 0.785 0.735
Table 5: Correlation analyses and P values of MPV and PDW with polysomnographical parameters in the severe OSAS group. Average SpO2(%) Minimum SpO2(%) Time duration with SpO2< %90 Oxygen desaturation index AHI (events/hour)
MPV 0.266 0.523 0.430 0.055 0.010∗
PDW 0.522 0.969 0.840 0.156 0.061
∗P< 0.05.
this will affect MPV value just like other parameters of systemic inflammation. As the disease gets severer systemic reflections may increase and this could point to the relation between cytokine levels generating systemic inflammation and MPV.
Platelet count and MPV are modified by various biosocial and lifestyle factors such as race, age, gender, smoking, alco-hol consumption, and physical activity [20–22]. An earlier study found no significant difference between controls and the severe OSAS group in terms of age, male ratio, and smoking habits, unlike our study, but there was a significant difference in terms of BMI, as in our study [12]. However, in the study by Nena et al., not all of these properties were mentioned in the groups [13]. Patients in our severe OSAS group were predominantly male and older, had more pack-year smoking history, and were more obese, as compared to controls, and all four criteria could affect MPV in a positive way. However, we did not find any differences in these variables in our patient population, as compared to controls. Smoking increases MPV in older patients with risk factors for atherosclerosis. In a study conducted by Kario et al., increased MPV in smoking patients decreased after the patients stopped smoking [23]. This effect could not be demonstrated in younger smoking patients [24]. Based on these results, given that our control group was younger with less smoking and our severe OSAS group was older with more smoking, we should have seen an increased MPV in the severe OSAS group; however, there were no significant differences between the two groups in terms of MPV.
The relationship between MPV and gender has been stud-ied in different populations. The direction and magnitude of this association may differ according to gender as shown in patients with metabolic syndrome (MS). Platelet counts in women with MS are significantly higher than in those without MS, whereas MPV is significantly lower. However, no such trend is observed in men [25]. This result suggests that platelet count and MPV might be a surrogate marker associated with clustered MS in women but not in men [26]. In a study conducted by Varol et al. [12], MPV was correlated with AHI and desaturation index in men, and MPV was correlated with AHI but not with desaturation index in women. The proportion of women was lower in our OSAS group, as compared to controls, although there was no difference in
the OSAS subgroups. We performed a correlation analysis in subgroups of men and women but no correlation was found in the subgroup analysis between MPV and AHI in the OSAS group in men or women.
MPV is an indicator of platelet activation and also shows a close relationship with cardiovascular risk factors, such as diabetes mellitus, hypertension, hypercholesterolemia, obe-sity, and MS. A large population showed that the presence of MS and its components do not constitute a difference in MPV values in obese patients with a BMI≥30 kg/m2[26]. Although we excluded patients with a diagnosis of diabetes, the severe OSAS group had a significantly larger waist circumference and lower HDL values, as compared to those in the control group.
Another reason for the lack of significance could be high variability in the automated MPV measurement method. A review indicated high variability in literature MPV values as a risk factor for cardiovascular disease; thus, a stan-dardized method may be needed [27]. EDTA and citrate-based anticoagulated blood samples from the same patients were assessed with an autoanalyzer and there was a close correlation between MPV as measured by EDTA and cit-rate, but mean MPV measured from EDTA samples was 0.66 fL (9%) more than citrate. Those authors also stated that MPV can be measured accurately by both EDTA and citrate anticoagulation methods if the analysis is performed within 1 h of sampling [28]. The importance of timing was emphasized in a study designed to standardize MPV mea-surements. Optimal measurement time was 120 minutes after venipuncture. Platelet count was most stable in EDTA, and no inverse relationship is found between MPV and platelet count [29]. Therefore, standardized laboratory methods and time adjustments are essential when measuring MPV, and different measurement methods can cause different results.
The difference between our study and two other studies is exclusion of diabetes mellitus and ischemic heart disease as well as careful cardiac examinations. The limitations of our study are that we only measured MPV once for each patient and that this was a retrospective study, unlike the study done by Nena et al. [13], even though all blood samples were collected between 7 and 8 AM and analysed within 30 minutes in our hospital. We also used EDTA instead of sodium citrate in our study [30]. Also another limitation
could be the use of automatic analyzers instead of manual microscopic counting [27].
5. Conclusion
Since the first description of platelets more than a century ago, more and more studies have focused on the association between platelet function and size in different diseases. Although studies have shown a correlation between severity of OSAS and MPV, MPV could not be correlated with severity of OSAS in nondiabetic nonischaemic patients. These findings question the suggestion that MPV might be a marker of OSAS severity, as recommended by earlier studies. Prospective data on platelet indices during the natural history of OSAS would be very useful to fully appreciate their prognostic significance in this disorder, as proposed in earlier studies.
Conflict of Interests
The authors declare that there is no conflict of interests regarding the publication of this paper.
Acknowledgment
This study was presented in a poster discussion section at 16th Turkish Thoracic Society Congress, Belek, Turkey, in 2013.
References
[1] T. Young, M. Palta, J. Dempsey, J. Skatrud, S. Weber, and S. Badr, “The occurrence of sleep-disordered breathing among middle-aged adults,” The New England Journal of Medicine, vol. 328, no. 17, pp. 1230–1235, 1993.
[2] E. Shahar, C. W. Whitney, S. Redline et al., “Sleep-disordered breathing and cardiovascular disease: cross-sectional results of the sleep heart health study,” American Journal of Respiratory
and Critical Care Medicine, vol. 163, no. 1, pp. 19–25, 2001.
[3] J.-D. L. Lattimore, D. S. Celermajer, and I. Wilcox, “Obstructive sleep apnea and cardiovascular disease,” Journal of the American
College of Cardiology, vol. 41, no. 9, pp. 1429–1437, 2003.
[4] W. T. McNicholas, M. R. Bonsigore, and Management Commit-tee of EU COST ACTION B26, “Sleep apnoea as an independent risk factor for cardiovascular disease: current evidence, basic mechanisms and research priorities,” European Respiratory
Journal, vol. 29, no. 1, pp. 156–178, 2007.
[5] S. G. Chu, R. C. Becker, P. B. Berger et al., “Mean platelet volume as a predictor of cardiovascular risk: a systematic review and meta-analysis,” Journal of Thrombosis and Haemostasis, vol. 8, no. 1, pp. 148–156, 2010.
[6] B. D. Kent, S. Ryan, and W. T. McNicholas, “Obstructive sleep apnea and inflammation: relationship to cardiovascular co-morbidity,” Respiratory Physiology & Neurobiology, vol. 178, no. 3, pp. 475–481, 2011.
[7] Y. Kondo, I. Kuwahira, M. Shimizu et al., “Significant relation-ship between platelet activation and apnea-hypopnea index in patients with obstructive sleep apnea syndrome,” Tokai Journal
of Experimental and Clinical Medicine, vol. 36, no. 3, pp. 79–83,
2011.
[8] S. Tsiara, M. Elisaf, I. A. Jagroop, and D. P. Mikhailidis, “Platelets as predictors of vascular risk: is there a practical index of platelet activity?” Clinical and Applied Thrombosis/Hemostasis, vol. 9, no. 3, pp. 177–190, 2003.
[9] Y. Park, N. Schoene, and W. Harris, “Mean platelet volume as an indicator of platelet activation: methodological issues,” Platelets, vol. 13, no. 5-6, pp. 301–306, 2002.
[10] L. Vizioli, S. Muscari, and A. Muscari, “The relationship of mean platelet volume with the risk and prognosis of cardiovascular diseases,” International Journal of Clinical Practice, vol. 63, no. 10, pp. 1509–1515, 2009.
[11] L. Korkmaz, A. A. Korkmaz, A. R. Aky¨uz et al., “Association between mean platelet volume and coronary artery calcification in patients without overt cardiovascular disease: an observa-tional study,” Anadolu Kardiyoloji Dergisi, vol. 12, no. 1, pp. 35– 39, 2012.
[12] E. Varol, O. Ozturk, T. Gonca et al., “Mean platelet volume is increased in patients with severe obstructive sleep apnea,”
Scandinavian Journal of Clinical and Laboratory Investigation,
vol. 70, no. 7, pp. 497–502, 2010.
[13] E. Nena, N. Papanas, P. Steiropoulos et al., “Mean platelet volume and platelet distribution width in non-diabetic subjects with obstructive sleep apnoea syndrome: new indices of sever-ity,” Platelets, vol. 23, no. 6, pp. 447–454, 2012.
[14] T. Oga, K. Chin, A. Tabuchi et al., “Effects of obstructive sleep apnea with intermittent hypoxia on platelet aggregability,”
Journal of Atherosclerosis and Thrombosis, vol. 16, no. 6, pp. 862–
869, 2009.
[15] E. Varol, O. Ozturk, H. Yucel et al., “The effects of continuous positive airway pressure therapy on mean platelet volume in patients with obstructive sleep apnea,” Platelets, vol. 22, no. 7, pp. 552–556, 2011.
[16] C. Iber, S. Ancoli-Israel, A. L. Chesson, and S. F. Quan, The
AASM Manual for the Scoring of Sleep and Associated Events: Rules, Terminology, and Technical Specifications, American
Academy of Sleep Medicine, Westchester, NY, USA, 2007. [17] P. T. Larsson, N. H. Wall´en, and P. Hjemdahl,
“Norepinephrine-induced human platelet activation in vivo is only partly counter-acted by aspirin,” Circulation, vol. 89, no. 5, pp. 1951–1957, 1994. [18] M. Dunleavy, M. Dooley, D. Cox, and A. Bradford, “Chronic intermittent asphyxia increases platelet reactivity in rats,”
Experimental Physiology, vol. 90, no. 3, pp. 411–416, 2005.
[19] M. S. Karakas, R. E. Altekin, A. O. Baktir, M. K¨uc¸¨uk, A. Cilli, and S. Yalc¸ınkaya, “Association between mean platelet volume and severity of disease in patients with obstructive sleep apnea syndrome without risk factors for cardiovascular disease,” Turk
Kardiyoloji Dernegi Arsivi, vol. 41, no. 1, pp. 14–20, 2013.
[20] M. Sundaram, J. Mohanakrishnan, K. G. Murugavel et al., “Ethnic variation in certain hematological and biochemical reference intervals in a South Indian healthy adult population,”
European Journal of Internal Medicine, vol. 19, no. 1, pp. 46–50,
2008.
[21] M. S. Green, I. Peled, and T. Najenson, “Gender differences in platelet count and its association with cigarette smoking in a large cohort in Israel,” Journal of Clinical Epidemiology, vol. 45, no. 1, pp. 77–84, 1992.
[22] J. Latvala, S. Parkkila, and O. Niemel¨a, “Excess alcohol con-sumption is common in patients with cytopenia: studies in blood and bone marrow cells,” Alcoholism: Clinical and
Experi-mental Research, vol. 28, no. 4, pp. 619–624, 2004.
[23] K. Kario, T. Matsuo, and K. Nakao, “Cigarette smoking increases the mean trombosit volume in elderly patients with risk factors
for atherosclerosis,” Clinical and Laboratory Haematology, vol. 14, no. 4, pp. 281–287, 1992.
[24] E. Arslan, T. Yakar, and I. Yavas¸o˘glu, “The effect of smoking on mean platelet volume and lipid profile in young male subjects,”
Anadolu Kardiyoloji Dergisi, vol. 8, no. 6, pp. 422–425, 2008.
[25] B.-J. Park, J.-Y. Shim, H.-R. Lee, D.-H. Jung, J.-H. Lee, and Y.-J. Lee, “The relationship of platelet count, mean platelet volume with metabolic syndrome according to the criteria of the American Association of Clinical Endocrinologists: a focus on gender differences,” Platelets, vol. 23, no. 1, pp. 45–50, 2012. [26] A. Kutlucan, S. Bulur, S. Kr et al., “The relationship between
mean platelet volume with metabolic syndrome in obese indi-viduals,” Blood Coagulation and Fibrinolysis, vol. 23, no. 5, pp. 388–390, 2012.
[27] M. D. Lanc´e, M. Sloep, Y. M. Henskens, and M. A. Marcus, “Mean platelet volume as a diagnostic marker for cardiovascular disease: drawbacks of preanalytical conditions and measuring techniques,” Clinical and Applied Thrombosis/Hemostasis, vol. 18, no. 6, pp. 561–568, 2012.
[28] M. S. Dastjerdi, T. Emami, A. Najafian, and M. Amini, “Mean platelet volume measurement, EDTA or citrate?” Hematology, vol. 11, no. 5-6, pp. 317–319, 2006.
[29] M. D. Lanc´e, R. van Oerle, Y. M. Henskens, and M. A. Marcus, “Do we need time adjusted mean platelet volume measurements?” Laboratory Hematology, vol. 16, no. 3, pp. 28– 31, 2010.
[30] T. O’Malley, C. A. Ludlam, K. A. A. Fox, and R. A. Elton, “Measurement of platelet volume using a variety of different anticoagulant and antiplatelet mixtures,” Blood Coagulation and