474
Scientific Papers. Series A. Agronomy, Vol. LIX, 2016
ISSN 2285-5785; ISSN CD-ROM 2285-5793; ISSN Online 2285-5807; ISSN-L 2285-5785
VEGETATION FEATURES OF ALPINE AND SUBALPINE RANGELANDS
IN EASTERN BLACK SEA REGION
Tamer YAVUZ
1, Mustafa SÜRMEN
21
Ahi Evran University, Faculty of Agriculture, Department of Field Crops, Kırşehir, Turkey
2Adnan Menderes University, Faculty of Agriculture, Department of Field Crops, Aydın, Turkey
Corresponding author email: [email protected]
Abstract
This current study was conducted by using modified wheel point method to determine the features of the vegetation of
alpine and subalpine rangelands in Giresun province located in Eastern Black Sea Region of Turkey. Plant covered
ratios were detected from 33.0 % to 100.00 %. Botanical composition rates of families were determined between
3.71-45.81 % for legumes, 4.59-86.00% for grasses and 8.00-84.13% for other plant species in rangelands. During the
vegetation surveys, a total of 148 different species were identified including 25 legumes, 32 grasses, and 91 belonging
to other families. In addition, 23 of identified species were classified as decreasing species, 14 of them were classified
as increasing species and 111 of them were classified as invasive species. Rangelands in the study area were
categorized as healthy-risky rangeland according to range health classification and moderate-poor rangeland
according to range condition classification. From the Giresun rangelands, a part, representing 47.17% has been
grazed intensively, 35.85% moderately, 9.43% lightly and 7.55% weren’t grazed. Research results showed that grazing
pressure must be decreased by regulating the grazing systems for Eastern Black Sea Region to improve rangeland
quality.
Key words: rangeland vegetation, grazing intensity, range health, range condition.
INTRODUCTION
The grasslands are high-quality forage source
for ruminants and natural life areas for wild
animals worldwide. Stockbreeding is very
important for many countries and mainly
depends on rangelands (Ünal et al., 2014).
Unfortunately, rangelands in Turkey have been
destroyed within the last 70 years, decreasing
from 45 million hectares to 14.6 million
hectares (Anonymous, 2015). Giresun
rangelands (97.9 thousand hectares) in Eastern
Black Sea Region are located in alpine and
subalpine zones. The remaining rangelands
have been overgrazed beyond their capacities,
contrary to management rules (Ayan et al.,
2007).
Grazing frequency affects botanical
composition and productivity of rangeland
vegetation (Kadziulis and Kadziuliene, 2006).
Thus, a large proportion of rangelands need
urgent improvement plans. However, the
success of improvement programmes directly
related to the vegetation features of rangelands.
Forage production is dependent on the
management of the rangelands (Rashid and
Abbas, 2011). The vegetation features of
rangelands are one of the most important
factors in the choice of the improvement
program or the grazing system.
The aim of this study was to identify some of
the vegetation characteristics of the grasslands
in Giresun province, to contribute to the
accumulation of knowledge required for future
possible improvement programmes.
MATERIALS AND METHODS
In this study, vegetation surveys were carried
out by using modified wheel point method at
53 sites (Koç and Çakal, 2004) to determine the
features of the vegetation of alpine and
subalpine rangelands in Giresun province
located in Eastern Black Sea Region of Turkey.
This vegetation study was conducted at the
flowering period of the plants. Characteristics
of rangeland surface such as slope, vector,
aspect and altitude were considered.
Determining of the cover ratio of the vegetation
on the rangeland was based on the study of
475
Gökkuş et al. (2000), and determining the range
health and condition was based on the study of
Koç et al. (2003).
RESULTS AND DISCUSSIONS
Plant covered ratios in the rangelands ranged
between 33.0 and 100 %. Decreaser species
rates in botanical composition varied between
0.0 to 50.95 %, increaser species rates in
botanical composition varied between 0.0 % to
52.60 %, and the rates of the invaders species
varied between 35.06 to 100 %. In the
determined botanical composition rates of
families, between 3.71 and 45.81 % belong to
legumes, 4.59 to 86.00 % belong to grasses,
and 8.00 to 84.13 % belong to other families in
rangelands (Table 1).
According to the average value,
plant covered
rate in rangelands was 71.08 %. The average
ratio of the decreaser species in the botanical
composition was calculated as 16.24 %, ratio of
the increaser species as 15.9%, and ratio of the
invaders species as 67.86 %. Average rates of
legumes, grasses and other families in the
botanical composition were found as 20.74 %,
33.34 % and 45.92 %, respectively. Rangelands
in the study area were categorized as
healthy-risky rangeland according to range health
classification and moderate-poor rangeland
according to range condition classification
(Table 1).
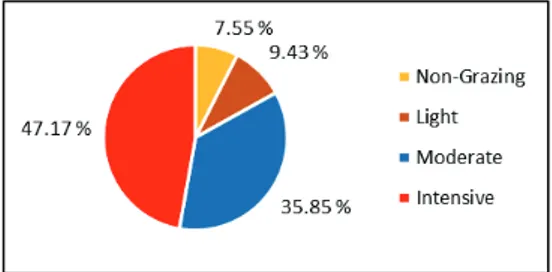
It was determined that there were no grazing in
4 points, light grazing in 5 points, moderate
grazing in 19 points and intensive grazing in 25
points in Giresun rangelands (Table 1). In these
rangelands, a part, representing 47.17 % has
been grazed intensively, 35.85 % moderately,
9.43 % lightly, and 7.55 % weren’t grazed.
Thus, it can be said that most of the rangelands
were exposed to intensive grazing (Figure 1).
Figure 1. Grazing intensity in Giresun rangelands
Totally, 148 species were identified and these
species were classified according to family they
belong: 25 of them were legume, 32 were
grasses and 91 belong to other families. Also,
23 species were classified as decreaser, 14 of
them were increaser and 111 were invaders
species (Figure 2).
The vegetation surveys reveal that the ratios of
species from legumes, grasses, and other
families of identified species were 16.89 %,
21.62 % and 61.49 %, respectively. Among the
identified species, 15.54 % of species were
found as decreaser, 9.46 % as increaser, 75.00
% as invaders (Figure 2).
476
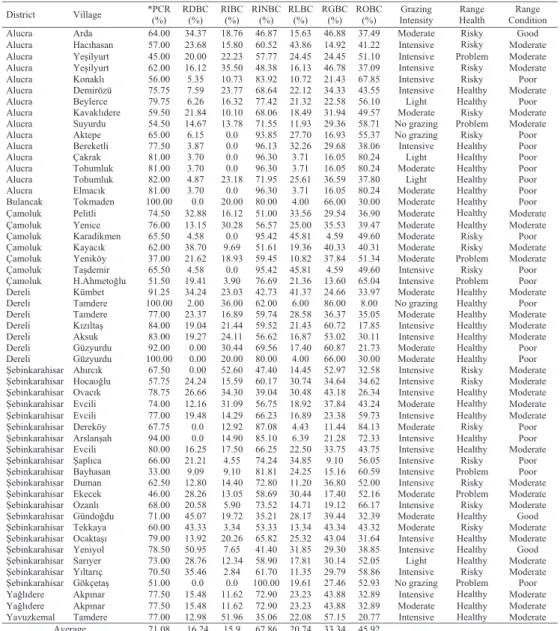
Table 1. Some features of the rangeland vegetation of Giresun province
District Village *PCR (%) RDBC (%) RIBC (%) RINBC (%) RLBC (%) RGBC (%) ROBC (%) Intensity Grazing Range Health Condition Range Alucra Arda 64.00 34.37 18.76 46.87 15.63 46.88 37.49 Moderate Risky Good Alucra Hacıhasan 57.00 23.68 15.80 60.52 43.86 14.92 41.22 Intensive Risky Moderate Alucra Yeşilyurt 45.00 20.00 22.23 57.77 24.45 24.45 51.10 Intensive Problem Moderate Alucra Yeşilyurt 62.00 16.12 35.50 48.38 16.13 46.78 37.09 Intensive Risky Moderate Alucra Konaklı 56.00 5.35 10.73 83.92 10.72 21.43 67.85 Intensive Risky Poor Alucra Demirözü 75.75 7.59 23.77 68.64 22.12 34.33 43.55 Intensive Healthy Moderate Alucra Beylerce 79.75 6.26 16.32 77.42 21.32 22.58 56.10 Light Healthy Poor Alucra Kavaklıdere 59.50 21.84 10.10 68.06 18.49 31.94 49.57 Moderate Risky Moderate Alucra Suyurdu 54.50 14.67 13.78 71.55 11.93 29.36 58.71 No grazing Problem Moderate Alucra Aktepe 65.00 6.15 0.0 93.85 27.70 16.93 55.37 No grazing Risky Poor Alucra Bereketli 77.50 3.87 0.0 96.13 32.26 29.68 38.06 Intensive Healthy Poor Alucra Çakrak 81.00 3.70 0.0 96.30 3.71 16.05 80.24 Light Healthy Poor Alucra Tohumluk 81.00 3.70 0.0 96.30 3.71 16.05 80.24 Moderate Healthy Poor Alucra Tohumluk 82.00 4.87 23.18 71.95 25.61 36.59 37.80 Light Healthy Poor Alucra Elmacık 81.00 3.70 0.0 96.30 3.71 16.05 80.24 Moderate Healthy Poor Bulancak Tokmaden 100.00 0.0 20.00 80.00 4.00 66.00 30.00 Moderate Healthy Poor Çamoluk Pelitli 74.50 32.88 16.12 51.00 33.56 29.54 36.90 Moderate Healthy Moderate Çamoluk Yenice 76.00 13.15 30.28 56.57 25.00 35.53 39.47 Moderate Healthy Moderate Çamoluk Karadikmen 65.50 4.58 0.0 95.42 45.81 4.59 49.60 Moderate Risky Poor Çamoluk Kayacık 62.00 38.70 9.69 51.61 19.36 40.33 40.31 Moderate Risky Moderate Çamoluk Yeniköy 37.00 21.62 18.93 59.45 10.82 37.84 51.34 Moderate Problem Moderate Çamoluk Taşdemir 65.50 4.58 0.0 95.42 45.81 4.59 49.60 Intensive Risky Poor Çamoluk H.Ahmetoğlu 51.50 19.41 3.90 76.69 21.36 13.60 65.04 Intensive Problem Poor Dereli Kümbet 91.25 34.24 23.03 42.73 41.37 24.66 33.97 Moderate Healthy Moderate Dereli Tamdere 100.00 2.00 36.00 62.00 6.00 86.00 8.00 No grazing Healthy Poor Dereli Tamdere 77.00 23.37 16.89 59.74 28.58 36.37 35.05 Moderate Healthy Moderate Dereli Kızıltaş 84.00 19.04 21.44 59.52 21.43 60.72 17.85 Intensive Healthy Moderate Dereli Aksuk 83.00 19.27 24.11 56.62 16.87 53.02 30.11 Intensive Healthy Moderate Dereli Güzyurdu 92.00 0.00 30.44 69.56 17.40 60.87 21.73 Moderate Healthy Poor Dereli Güzyurdu 100.00 0.00 20.00 80.00 4.00 66.00 30.00 Moderate Healthy Poor Şebinkarahisar Ahırcık 67.50 0.00 52.60 47.40 14.45 52.97 32.58 Intensive Risky Moderate Şebinkarahisar Hocaoğlu 57.75 24.24 15.59 60.17 30.74 34.64 34.62 Intensive Risky Moderate Şebinkarahisar Ovacık 78.75 26.66 34.30 39.04 30.48 43.18 26.34 Intensive Healthy Moderate Şebinkarahisar Evcili 74.00 12.16 31.09 56.75 18.92 37.84 43.24 Moderate Healthy Moderate Şebinkarahisar Evcili 77.00 19.48 14.29 66.23 16.89 23.38 59.73 Intensive Healthy Moderate Şebinkarahisar Dereköy 67.75 0.0 12.92 87.08 4.43 11.44 84.13 Moderate Risky Poor Şebinkarahisar Arslanşah 94.00 0.0 14.90 85.10 6.39 21.28 72.33 Intensive Healthy Poor Şebinkarahisar Evcili 80.00 16.25 17.50 66.25 22.50 33.75 43.75 Intensive Healthy Moderate Şebinkarahisar Şaplıca 66.00 21.21 4.55 74.24 34.85 9.10 56.05 Intensive Risky Poor Şebinkarahisar Bayhasan 33.00 9.09 9.10 81.81 24.25 15.16 60.59 Intensive Problem Poor Şebinkarahisar Duman 62.50 12.80 14.40 72.80 11.20 36.80 52.00 Intensive Risky Moderate Şebinkarahisar Ekecek 46.00 28.26 13.05 58.69 30.44 17.40 52.16 Moderate Problem Moderate Şebinkarahisar Ozanlı 68.00 20.58 5.90 73.52 14.71 19.12 66.17 Intensive Risky Moderate Şebinkarahisar Gündoğdu 71.00 45.07 19.72 35.21 28.17 39.44 32.39 Moderate Healthy Good Şebinkarahisar Tekkaya 60.00 43.33 3.34 53.33 13.34 43.34 43.32 Moderate Risky Moderate Şebinkarahisar Ocaktaşı 79.00 13.92 20.26 65.82 25.32 43.04 31.64 Intensive Healthy Moderate Şebinkarahisar Yeniyol 78.50 50.95 7.65 41.40 31.85 29.30 38.85 Intensive Healthy Good Şebinkarahisar Sarıyer 73.00 28.76 12.34 58.90 17.81 30.14 52.05 Light Healthy Moderate Şebinkarahisar Yıltarıç 70.50 35.46 2.84 61.70 11.35 29.79 58.86 Intensive Risky Moderate Şebinkarahisar Gökçetaş 51.00 0.0 0.0 100.00 19.61 27.46 52.93 No grazing Problem Poor Yağlıdere Akpınar 77.50 15.48 11.62 72.90 23.23 43.88 32.89 Intensive Healthy Moderate Yağlıdere Akpınar 77.50 15.48 11.62 72.90 23.23 43.88 32.89 Moderate Healthy Moderate Yavuzkemal Tamdere 77.00 12.98 51.96 35.06 22.08 57.15 20.77 Intensive Healthy Moderate
Average 71.08 16.24 15.9 67.86 20.74 33.34 45.92
*PCR: Plant covered ratio, RDBC: Ratio of decreaser in the botanical composition, RIBC: Ratio of increaser in the botanical composition, RINBC: Ratio of invaders in the botanical composition, RLBC: Ratio of legume family in the botanical composition, RGBC: Ratio of grasses family in the
botanical composition, ROBC: Ratio of other families in the botanical composition