ANALYSIS OF PHOTOVOLTAIC SOLAR PANELS WITH TRACKING SYSTEM
by Muaaz Jnani
Submitted to the Institute of Graduate Studies in Science and Engineering in partial fulfillment of
the requirements for the degree of Master of Science
in
Electrical and Electronics Engineering
Istanbul Bilgi University 2020
ACKNOWLEDGEMENTS
To the most precious thing in existence to the light of the eyes and the care of the hearts To the light that lit up my future and charted my way of success
My dear father
To the rose that adorns every place where it is
To that who spreads fragrant aroma, warmth and tenderness To who I kiss her hands every morning and evening
Moreover, ask God Almighty to extend in her lifetime My dear mother
To those shining suns and illuminated candlesticks
To those who share my joy, my sadness, my love and my happiness
To those who grew up with them in the confines of my parents and ask God Almighty not to differentiate us after we gathered and ask Almighty to achieve each of their goals and aspirations.
My brothers and sisters
To whom I found by my side of the classroom. To those who were my brothers.
My colleagues
To whom I spent and lived with them memorable days in memory. My friends
I extend my sincere thanks and appreciation to the person who has made an unforgettable effort with me.
Prof. Dr. Mehmet Erdem Günay For the constant assistance and guidance that he provided to me
Big thanks to assistant prof. Zafer Yavuz Aksoz who helped me very well in order to make this thesis better.
And all those who helped me in this modest study
ABSTRACT
ANALYSIS OF PHOTOVOLTAIC SOLAR PANELS WITH TRACKING SYSTEM
Year by year our demands for energy have been increasing and one day we may not have a good source for energy so we would need to concern some solutions for that. Actually, in my humble thesis, I am going to show the population and energy demands, the interesting in the manufacture and development of solar panels with the cost of PV modules, absorption of solar radiation, the benefits of the solar panels with the tracking solar system and how much this technology effect to our performance. Considering the primary source of energy is solar energy, which is sustainable, free and reachable from anywhere. Today, the usage of photovoltaic technology has increased. Because photovoltaic could be settled in any place to take to solar radiation, it is clean energy that means environmentally friendly, maintenance easy and installation of panels cheaper rather than all the other kind of energy. In this thesis, the types of solar panels and differences between them are analyzed, and the effects of orbit and the rotation of the earth to the efficiency of the panels were studied. Then, for a case power plant, a detailed feasibility analysis was made by observing the solar irradiation and sunshine duration data for a variety of regions. After finding the optimum location, the performances of different solar panels were compared and the maximum power output with the minimum cost was estimated. It is my greatest hope that the readers of this thesis will devote themselves to building a world in which kids and grandkids could be been with both pure water and air could be breathed, in which individuals and the remainder of nature will nurture themselves.
ÖZET
TAKİP SİSTEMLİ FOTOVOLTAİK GÜNEŞ PANELLERİNİN ANALİZİ Yıllar geçtikçe enerji talebi hızla artmakta olmasıyla beraber gelecekte bir gün bu talebi karşılayacak yeterli kaynaklar bulamayabiliriz. Bundan dolayı bu talebi karşılayabilecek alternatif çözümler bulmalıyız. Bu tezde nüfus ile beraber enerji talebinin nasıl arttığını, fotovoltaik güneş panellerine karşı ilginin ve bu panellerin üretiminin nasıl geliştiğini, takip sistemli güneş panellerinin kullanımımın avantajlarını ve bu teknolojinin performansı nasıl etkilediğini göstereceğim. Temel bir kaynak olan güneş enerjisi sürdürülebilir olmakla beraber, herkesin kullanımına açık durumdadır. Günümüzde fotovoltaik güneş teknolojisi hızla gelişmektedir. Fotovoltaik sistemler herhangi bir bölgeye kurulabilir, temiz bir enerji üretim şeklidir, çevre dostudur, bakımı kolaydır, panellerin kurulumu ucuzdur. Bu tezde değişik güneş panelleri ve bunlar arasındaki farklar ile beraber dünyanın dönme eksenin bu panellerin performansına etkisi analiz edilmiştir. Ardından, olası bir güç santrali için çeşitli bölgelerde güneşlenme süresi ve güneş radyasyonu verilerini incelenmiş ve detaylı bir fizibilite analizi yapılmıştır. Optimum bölge bulunduktan sonra farklı güneş panellerinin performansları kıyaslanmış ve minimum masraf olacak şekilde maksimum güç için tahmin yapılmıştır. Ümit ediyorum ki bu tezi okuyan okuyucular kendilerini, çocuklarımızın ve torunlarımızın dilediğince nefes alabileceği temiz bir atmosfer ve dilediğince içebileceği temiz suları bulabileceği, insanların ve doğanın birbiriyle büyük bir uyum içinde yaşayabileceği bir dünya yaratmaya adayacaktır.
TABLE OF CONTENTS
PAGE TITLE PAGE ... i ACKNOWLEDGEMENTS ... ii ABSTRACT ... iiv ÖZET ... v TABLE OF CONTENTS ... vi LIST OF FIGURES ... xLIST OF TABLES ... xiii
LIST OF SYMPOLS ... xiv
1. INTRODUCTION ... 1
1.1. RENEWABLE ENERGY ... 1
1.2. THE SUN ... 3
1.3. SOLAR ENERGY ... 4
1.4. From a solar cell to a PV SYSTEM ... 5
1.5. THE PV CELLS ... 5
2. THESIS BACKGROUND AND LITERATURE SURVEY ... 7
2.1. History of solar panels ... 7
2.1.1. Solar cells in Space ... 8
2.2. POPULATION AND ENERGY DEMAND ... 9
2.3. CURRENT WORLD ENERGY USE PATTERNS ... 9
2.4. EXPONENTIAL GROWTH ... 12
2.5. ECONOMICS OF BTU AND SUSTAINABILITY TEST: ... 13
2.6. THE DIRECT TRANSFORMATION OF ELECTRICITY FROM THE SUNLIGHT ... 15
2.7. THE PHOTOVOLTAIC MANNER OF TRANSFORMATION SOLAR POWER
INTO ELECTRICITY ... 17
2.7.1. Photovoltaic Effect ... 18
2.7.2. Solar radiation absorption: ... 19
2.8. THE EARTH ORBIT AND ROTATION: ... 19
2.9. SUN TRACKING ... 21
2.10. WHAT IS A METEOROLOGICAL TYPICAL YEAR (TMY)? ... 25
2.11. Irradiance & Irradiation ... 25
2.12. MAXIMIZING OF IRRADIATION ... 26
2.13. The Energy of the Sun... 29
2.14. Development of Solar Panels ... 29
2.14.1 From sand to high-quality silicon: ... 30
2.14.2 Metallurgical silicon: ... 30
2.14.3 Polysilicon ... 31
2.14.4 Multi-crystalline silicon ... 32
2.14.5 Monocrystalline silicon: ... 33
2.14.6 Wafer production ... 33
2.14.7 Production of standard silicon solar cells ... 34
2.14.8 Solar modules ... 35
2.14.9 Production of CIGS solar cells: ... 36
2.14.10 Absorber layer ... 37
2.14.11 Working Principle of CIGS Solar Cells ... 37
2.15. EFFICIENCY OF PV CELL ... 41
2.16. Properties of solar cells ... 44
2.16.1. Properties of photovoltaic circuits ... 44
2.16.2. How Can We Measure the I-V curve? ... 49
2.16.4. Series and Parallel Connections: ... 51
● Parallel connection: ... 52
● Series connection: ... 52
2.16.5. Shadow Effects: ... 53
2.16.6. Best Research-Cell Efficiencies Chart: ... 57
3. METHODOLOGY AND METHODS: ... 60
3.1. Selection of PV Modules Efficiencies: ... 60
3.1.1. Monocrystalline Cells ... 60
3.1.2. Polycrystalline Cells ... 60
3.2. TRACKING THE SUN: ... 62
3.2.1. General Description: ... 62
3.2.2. Performance Specification of AST-02&03: ... 64
3.2.3. Advantages of AST-02&03: ... 65
3.2.4. Detailed Specification Of Active Solar Tracker: ... 65
3.2.5. General Specification of AST-02&03: ... 66
3.2.6. Tracker Control States: ... 67
3.2.7. Dimensions: ... 68
3.2.8. How can we take advantage of this device? ... 69
3.3. Avoiding shading FOR FIXED TILT OF SOLAR PANELS: ... 69
3.4. Irradiance and Sunshine Duration of our case: ... 72
3.5. HOW CAN WE MAUSER THE AREA NEEDED: ... 75
3.6. COOLING THE SOLAR PANELS: ... 75
3.6.1. Thin-film panels ... 76
3.6.2. Water Spray ... 76
3.6.3. Aluminum Water Jacket ... 77
3.6.4. Phase Change Material (PCM) ... 77
4.1. HOW MUCH AREA DO WE NEED ... 79
4.2. CalculatION OF the Annual Solar Energy Output: ... 79
4.3. ESTIMATION OF NUMBER OF PANELS AND OUTPUT ENERGY: ... 81
5. CONCLUSION AND RECOMMENDATION ... 83
5.1. CONCLUSION ... 83
5.2. RECOMMENDATION: ... 84
LIST OF FIGURES
Figure 1.1 Current energy mix 1
Figure 1.2 Classification of solar cells 6
Figure 2.1 Vanguard1 8
Figure 2.2 Source-based global energy production 10
Figure 2.3 2013 global energy sources 11
Figure 2.4 2013 worldwide per capita GD P versus per capita kW 11
Figure 2.5 Decline in cost per watt for PV modules 16
Figure 2.6 Worldwide PV exports from 1975 to 2014 16
Figure 2.7 Russell’s two semiconductors 17
Figure 2.8 A semiconductor's fermi level 18
Figure 2.9 Orbit of the Earth and the declination at different times of the year 20 Figure 2.10 Corners of the sky, height, azimuth and angle of the hour 22 Figure 2.11 Relationships among zenith angle, latitude, and declination at solar noon in
winter and summer 24
Figure 2.12 Solar altitude versus azimuth at 40 ° N latitude for different months of the
year 24
Figure 2.13 Determination of (PSHs)or(irradiation) through integration of irradiance 26
Figure 2.14 Two-dimensional of the collector 27
Figure 2.15 Cumulative daily irradiation 28
Figure 2.16 Optimizing the collector's angle 29
Figure 2.17 Made-up processing from the raw material (sand) to the final solar panel 30
Figure 2.18 Production of metallurgical silicon 31
Figure 2.19 Production steps leading to polycrystalline silicon 31
Figure 2.20 Production of multi-crystalline silicon 32
Figure 2.21 The Czochralski process 33
Figure 2.22 Multicrystalline wafers 34
Figure 2.23 Process steps for silicon solar cell production 35 Figure 2.24 Structure of a glass-foil module in an aluminum frame 35
Figure 2.26 The Shockley-Queisser limit for the efficiency of a solar cell with a given
bandgap 38
Figure 2.27 Structure of a CIGS solar cell 39
Figure 2.28 Illustration of the layers 40
Figure 2.29 Earth sun system 42
Figure 2.30 solar radiation spectrum for direct light 43
Figure 2.31 Schematic representation of a solar cell 44
Figure 2.32 Characteristic I-V curve for solar cell 45
Figure 2.33 Characteristic curve (IV curve) with increasing incident radiation 47
Figure 2.34 Schematic of solar cell with a load 48
Figure 2.35 Power curve for a solar cell 48
Figure 2.36 an illuminated solar cell 51
Figure 2.37 Full IV curve 51
Figure 2.38 Parallel connection of solar cells 52
Figure 2.39 Series connection of solar cell 52
Figure 2.40 a module consisting of three cells connected in parallel 54 Figure 2.41 A module consisting of three cells connected in series 54
Figure 2.42 Bypass diode mounted over shaded cell 55
Figure 2.43 I-V curve of a module consisting of three cells connected in series 55
Figure 2.44 Cells, modules, and arrays 56
Figure 2.45 Examples of PV systems 57
Figure 2.46, I–V characteristics of real and ideal PV cells under different illumination
levels 57
Figure 2.47 new world-record efficiency of perovkite solar cells 59
Figure 2.48 solar cell of Oxford PV 59
Figure 3.1, AST-02 active solar tracking system 62
Figure 3.2, components of AST-03 active solar tracking system 63 Figure 3.3, components of AST-03 active solar tracking system 65
Figure 3.4, Tracker Control States 67
Figure 3.5, dimensions of AST-02 68
Figure 3.6, dimensions of AST-02 68
Figure 3.7, determining the spacing between rows and columns of PV modules 70
Figure 3.9, 3D max drawing 71
Figure 3.10, solar panels at sunset hour 72
Figure 3.11, the solar panels while the sun directly hits the panels 72 Figure 3.12 the place that we want to install our solar panels 73
Figure 3.13 Monthly Radiation value of our region 74
Figure 3.14 Monthly and annual sunshine duration of our region 75
Figure 3.15 Thin Film Panels 76
Figure 3.16 water spray with panels 77
Figure 3.17 Aluminum water jacket 77
LIST OF TABLES
Table 3.1 specification of two solar panels type 61
Table 3.2 performance specification of AST-02&03 64
Table 3.3, General Specification of AST-02&03 66
Table 3.4, Monthly and annual Radiation value of our region 73 Table 3.5 Monthly and annual sunshine duration of our region 74
LIST OF SYMPOLS
(EHP): Electron-Hole Plasma (AU): astronomical unit (ISC): short circuit current (VOC): open circuit voltage
(IMPP): the maximum power point current (VMPP): the maximum power point voltage (PSHs): peak sun hours
(AM): air mass
P.power: Power of the solar panel (Wp). (BTU): British thermal unit
(MSRI): Million Solar Roofs Initiative (PV): photovoltaic
(VR): voltage regulation
(RPSs): renewable portfolio standards (CNN): Cable Network News
(GDP): gross domestic product Eph: energy of a photon
EG: threshold energy
(L1): one longitude (α): The solar altitude (ψ): azimuth angle
(DH): number of hours of daylight (ωs): sunrise angle
(ω): hour angle
(TMY): Typical Meteorological Year (θZ): position of the Sun at solar noon
(ETA): extremely thin absorber (EVA): ethylene vinyl acetate
(CIGS): Copper indium gallium selenide (a-Si): Amorphous silicon
(CIGS): Copper indium gallium selenide (TFSC): Thin-Film Solar Cells
(VOC): Open Circuit Voltage
(ISC): Short Circuit Current
(PMPP): Maximum power output
(FF): Fill factor
(η or PCE): Power conversion efficiency (FF): fill factor
(AST): active solar tracking system (PCM): Phase Change Material
(NREL): National Renewable Energy Laboratory (MPPT): Maximum Power Point Tracker
(PSCs): Perovskite Solar Cells (ETLs): Electron Transporting Layer
1. INTRODUCTION
1.1. RENEWABLE ENERGY
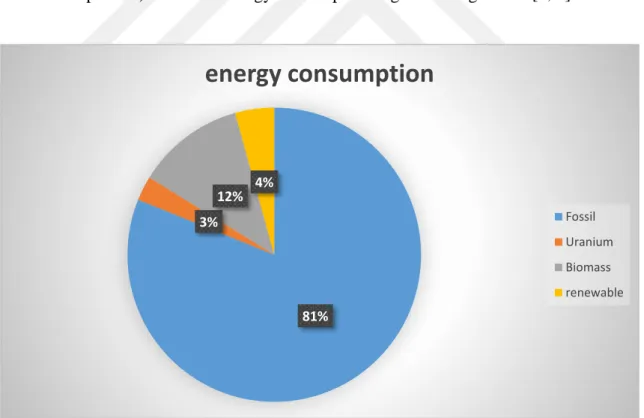
Energy is undoubtedly a resource that has made humanity dependent on it. Our society will not function without energy. Without energy, we cannot find or administer disease cure medicines, prepare food, purify water, operate computers, etc. Current energy needs are approximately 15 TW (15·1012 W) and are projected to increase further in the future. Fossil fuels (coal, petroleum, and natural gas) have enabled our energy consumption for the last century and continue to dominate our energy production. Today, approximately 81 percent of our energy comes from fossil fuels, 2.7 percent from nuclear energy, and only the remaining part from renewable sources (biomass is considered the largest source of energy at around 12 percent). The total energy consumption is given in Figure 1.1 [1, 2].
Figure 1.1 Current energy mix. The total energy consumption is almost 15 TW.
Through natural processes such as anaerobic decomposition of buried dead organisms fueled by photosynthesis, fossil fuels are constantly produced. These are non-renewable resources, because they require millions of years to develop, and existing applicable reserves are being
81% 3% 12% 4%
energy consumption
Fossil Uranium Biomass renewabledepleted faster than new reserves. Even if fossil fuels can be used for many years to come, there are many other reasons to look for alternatives [1, 3].
The CO2 emission is possibly the strongest excuse against fossil fuels, but the burning of
fossil fuels also creates other air pollutants, such as nitrogen oxides, sulfur dioxide, flown organic components and heavy metals. Moreover, harvesting, processing, and distributing fossil fuels create their own environmental concerns. Moreover, fossil fuels have harmful effects on people's health, especially in rural areas, which leads to the deaths of more than 7,500 women and children each year due to dirtiness in indoor air [1-4].
While searching for newly available energy sources that can replace fossil fuels, it is useful to consider how much energy each process can deliver. Estimated available power for each energy process is given below:
Tide: 0.3 TW Earth heat: 2 TW Hydropower: 4 TW Wind: 75 TW Biomass: 6 TW Direct radiation: 26,000 TW Coal: 900 TWy Petroleum: 240 TWy Natural gas: 215 TWy Uranium: 300 TWy
It should be noted that the numbers for fossil fuel and uranium are based on total energy while the remaining numbers are given as resources available per year. Although the specific numbers may vary from source to source, the magnitude of the numbers is reasonably accurate [1, 5].
Renewable energy is an expression that refers to types of energy, which are derived from natural sources that can be naturalistically regenerated forever; these involve solar, wind, geothermal, hydroelectric and biomass. The concept of renewable energy must not be
discomfited with alternative energy, which defines energy sources outside of conventional forms such as petrol, considered more environmentally friendly or less hurtful [6].
The benefits of using renewable sources of energy are lower repair costs as most sources involve few or no moving parts and therefore less mechanical harm. They are economical and can reduce the costs paid to coal. They deploy little or no loss into the environment; for example, Photovoltaic (PV) power generation on a small scale can save 335,9 kg per MWh of CO2 [3]. There is no depletion of renewable energy sources; therefore, they have a better
future prospect [4, 6].
The tiny pieces called photons; the Photons hit atoms and generate energy. Therefore, when we stand under sunlight, our skin feels warm. Because they produce electricity from light, photovoltaic cells are also called solar cells ("photo" is Greek for light and "volt" is an electricity unit) [5, 7, 8].
A photovoltaic cell uses special metals called semiconductors to capture a photon from the sun. When photons strike semiconductors, instead of heat, they may generate electricity. Electricity can be produced from sunlight; the popular semiconductor that is used for building solar cells is silicon. Electron is sometimes released when a photon hits silicon. The solar cell catches and moves all the electrons emitted by the silicon in one direction and generates an electrical current [7, 9].
Solar cells are also used in spacecraft such as the International Space Station but are also used on Earth in places where there is plenty of sunlight during the year. The more sunlight is obtained, the more electricity is generated so that regions with little sunlight are not good places to use solar cells [7, 9].
1.2. THE SUN
The Sun supplies the necessary energy from our solar system to sustain life. The Earth receives ample energy from the Sun in just one hour to fulfill its energy requirements for nearly a year. In other words, this is about 7,500 times the assistance of all other sources to the Earth's energy budget [10].
The Sun is made up of a mixture of hydrogen-dominated gases. Accordingly, the Sun transforms hydrogen into helium in a major thermonuclear fusion reaction, mass is converted to energy by the famous theorem of Einstein, E = mc2. The Sun's surface is held at a temperature of around 5800 K as a result of this reaction [10, 11]. When sunlight enters the atmosphere of the Earth, some are absorbed, some are dispersed, And some pass through atmospheric molecules without effected and are either absorbed or reflected by ground-level objects [10, 12].
One more evident observation is that rainy areas get less sunshine than sunny regions. It might be less obvious, though, that the hours of the sunshine during the year are the same for every point, given only hours are counted between sunrise and sunset, irrespective of the cloud lid. Some parts of the planet closest to the poles, which have long hours of winter, also have long days of summer. Nevertheless, since the Sun is, on average, lower in the polar regions than in the tropics, so in the polar regions, sunlight should across more air mass than in the orbit places [10].
1.3. SOLAR ENERGY
Solar energy is sunlight and thermal that is employed using a collection of including applied science such as photovoltaics [13]. Technology has offered several ways of using this plenty of resources. It can be called as Green technology because it does not diffuse greenhouse gases. Solar energy is plentiful and used both as an energy source and as a heat source [6, 14].
The technology of solar can be commonly categorized as active solar and passive solar technology. The use of photovoltaic devices is a successful solar application; solar power and solar water heating are optimized to harvest energy. In operations like air heating and drying clothes, active solar is consumed directly [14, 15]. The passive solar mechanism includes the alignment of a building towards the Sun, the use of materials with desirable thermal mass or light-dispersing properties, and the construction of natural air circulation areas [6, 14, 15].
The conversion of solar energy by obtaining electricity from sunlight is referred to as the Photovoltaic method, which is achieved using a semiconductor material. The process requires the absorption of particles carrying energy in the rays of the Sun called photons [6, 16]. The other way to obtain solar energy is by using thermal technologies, which provide two types of energy-tapping manners. The first is the absorption of solar energy to power calorific turbines while the second manner is for cooling and heating applications used in solar air conditioning and water heating [6, 14, 15].
1.4. FROM A SOLAR CELL TO A PV SYSTEM
PV systems are designed around the PV cell. Since a typical PV cell produces less than 5 W at approximately 0.5 VDC, cells must be connected in series-parallel configurations to
produce enough power for high-power applications. Modules may have peak output powers ranging from a few watts, depending upon the intended application, to more than 400 W.
The typical output power of the PV arrays is in the range of 100 W-to-kW, while megawatts and gigawatts are becoming more common now [1, 10]. Because PV arrays only generate power when illuminated, PV systems use an energy storage mechanism such as batteries so the captured electrical energy can be useful later [1, 10].
Over the past two decades, the use of photovoltaics has grown rapidly due to the belief that it could make a fundamental contribution to the transition from conventional fossil fuels to renewable energy economies. Nevertheless, the long-term sustainability of photovoltaics will depend largely on the efficiency of the process that will be implemented to recycle the enormous amount of end-of-life panels expected to be generated soon [17].
1.5. THE PV CELLS
The PV cell is a P-N junction or Schottky partition unit that is specially designed. The well-known diode equation explains how the PV cell functions. When the cell receives light, EHPs are formed by the incident photons acting with the cell's atoms [10, 16]. The electrical field produced by the cell junction divides the photon-generated EHPs, with the electrons migrating into the cell's n-region and the holes drifting into the p-region, providing that the
EHPs are induced sufficiently close to the PN junction [10, 16]. According to the materials that are used in the manufacturing of solar cells, solar cells can be divided into 3 main groups: organic, inorganic and organic-inorganic, in Figure 1.2 [18].
Figure 1.2 Classification of solar cells
The goal of this thesis is to analyze the feasibility of constructing a photovoltaic solar power plant on a case location. First, the improvement of solar cells through history is reviewed in Chapters 2.1 to 2.6. Second, the theoretical background on how light energy is converted to electricity is given in Chapter 2.7. Moreover, the effect of the position of the sun and the orbit of the earth on solar power is discussed in Chapters 2.8 and 2.9. Then, the energy of the sun and the role of irradiance of sunlight were mentioned in Chapters 2.11 to 2.13. Next, the manufacturing and development of most kinds of solar panels with their efficiency and the shading effect on the solar cells are written in Chapters 2.14 to 2.16. Finally, in Chapter 3, all the results and calculations related to the case system such as the shadow effect, implementation of a solar tracking system and employment cooling systems are given.
Photovoltaics Organic Inorganic Hybrid Elemental semiconductor Si Compound semiconductor Small molecule Polymer DSSC Perovskites
Crystalline Thin Film Single Crystal
(GaAs) Thin Film (CdTe, CIGS) Multi-junction Mono-crystalline Si Polycrystalline Si 1st Generation 2nd Generation 3rd Generation 4th Generation
2. THESIS BACKGROUND AND LITERATURE SURVEY
2.1. HISTORY OF SOLAR PANELS
The first milestone is 1839 Alexander Edmond Becquerel, who discovered the PV effect as a 19-year-old and thus created the first solar photovoltaic cell, he used liquid electrolyte, and for that reason, his cell was not that practical it was also not that efficient [1, 19-21]. The next one is William Grylls Adams and Richard Evans Day 1877, they did the observation of the photovoltaic effect in solidified selenium, this was the first all-solid-state photovoltaic device.
After this, just a few years later, 1884 Charles Fritz installed the first solar panel in New York [1, 19-21]. It had an efficiency of almost 1%, and this was actually a major achievement at that time, and it’s important to know the electricity was still quite new, and this meant there is a huge optimism about solar cells because it seemed we could produce the energy we would demand using this. However, after this development got really slow and within a few years, electricity became much more common, power generators sprung up everywhere, And suddenly, 1% efficiency from a solar cell was not impressive at all, it was a too expensive way to produce electricity [10, 21].
Until the 1950s, not a lot happened we got the next big development, this was the invention of the silicon solar cell this was pioneered at the laboratories by Calvin Fuller, Gerard Pierson, and Daryl-Chapin, and they created the first truly useable solar cell with great efficiency and this lead to the modern silicon solar cells of today [1, 20].
On June 26, 1997, it was proclaimed by (MSRI) “Now we will work with businesses and communities to use the sun’s energy to reduce our reliance on fossil fuels by installing solar panels on 1 million more roofs around our nation by 2010. Capturing the sun’s warmth can help us to turn down the Earth’s temperature” [10, 22]. In 1997, little concern was being expressed in the public sector about energy problems and perhaps even less discussion related to global warming, so this statement by President Clinton carries special significance from nowadays perspective [10, 21].
By the end of 2007, it was estimated that more than 600,000 solar systems had been installed around the United States. In the 12 months of 2013, over 145,000 residential PV systems were installed in the United States, in addition to over 1 GW of PV installed by U.S. utilities [10].
In 2013, China and Japan were the largest markets for PV and the United States was falling behind. In the United States, more and more states are now adopting renewable portfolio standards (RPSs), which set goals for the percentage of the electrical energy mix to be provided by renewable sources by a certain date. Implementation of these goals will require engineers who understand the how and why of PV system design [10].
2.1.1. Solar cells in Space
It’s really a big topic because of the space race really fueled the development of modern silicon solar cells, it’s really expensive to carry batteries into space and since we can generate electricity using solar cells directly in space. This becomes much more cost-efficient, even though the solar cells themselves may be quite expensive the first use of solar cells in space was the Vanguard 1 in 1958 [10, 20, 21]. So as you may know this is just the year after invent Vanguard 1, four satellites are launched, and this really lead the use of solar cells in space.
Figure 2.1 Vanguard1 [1, 20, 21]
After Vanguard 1 there's a lot of developments. Moreover, many new satellites started using solar cells. So, for example, the Explorer One, the Telstar satellite, and of course also the
space stations. So here, we can see Skylab with its solar cells. In space applications, it is important to notice that the price of the solar cell is really not that important, it is the efficiency that matters. And for this reason, we've seen a move away from silicon-based solar cells and a move towards gallium arsenide based solar cell technologies instead [1, 19].
2.2. POPULATION AND ENERGY DEMAND
Earth's human population has now gone over 7.3 billion, and all these people need to get the energy needed to sustain their lives. The exact amount of energy needed to meet these requirements and exactly what sources of energy will meet these demands will be issued for current and future years to address [23]. So, developing countries will, therefore, increase their per capita energy use such as China (1997) they built power stations at a level of 300 MW a week [10].
Global demand for primary energy is expected to increase from 2009 to 2035 by an average of 1.3 percent per year. 1.7% of the annual rate increase in energy density. CO2 releasing
from the combustion of fuel rise by 0.9% a year to attain a long-term level straightforward with an average global temperature increase of more than 3.5°C [4].
2.3. CURRENT WORLD ENERGY USE PATTERNS
The expiration of coal and the warming stemming from the use of these existing energy sources show the desire to rely on clean energy. Photovoltaics are now gaining more attention as renewable and clean energy, making it one of the most successful alternatives and clean energy. Since the development by Bell laboratories of modern photovoltaics in 1954, several kinds of photovoltaic panels have been produced. Solar panel techniques are generally referred to as light-absorbing contents. For this reason, tremendous efforts have been made in recent decades to develop new photovoltaic items to create high-quality solar panels with low electricity costs [18].
Figure 2.2 shows the rise in source-by-source global energy output from 1989 to 2014. In 2000, there were about 397.40 quads of primary energy consumption worldwide.
Figure 2.2 Source-based global energy production
The world's developed countries expended about 75% of energy, whereas approximately 2 billion people stayed without energy in developing countries, mostly in the tropical regions where are very good for setting up solar panels. In 2005, primary energy use worldwide rose to 462 quads and 2 billion people were still living lacking power [10, 24]. Remember that crude oil production continued to rise after the oil crisis of 1973, followed by significant growth in crude oil prices in the 1970s and the beginning of the 1980s. Among this time, high oil prices prompted the implementation of regulations on efficiency of energy, like the National Energy Conservation and Policy Act, codes for the efficiency of energy in constructing and raised standards for vehicle fleet miles [10, 24]. Consumers have contributed by reducing power usage by reducing thermostats and installing isolation and other steps to conserve energy.
In the mid-1980s, the outcome was lower oil production, as a request was lower. In the same period, the more efficient use of electricity led to the termination of the building of nuclear power stations, turn results in a substantial reduction in the rate of growth of nuclear power. Finally, the issue about the control of oil prices and economic sanctions led to a shift from oil to coal and natural gas for carbon-fired energy production [10, 24]. Figure 2.3 illustrates the global energy mix in 2013.
1 21 41 61 81 101 121 1989 1994 1999 2004 2009 2014 Qu ad s Year
Figure 2.3 2013 global energy sources
Figures 2.3 and 2.4 illustrate that the world is facing a huge challenge as developing countries seek to achieve parity in energy with advanced nations. Consider that power equity is just another word for trying to achieve equivalent living standards. And although reaching a higher living standard will bring a cost with it [10, 24]. The cost includes not only financial commitments but also the opportunity for substantial deterioration of the environment if electricity equity is followed through the cheapest alternatives at first cost [10, 24].
Figure 2.4 2013 worldwide per capita GDP versus per capita kW
Sadly, this is the most likely result, as it is already taking place in countries such as Eastern Europe and Asia. In reality, the use of low-cost energy choices may lead to similar energy consumption per capita, but at the same time can reduce living standards by generating air
Coal 28.9% Liquids 31.10% Natural gas 21.40% Renewable 13.80% Nuclear 4.80%
Coal Liquids Natural gas Renewable Nuclear
Senegal India Brazil China Italy Spain UK Russ Fed Germany France Japan Saudi Arabia Australia Korea USA Canada 0 10 20 30 40 50 60 0 2 4 6 8 10 12 14 16 p er Cap ita G D P (th o u san d s o f U.S . d o llars ) 1000kWh per capita
that is not appropriate for breathing and water that is not desirable for drinking [10, 24]. When developed nations raise their production capacity by using cheap yet polluting local power supplies, the pressure might be exerted to rest standards of pollution control in the industrialized world to retain the competitiveness with developing nations' production [10, 24].
Objection to international trade conventions was partially based on environmental issues, such as agreements prohibiting any country from placing tariffs on goods manufactured in countries with low environmental laws [10, 24]. So, advanced nations are forced to send products to advancing nations. Nonetheless, the status has changed since 2016, with both the United States and China actively supporting the November-December 2015 Paris Climate Agreement [10, 24].
Both countries, along with nearly 200 others, appear to have concluded that energy efficiency is good for business and the economy as well as for the environment. But what has this debate to do with the development of PV power? PV power sources are renewable, but existing photovoltaic installation prices have only recently become combative with the premier direct costs of coal and oil generation [10].
This means the user must be familiar with the cost of the cycle of life and the engineer should be willing to make the most price-effective PV option. It also ensures that a large amount of work and improvement must be carried out to ensure that the price of PV generation continues to fall [10]. It also implies that action must proceed to put a monetary value on the deterioration of the environment generated by sources of energy, so this cost can be taken into account in the actual cost to society of any power source [10, 24]. The fact of the matter is that there is still a considerable amount of research to be done in the field of energy research, growth and public schooling, and especially in the sector of PV. [10].
2.4. EXPONENTIAL GROWTH
The electrical engineer who knows the diode equation, in which (I) and (V) are the diode current and voltage, is possibly most familiar with exponential growth, respectively, Io is the
reverse saturation current and KT/q is 26 mV at T = 300 K, or, specifically, 𝐼 = 𝐼o(𝑒𝑞𝑣/𝐾𝑇−
1).
Exponential growth is a particular way of increasing a quantity over time. It occurs when the instantaneous rate of change (that is, the derivative) of a quantity concerning time is proportional to the quantity itself [25]. Although this formula is central to the quality of PV cells, exponential growth also describes many other natural processes. Exponential growth is generally called compounded interest. Most have heard of it, but few understand the consequences of a continuous annual growth rate in amount, whether that be money, population, or supply of energy or request. [10]. Malthus was among the first to warn about the dangers of exponential growth in 1798. He informed that growth in population will reduce the capacity to make more people be fed. The Malthusian theory is frequently the topic of growth enthusiasts' mockery [26].
The aim of this argument is not to affirm or dismiss Malthus ' predictions, but simply to highlight an important mathematical concept frequently ignored by engineers. The implementation of unsustainable growth concepts is common in society, so the theories of continuous growth must be as essential with a well-informed engineer as the second thermodynamic law. Thermodynamics is a theory that less energy comes out of each cycle than is placed into it. In other words, no free lunch is available [10, 26].
2.5. ECONOMICS OF BTU AND SUSTAINABILITY TEST:
The net energy correlated with a source of energy is essentially the difference between the energy needed to gain and transform the source into usable energy and the factual power from the source. For example, to be able to burn a vat of petroleum, it is important to locate the petroleum, extract the petroleum, transit the petroleum, duplicate it and build the petroleum-burning facility [10, 27]. The reduplicate petroleum should then be shipped to the burning location and, hopefully, any damage to the environment resulting from the extraction, shipment, processing, and burning should be fixed after the oil is burned. The fact of the matter is if more than one vat of petroleum is required to extract and turn the available power into an oil barrel, One should seriously ask if it makes reasonable to burn the petroleum [10, 27].
In some cases, expending the energy to obtain the source of energy may make sense. Suppose, for example, that an else use for petroleum has been found, such as the supply of an important chemical for cancer cure. Then that will make reasonable to use energy from sources other than petroleum, even if the power surpassed the oil's energy worth, to make the petroleum accessible for greater use.
Another case is to use the shape of the energy of lower performance to make a higher quality form of energy. Such activity may make energy sense. For example, burning coal for production electricity requires about three coal units to generate one unit of electrical power. Before television sets running directly from coal are invented, this inefficient method of turning the energy of coal into electrical, given the established environmental issues with coal, will probably continue. In 1976, Odum and Odum published the net energy concept [10].
They integrated the concept of net energy into a new economic standard that they did make more reasonable than the gold standard. It was called the BTU standard. The BTU standard simply describes that everything has a content of power. The concept of BTU has been widely written by Henderson (BTU) British Thermal Unit is the volume of heat required to raise the temperature of 1 pound of fluid water by 1 degree Fahrenheit at the temperature at which water has the highest density (about 39 degrees Fahrenheit). Technical information: 3413 BTU = 1 kWh. Burning a wooden matchstick makes one BTU available [10, 28, 29].
Having analyzed the effect of total energy production on economic expansion, we are now disaggregating overall energy generating into renewable and non-renewable generation and analyzing its effects on growth. Global renewable electricity generation has been on the rise over the past three decades, especially in developed economies, but non-renewable electricity retains the primary source of electricity for most nations. This would be interesting to study if the positive effect of energy production is guided by development in non-renewable energy, renewable energy or both since the results could have major political consequences [30].
Nevertheless, if energy is allowed to be transferred by the source from a very large reservoir, the source becomes almost limitless [10]. For example, if a photovoltaic cell can produce
more electric power over its working life than was spent on manufacturing and operation and eventually on disposal, including the cost of environmental power, then the cell would be labeled net positive energy.
2.6. THE DIRECT TRANSFORMATION OF ELECTRICITY FROM THE SUNLIGHT
The sunlight could be converted directly into electricity is discovered by Becquerel in 1839, when he observed the photo galvanic effect. Adams and Day discovered in 1876 the selenium had PV functions. As Planck observed the quantity existence of light in 1900, other scientists were opened the door to expand on this concept [10, 16, 19]. Wilson presented the quantity theory of solids in 1930, establishing a theoretical connection between the photon and the behaviors of solids. Ten years later, Mott and Schottky introduced the solid-state diode theory, and Bardeen, Brattain, and Shockley fabricated the bipolar transistor in 1949 [10, 16, 19, 20].
Naturally, this development rampaged the solid-state devices world. It had a 6 percent efficiency. The first solar cells on the Vanguard 1 were used 4 years later. One might wonder why designing the PV cell took so long [10, 16, 19, 20]. The answer lies in the challenge of manufacturing materials that are clear enough to achieve a decent level of cell efficiency. There was little impetus for the preparation of strongly clear semiconductor materials before the invention of the beginning of the space program and bipolar transistor. [10, 31].
Coal and oil served the globe's energy requirements, and transistors met the electronics industry's needs. However, as transistors and traditional power sources were not practical for use in space, solid-state took hold. PV cells are made of elements with semiconductors and assembled into 36 or more cells. Traditional homogeneous semiconductor PV cells or photoelectric inverters (PCs) consisting of one p-n junction produce voltages whose qualities are decided by the height of the possible junction barrier [10, 16, 32].
Figure 2.5 Decline in cost per watt for PV modules
This understanding is considerable because this means that the same industry that has developed from the growth of the bipolar transistor to computer chips involving millions of transistors over the past 60 years is also included in the production of PV cells. Figure 2.5 illustrates the decrease since 1977 in the price of PV systems [10, 20].
Most of the actual cost decrease was due to improved processes in cell processing. The critical factor at this level is the energy cost of the cells. For a few years following 2005, refined silicon prices increased significantly due to a worldwide shortage, but then fell again in 2008 as supply caught up with demand [10, 20]. Therefore, the task for the future will decrease the density of energy in the cell development processes while preserving or increasing cell size, quality, and accuracy. Figure 2.6 illustrates worldwide PV exports from 1975 to 2014 [10, 20].
Figure 2.6 Worldwide PV exports from 1975 to 2014 0.1 1 10 100 1975 1980 1985 1990 1995 2000 2005 2010 2015 $/Wa tt Year 1 10 100 1000 10000 100000 1975 1980 1985 1990 1995 2000 2005 2010 2015 An n u al sh ip m en ts (MWa tt ) Year
An important finding is that 45% of the world's PV modules were produced in the United States in 1995, while 80% of the world's PV modules were produced in Europe, Japan and the rest of the world in 2002 and 93% of the world's PV cells in 2007. Just like the United States has enabled consumer technology products to be moved to other nations, it seems that the United States still allows the same to occur with the photovoltaic industries [10, 20]. Therefore, it seems essential for studying this development in more detail. To explore different sources of energy, it is useful to compare the units with which the available energy is measured in these sources [10].
2.7. THE PHOTOVOLTAIC MANNER OF TRANSFORMATION SOLAR POWER INTO ELECTRICITY
Before moving on to learning the principle of photovoltaic effect, it is important to have a fundamental understanding of PN junctions. Russell of Bell's laboratories in the USA invented the PN Junction [1, 6, 16]. It relates to a section of two semiconductors, i.e. P-type and N-type. Russell found the two semiconductors at the junction have an unusual activity that induces only one direction of conduction [1, 6]. [16, 33].
Figure 2.7 Russell’s two semiconductors [6]
Around the intersection in the diagram above: Additional charges spread out to the counter junctions so the positive on the p-side absorbs and neutralizes negative charges. Likewise, the negatives on the N-side are charged positively and neutralized [6, 16]. It creates a gap (m) on either side where additional charges are minimized to make it area stable and balanced. This zone is called a depletion layer and there is no charge from either side. The depletion layer provides a possible barrier and therefore needs exterior tension to beat it [6].
This operation is known as inequality. The applied voltage will inject electrons (negative) from the n-junction to the p-side of the junction in the forward biasing. Constant current
ensures that the electrons are constantly moving to fill the holes, thus leading the conduction through the depletion layer [6]. The reversal of the applied voltage allows holes and electrons to move apart in a process called reverse biasing, raising the depletion layer. The exterior charge is applied to a solar cell with a positive terminal linked to the wafers on the N side and the negative one to the wafers on the P side [6].
The photovoltaic impact produces a voltage differential. The current gained by photon-displaced electrons is not enough to make a significant potential difference. Therefore, the current is included to give rise to further collisions and release more electrons [6].
2.7.1. Photovoltaic Effect
In capturing solar energy, a solar cell uses the concept of a p-n junction. This figure shows a semiconductor's fermi level.
Figure 2.8 A semiconductor's fermi level
Electrons must cross the energy gap between the valence band and the conductive band for a semiconductor to conduct. These electrons need some power to displace and pass through the valence gap. The emitted photons from the Sun in solar cells supply the energy needed to beat the hole.
A photon event may be absorbed, mirrored or transferred on the surface of the panel. It does not help to displace an electron if it is mirrored or transferred and is lost. A photon should
therefore be soaked up to supply the power needed to displace and shift electrons through the parity gap [6].
If Eph is a photon's power and EG is the power of threshold to cut across the gap of energy
the possible results will be when photons hit a semiconductor's surface:
Eph < EG − In this sıtuatıon, the photon does not reach the threshold and will only flow
through.
Eph = EG − the photon has the same threshold for dislodging an electron and producing a pair
of hole electron.
Eph > EG − The energy of photons exceeds the threshold. It produces a hole-electron pair,
although it is a mistake because the electron is moving towards the gap of energy [6].
2.7.2. Solar radiation absorption:
In many situations, the semiconductor absorption coefficient is used to define the efficiency of Sun energy absorption. Low factor means a low absorption. Consequently, the extent to which a photon goes is an operator of both the absorption coefficient (α) and the radiation wavelength (λ) [6].
2.8. THE EARTH ORBIT AND ROTATION:
The Earth orbits around the sun one time per year in an elliptic orb with the Sun, in a focal point the range between the Sun to the Earth can be given:
𝑑 = 1.5 × 10¹¹{1 + 0.017 𝑠𝑖𝑛 [360(𝑛−93)
365 ] } 𝑚 (2.1)
Which (n) reflects the day of the year for example 5 of January as day 5. Since the deviation of the orbit is so small from the circular, this distance should normally be expressed from its average value. The Earth spins once a day around its own polar axis [10].
The Earth's polar axis is inclined to the Earth's orbit around the Sun by an angle of 23.45°. This phenomenon makes the Sun in the summer higher in the sky than in the winter. It is also responsible for longer hours of summer sunshine and shorter hours of winter sunlight.
In this Figure, we can see the orbit of the Earth with the inclined polar axis around the Sun [10, 34].
Figure 2.9 orbit of the Earth with the inclined polar axis around the Sun [35]
Note that the Sun appears vertically above the tropic of Cancer on the first day of summer in the Northern Hemisphere, which is 23.45 ° N latitude of the equator. The Sun appears vertically above the tropic of Capricorn on the first day of winter, which is 23.45 ° S latitude of the equator [10, 34].
The Sun is directly above the equator on the first day of spring and fall. The Sun is south of the equator from fall to spring, and the Sun is north of the equator from spring to fall. The angle of the Sun's deviation from the equator is called the declination, δ. When angles to the north of the equator are considered positive and angle to the south of the equator are considered negative, then the aberration can be observed on any given day of the year from:
𝛿 = 23.45°𝑠𝑖𝑛 [360(𝑛−80)
365 ] (2.2)
This equation will be approximately good because the year is not perfectly 365 days and the first day of summer is not always the 172nd day of the year [10]. Under any situation, the declination is an essential factor to decide the position of the Sun in the sky at any time of the day at any time of the year at any place on the earth. It is also significant to be able to define the time when solar noon happens. Solar noon happens in just one longitude, L1, in
any time zone at noon. Solar noon will happen at longitudes east of L1 before noon and at longitudes west of L1 afternoon [10, 36]. When a shadow points directly north or directly south on a sunny day, depending on the latitude, solar noon can be defined. Remember that, the shadow will point north for part of the year in the tropics and will point south for the rest of the year [10, 36].
Luckily, if the longitude is known, the estimated relationship between clock noon and solar noon is easy to determine. Since the day is 24 hours and during this period, the Earth rotates 360 °, so the Earth spins at a rate of 15 ° / h. It is also useful that the zero longitude matches to the noon at solar noon. The outcome is that solar noon happens at midday at multiples of 15° longitude west or east [10, 36].
Moreover, since it requires 60 minutes to rotate the Earth 15 °, it is direct to inset to locate solar noon at average lengths. For example, solar noon can be found at a length of 90 ° W by noting that 90 ° is between 85 ° and 100 °, where solar noon happens at the standard time of the clock at noon [10]. Because 90 ° is west of 85 °, the Sun will be at 90 ° east of south when the Sun is directly south at 85°. Therefore, interpolation (t) determines the clock time at which the Sun will be south at 90 ° (solar noon at 90 °):
𝑡 = 12 +90−85
15 × 60 = 12 + 20 Minutes= 12:20 p.m (2.3)
Remember that this time is the standard time zone for the 85 ° W solar noon. When 100 ° W is used as the guide for the solar noon, then at 100 ° solar noon will happen 40 minutes after the 90 ° solar noon. Notice the answer remains the same [10, 36].
2.9. SUN TRACKING
To fully determine the position of the Sun, three coordinates must be defined. If the range between the Earth and the Sun is assumed to be fixed, so the position of the Sun can be located using two angles, the solar altitude and the azimuth [10, 37].
The solar altitude, α, is the angle in a plane determined by the zenith and the Sun between the horizon and the incident solar beam as shown in Figure 2.10. The angular perversion of
the Sun from the south can be represented by the azimuth angle ψ, which calculates the angular position of the Sun to the east or west of the south [10, 38].
Figure 2.10 Corners of the sky, height, azimuth, and angle of the hour [10, 37]
At solar noon, the angle of azimuth is zero and increases to the east. It is the angle between the observer's vertical plane intersection and the horizontal of the Sun [10].
It should note that the azimuth angle is referred to as the north in many publications so that the solar noon occurs at ψ= 180°. In fact, Compass angles are azimuth angles indicated to the magnetic north. Another important, though repetitive, angle in the definition of the Sun's location is the angular displacement of the Sun from the solar noon on the Sun's apparent travel plane. The angle of the hour is the distinction between midday and the preferred time of day in a 24-hour rotation of 360°. [10, 37] In other words,
𝜔 =12−𝑇
24 × 360° = 15(12 − 𝑇)° (2.4)
Where T is the moment of the day for solar mid of the day, a 24-hour clock. For example, T=10 am, ω = 30 °. By making ω reference to the other angles mentioned above, it can be shown the angle of sunrise by [10, 38]:
In addition, this means that the angle of sunset is given by –𝜔𝑠. This calculation is helpful
because it helps to estimate the number of hours that the Sun is over the horizon on a given day. to involve the hours from solar noon to sunset, thus the number of daylight hours (DH) by converting the angle of sunrise to hours from sunrise to solar noon, and then multiplying by two [10, 37]:
𝐷𝐻 = 48
360× 𝜔𝑠 =
cos−1(−𝑡𝑎𝑛 𝜙 𝑡𝑎𝑛 𝛿)
7.5 ℎ𝑜𝑢𝑟 (2.6)
The reader who loves trigonometry will evaluate two very important relationships between α and ψ. If δ, ϕ, and ω are known, then the location of the Sun at this location from this date and time, in terms of α and ψ, can be determined from
𝑠𝑖𝑛 𝛼 = 𝑠𝑖𝑛 𝛿 𝑠𝑖𝑛 𝜙 + 𝑐𝑜𝑠 𝛿 𝑐𝑜𝑠 𝜙 𝑐𝑜𝑠 𝜔 (2.7)
And
𝑐𝑜𝑠 𝜓 =𝑠𝑖𝑛 𝛼 𝑠𝑖𝑛 𝜙−𝑠𝑖𝑛 𝛿
𝑐𝑜𝑠𝛼 𝑐𝑜𝑠 𝜙 (2.8)
Note that angles are measured in degrees in all of the above expressions. Throughout the year, the highest spot of the Sun will be at θz = ϕ − 23.45° and the lowest point of the solar
noon Sun in the sky will be at θz = ϕ + 23.45°, provided that ϕ > 23.45° [10].
It is especially motivating to note that if ϕ > (90° − 23.45° = 66.55°), then under the horizon is the lowest point of the Sun in the sky, indicating that the Sun will not come or fall in that day. This is, of course, the case in the polar places, which are subject to 24-hour darkness. If ϕ < 23.45°, θz will be negative at some point in the summer. This purely means that the Sun will show north at solar noon. The relationships between θz, ϕ, and δ at solar noon are shown in Figure 2.11 [10, 37].
Figure 2.11 Relationships among zenith angle, latitude, and declination at solar noon in winter and summer [10]
As the last two equations are rather hard to visualize, for particular latitudes and days of the year it is easy to plot α versus ψ. Figure 2.12 displays a collection of altitude and azimuth plots at 40° N latitude. The curves indicate how high the Sun will be in the sky during a given month at a certain time of day, with the angle of azimuth calculated by the moment of the day [10, 39].
Figure 2.12 Solar altitude versus azimuth at 40 ° N latitude for different months of the year [39].
Surprisingly enough, when all the numerical work is done, it ends up with a response that does not account for the cloudiness. The most accurate method of cloud cover accounting is to make long-term calculations to define average figures [10]. Indeed, the precise prediction of PV systems' performance also relies on temperature. Thus, if sunlight data are included as a result of measured meteorological data, which include irradiance and temperature over an hourly basis for a given location for the 8760 hours per year, reasonably reliable estimates can be made of PV system performance [10].
Of course, measuring hourly data for a given year, say 2019, will not necessarily be a good predictor for other years. To achieve a better predictor for annual performance, experts have defined the typical meteorological year (TMY) by selecting data for each month from a different year [10].
2.10. WHAT IS A METEOROLOGICAL TYPICAL YEAR (TMY)?
Exemplary weather year is a set of chosen weather data for a particular place, showing hourly values of solar radiation and meteorological factors for a period of one year. The numbers are created from a database over a period of more than one year. It is specifically chosen to show the spectrum of weather events for the region in question, while still presenting annual averages associated with the long-term averages for the location in question [40].
TMY data is often used in construction modeling to determine the potential heating and cooling costs for building design. This is also used by developers of solar energy systems including solar hot water systems and solar thermal power plants on a large scale. Because they are normal rather than difficult conditions, they are not ideal for developing structures to withstand the worst conditions at a location. The reference data can be downloaded from the National Laboratory for Renewable Energy.
2.11. IRRADIANCE & IRRADIATION
Irradiance is the calculation of sunlight's power intensity and is expressed in W/m2. Irradiance is, therefore, an immediate amount and is often specified as sunlight intensity. The Earth's solar constant is that irradiance is received from the Sun at the earth's surface, for example, at AM 0, irradiance is equal to 1367 W/m2. The irradiance is reduced to about 1000 W/m2 after crossing the atmosphere with a path length of AM 1 [1, 10, 41]. For AM 1.5 the irradiance is admitted as the standard spectrum for PV cells.
Irradiation is a measure of sunlight's power density and is measured in kWh / m2. Since the energy is power combined over time, irradiation is the total of irradiance. The integration time frame is usually 1 day, which of course means during daylight hours [1, 10, 41].
Peak Sun Hours (PSHs) is often defined for Irradiation. The (PSHs) is simply the period in
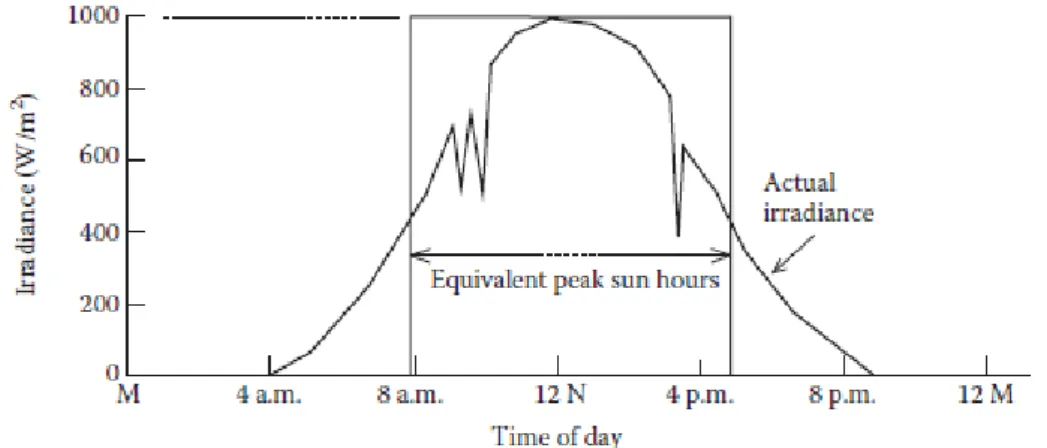
hours at 1 kW/m2 of irradiance required to product the daily irradiation gained from the total of irradiance throughout the hours of daylight. Figure 2.13 illustrates the result of this integration for an example day of sunshine with a few cloudy moments [10, 41].
Note that Figure 2.13 plots irradiance versus time in order to determine irradiation. All sunlight components are applied to irradiance and irradiation. The irradiation will rely on weather conditions, the location, and time of year at a given time, or for a given day. They will also rely on whether trees or buildings shade the panels and whether the panels are horizontal or angled. The daily irradiation is equivalent to the daily (PSHs) [10, 41].
Figure 2.13 Determination of (PSHs) or (irradiation) through the integration of
irradiance[10]
In order to assess the volume of appropriate irradiation for conversion to electricity at a given location, it is useful to establish multiple terms for panels irradiance, depending on the angle between the surface of panels and the light. It is also motivating to be able to calculate at a given location the hours of sunlight on a given day [10].
2.12. MAXIMIZING OF IRRADIATION
The developer of any device that absorbs sunlight will determine how the system can be installed. Maybe most systems can be easily installed horizontally. This approach does not optimize the working of panels, where the collected beam radiation component is symmetrical to the angle cosine between the incident beam and the panel's surface, as shown in Figure 2.14 [10].
Based on the ratio of diffuse to beam irradiance elements, there will be a proportion of the available energy obtained between cos γ and unity. Of course, the beam irradiance will only be a small fraction of the global irradiance in a highly diffuse environment. There are several options for horizontal mounting.
Since θZ = ϕ − δ determines the position of the Sun at solar noon, if this angle is adjacent to
the panel, it will be vertical to the Sun. Where the Sun is in the highest point in the sky leading in its minimum atmospheric path and the corresponding lowest air mass for the day. As the Sun travels over an angle of 15 ° per hour, it will be close to the panel for about 2 hours. After this time, due to the increase in air mass and the angle between the sunlight incident and the panel the density of the sunlight will decrease [10].
Figure 2.14 Two-dimensional of the collector [10]
Those two factors lead to a relatively rapid decrease in the energy produced by the collector among the hours before 10 am and after 2 pm. Figure 2.15 shows the approximate cumulative irradiation received by a south-facing panel tilted at the latitude angle in a place where the beam radiation element is significantly stronger than either the diffuse or the albedo elements [10].
Figure 2.15 Cumulative daily irradiation [10]
If the collector is positioned to track the Sun, then the irradiance will only be influenced by the air mass as the Sun reaches the horizon. Figure 2.15 indicates also the added accumulated irradiation provided by a tracker under direct beam conditions. During summer, 50 percent more energy can be approximately stored in dry weather using a tracker [10]. However, only about 20 percent more energy is collected through a tracker during the winter months [10].
It becomes an important economic decision for the engineer to use a two-axis tracker since a tracking mode is more expensive than a fixed one. To make the range of setting even more reasonable, a single-axis tracker can be considered which rotates perpendicular to θz around an axis. It is also possible to consider mountings that can be adjusted manually many times per day or perhaps several times per year [10].
Each of these choices will allow the complete set of energy between the optimal results of the fixed panel and the results of the two-axis tracker. The direction of the collector may also depend on the season. For example, a remote cabin, which is only used during the summer months, will need its collector oriented for ideal summer collection [10].
For optimum working on a given day, a fixed collector should be placed at a degree of ϕ − δ concerning the horizontal angle, as shown in Figure 2.16. This will induce the collector's plane to be perpendicular to the Sun at midday. For maximum seasonal efficiency, the average value of δ for the season is simply selected [10].
Figure 2.16 Optimizing the panel's angle [10]
2.13. THE ENERGY OF THE SUN
In concord with Planck's black body radiation formula, this power is irradiated from the Sun regularly in all paths. The energy intensity per unit area, 𝑤𝜆 , as a function of wavelength, 𝜆, is given by [42]:
𝑤𝜆 = 2𝜋ℎ𝑐2𝜆−5
𝑒(
ℎ𝑐 𝜆𝑘𝑇)−1
(w/m2/unit wavelength in meters) (2.9)
where h = 6.63 × 10⁻³⁴ W s2 (Planck’s constant), c = 3.00 × 10⁸ m/s (speed of light in a vacuum), k = 1.38 × 10⁻²³ J/K (Boltzmann’s constant), and T = absolute temperature of blackbody in K (Kelvin, where 0 K = −273.16°C) [10, 42]. This equation yields the energy intensity on the Sun's surface in W/m2/unit wavelength in meters. By the time this energy journeyed 150 million km to the Earth, the total density of extraterrestrial energy falls to 1367 W/m2 and is often called the solar constant [10].
2.14. DEVELOPMENT OF SOLAR PANELS
First, we have to mention the production of silicon solar cells. The production of crystalline silicon solar cells is a process we can split into several discrete steps, see figure 2.17.
At the first step is silica (SiO2 or sand) goes over a reduction process and takes shape
materials are refined to become at a purity level of around 99.999 % (5N) by the metallurgical grade silicon [1, 10, 31, 43].
Then two paths are possible for growing the silicon crystals resulting in either mono-crystalline silicon or multi-mono-crystalline silicon. Once the crystals are grown, wafers are made. The difference between these two types of silicon solar cell modules in cell conversion efficiency is typically 1.5-2% [1, 10, 31, 43].
Nevertheless, multi-crystalline silicon can be produced at a lower cost than mono-crystalline silicon. After the wafers are made, several steps are taken to fabricate the final cells including the doping and wiring. Lastly, the cells are assembled into solar modules [1, 10, 31, 43]. The remainder of this section will deal with each step in Figure 2.17.
Figure 2.17. Made-up processing from the raw material (sand) to the final solar panel [1].
2.14.1 From sand to high-quality silicon:
The crystal quality of the silicon is important since the diffusion length must be high to utilize the photons absorbed deep inside the cell. We will look at how silicon is produced in various qualities [1, 10, 43].
2.14.2 Metallurgical silicon:
The first step in refining silicon is to take SiO2 (sand) and reduce it to silicon. This process
takes place in an electric arc furnace, see figure 2.18. By adding silicon dioxide, coal, and thermal energy at approximately 1800 °C we get the following reaction [1, 10]:
Figure 2.18. Production of metallurgical silicon. Coal and SiO2 is added to the electric arc
furnace and reduced to silicon and carbon monoxide [1, 10]
From the furnace, we obtain metallurgical silicon with a purity of roughly 98%. This type of silicon is designated metallurgical silicon since its main usage is in the production of steel.
2.14.3 Polysilicon
Silicon for solar cells must be purified from the metallurgical silicon form, and this is accomplished through a complex process resulting in polysilicon, see the steps in figure 2.19. First finely ground metallurgical silicon is mixed with hydrochloric acid (HCl) in a fluidized bed reactor. This process results in trichlorosilane (SiHCl3) and thus the process is
named the Silane process[1, 10, 31].
2𝑆𝑖 + 3𝐻𝐶𝑙 → 𝑆𝑖𝐻𝐶𝑙3+ 𝑆𝑖 + 𝐻2
Figure 2.19. Production steps leading to polycrystalline silicon [1].
Metallurgical silicon is added to a fluidized bed reactor with hydrochloric acid forming trichlorosilane. The trichlorosilane is repeatedly distilled before the silicon is reclaimed in the Siemens reactor.
After the silane process, the trichlorosilane is further cleaned by repeated distillations eased by the low boiling point (31.8 °C) of trichlorosilane. The now purified trichlorosilane is fed into a Siemens reactor to reclaim the silicon, see Figure 2.19 [1, 10].
The gaseous trichlorosilane is fed past a heated (1350 °C) thin silicon rod onto which highly purified polycrystalline separates from the gaseous phase. The process results in large rods (e.g. 2-meter-long with 30 cm diameter) of at least 99.999 % pure polysilicon. For solar cell manufacturing, 99.999 % purity is considered the minimum acceptable purity. For the semiconductor industry, silicon purity of 99.999999999 % is considered normal for production of computer chips [1, 10, 43]. The polycrystalline silicon now has the desired purity, but the crystalline structure of the material is not good enough for solar cells. For silicon solar cells, either multi-crystalline or monocrystalline silicon is required [1, 10].
2.14.4 Multi-crystalline silicon
To produce multi-crystalline silicon, pieces of polycrystalline silicon are added to a graphite crucible and melted, see figure 2.20. Then the crucible is slowly cooled from the bottom, allowing small crystals to form at the bottom. These nanocrystals grow sideways until they touch each other. The vertical cooling profile allows the crystals to grow in columns, eventually resulting in a multi-crystalline ingot. Once the crystallization is completed, the silicon block is divided into cubes, which are then cut into wafers, see figure 2.22[1, 10].
Figure 2.20. Production of multi-crystalline silicon [1]
It starts with polysilicon melted in a crucible. At the bottom mono-crystals forms, when the crucible is cooled. Column growth is ensured by cooling the crucible from the bottom. The boundary layers between the different crystal orientations become recombination sites for holes and electrons in the finished solar cells, and therefore it is important to maximize the

![Figure 2.9 orbit of the Earth with the inclined polar axis around the Sun [35]](https://thumb-eu.123doks.com/thumbv2/9libnet/4244983.67214/35.892.195.762.238.553/figure-orbit-earth-inclined-polar-axis-sun.webp)
![Figure 2.10 Corners of the sky, height, azimuth, and angle of the hour [10, 37]](https://thumb-eu.123doks.com/thumbv2/9libnet/4244983.67214/37.892.177.753.242.505/figure-corners-sky-height-azimuth-angle-hour.webp)
![Figure 2.12 Solar altitude versus azimuth at 40 ° N latitude for different months of the year [39]](https://thumb-eu.123doks.com/thumbv2/9libnet/4244983.67214/39.892.167.717.539.867/figure-solar-altitude-versus-azimuth-latitude-different-months.webp)
![Figure 2.15 Cumulative daily irradiation [10]](https://thumb-eu.123doks.com/thumbv2/9libnet/4244983.67214/43.892.227.697.168.409/figure-cumulative-daily-irradiation.webp)
![Figure 2.16 Optimizing the panel's angle [10]](https://thumb-eu.123doks.com/thumbv2/9libnet/4244983.67214/44.892.156.716.141.544/figure-optimizing-the-panel-s-angle.webp)
![Figure 2.20. Production of multi-crystalline silicon [1]](https://thumb-eu.123doks.com/thumbv2/9libnet/4244983.67214/47.892.154.789.841.984/figure-production-multi-crystalline-silicon.webp)
![Figure 2.24. Structure of a glass-foil module in an aluminum frame[1].](https://thumb-eu.123doks.com/thumbv2/9libnet/4244983.67214/50.892.246.711.1021.1126/figure-structure-glass-foil-module-aluminum-frame.webp)
