ír L A T i
■ - г - / / * 4 , í f' ■^C
§
O r
\ ¥ Ι Λ
FiOyi^iES O N D €
0
:
A
THESIS
$yb2T5*îted to th e PacuJty of M an ag em en t
a n d th e
G faáüdáa
Schoo! of
ѢиЫпазз
A dm inistratloí
of Bllkant Unl^arsity
In Partial Pulfliment of the i^eqiikements
For # ]e O agrae of
Master of Btisiness Adir^nistration
INFLATION ACCOUNTING
AND EFFECTS OF INFLATION ADJUSTED
ACCOUNTING FIGURES ON DECISION MAKING
A THESIS
Submitted to the Faculty of Management
and the Graduate School of Business Administration
of Bilkent University
in Partial Fulfillment of the Requirements
For the Degree of
Master of Business Administration
By
ALİ İHSAN ÖZKAŞIKÇI
SEPTEMBER 1995
HF
ч ъ г ^
I certify that I have read this thesis and in my opinion it is fully adequate, ir\
scope and in quality, as a thesis for the degree of Master of Business
Administration.
Assoc.
Giiliz GER
I certify that I have read this thesis and in my opinion it is fully adequate, in
scope and in quality, as a thesis for the degree of Master of Business
Administration.
1 certify that 1 have read this thesis and in my opinion it is fully adequate, in
scope and in quality, as a thesis for the degree of Master of Business
Administration.
Asst. Prof Dr. Can ^imga MUCAN
Approve^day the dean of the Graduate School of Business Administraiton.
i ■ )
^
i /1 '
ABSTRACT
INFLATION ACCOUNTING
AND EFFECTS OF INFLATION ADJUSTED
ACCOUNTING FIGURES ON DECISION MAKING
BY
ALİ İHSAN ÖZKAŞIKÇI
M.B.A. TFIESIS
BİLKENT UNIVERSITY - ANKARA
SEPTEMBER 1995
Supervisor: Dr. Can Şiniğa MUGAN
Various studies in accounting have show n that, historical cost
m odel can n o t adapt itself to the changing econom ic environm ent. The
change that is being suggested is a m odification to the existing
accounting practice of reporting only historical cost inform ation. The
scope of this case study is to find out w hether inflation adjusted
accounting figures is necessary for m eaningful decision making by the
user of the financial statem ent. General Price Level Accounting has been
selected as an accepted m ethodology for revaluation.
Keywords: Inflation, Inflation Accounting, Historical Cost Accounting,
General Price-Level Accounting, Revaluation
ÖZET
ENFLASYON MUHASEBESİ
VE ENFLASYONA GÖRE AYARLANMIŞ MUHASEBE VERİLERİNİN
KARAR-ALMA ÜZERİNDEKİ ETKİLERİ
HAZIRLAYAN
ALİ İHSAN ÖZKAŞIKÇI
İŞLETME YÜKSEK LİSANS TEZİ
BİLKENT ÜNİVERSİTESİ - ANKARA
EYLÜL 1995
Tez Yöneticisi: Dr. Can Şnnga MUĞAN
Muhasebe alanında yapılmış çeşitli araştırmalar, geleneksek
m uhasebe sistem inin değişen ekonom ik yapıya uyum sağlamadığını
göstermektedir. Önerilen değişiklik, yalnızca geleneksel muhasebe sistemi
ile yapılan raporlama sistem ini düzenlemektir. Bu vaka çalışmasının
kapsamı, enflasyona göre düzeltilmiş muhasebe rakamlarının finansal
tablo kullanıcılarının anlamlı kararlar vermelerine yardımcı olup
olm adığının
araştırılmasıdır.
Yeniden
değerlendirme
için,
geçerli
metodlardan, Fiyatlar Genel Seviyesi Muhasebesi seçilmiştir.
ACKNOWLEDGEMENl S
I gratefully acknowledge tire encouragement, guidance, advise and
friendly supervision of Dr. Can §imga MUGAN during the preparation of
this thesis. Helpful com m ents of Assoc. Prof.Dr. Dilek ONKAL and Assoc.
Prof.Dr. Gtiliz GER is also appreciated.
1 w ou ld like also to extent m y best regards to Hasan SUEL for his
sincere support during this study.
Finally, 1 w o u ld like to express m y gratitu d e to m y p aren ts for th e ir
endless a n d c o n tin o u s su p p o rt n o t o n ly d u rin g th e th esis work, b u t
th ro u g h o u t m y M.B.A. ed u catio n .
TABLE OF CONTENTS
ABSTRACT
i
ÖZET
ii
ACKNOW LEDGEMENTS
iii
LIST OF TABLES
iv
CHAPTER 1
INTRODUCTION
1
CHAPTER 2 FINANCIAL REPORTING AND INFLATION
3
2.1. Do We Need Inflation Accounting ?
3
2.2. Alternative Financial Reporting Approaches
4
2.2.1. General Price-Level Accounting
4
2.2.2. Current Value Accounting
5
2.2.3. Current Value/General Price-Level Accounting
6
2.3. Results o f Inflation Accounting: A Literature Summary ...
6
2.4. Inflation Adjustments in Turkish Codes ...
7
CHAPTER 3 DATA & METHODOLOGY ...
9
3.2. Process and Analysis
3.2.1. Selection o f the Price Index
3.2.2. Monetary and Non Monetary Classifications
3.2.3. Adjustment o f Balance Sheet Items
3.2.4. Analysis
3.3. Effects o f Adjusted Statements on Decision Making
3.3.1. The Difference Between Financial Ratios o f
General Price-Level and Historical Cost Accounting Systems
3.3.11. Operating Cash Flow to Current Liabilities
3 .3 .1
.
2
.
Working Capital to Total Assets
3.3.1.3. Rate o f Return on Assets
10
11
12
13
14
14
10
14
14
15
3.3.1.4. Rate o f Return on Common Shareholders' Equity
18
3.3.1.5. Long-Term Debt Ratio
3.3.1.6. Debt/Equity Ratio
20
21
3.3.1.7. Cash Flow From Operations to Total Liabilities
21
Ratio
3.3.1.8. Total Liabilities/Owner's Equity
22
CHAPTER 4 SUMMARY AND RECOMMENDATIONS
4.1. Summary
4.2. Recommendations
4.3. Response from the Management
4.4. Comparison with Revaluation Fund
24
24
25
27
27
APPENDIX A
MONTHLY CUMULATIVE ACCOUNTING DATA
APPENDIX B
DESCRIPTION OF MONETARY AND NON MONETARY ITEMS
APPENDIX C
BALANCE SHEETS AND INCOME STATEMENTS
APPENDIX D
RESULTS OF HYPOTHESIS TESTING
APPENDIX E
SUMMARY OF FINANCIAL STATEMENT RATIOS
APPENDIX F
MONTHLY FINANCIAL RATIOS
LIST O F TA BLES
Table 1; Monthly Wholesale Price Increase Rates ( % ) ...
10
In Private Food Manufacturing
Table 2: Classification o f Monetary and Non Monetary Ite m s ...
11
Table 3: Operating Cash Flow to Current Liabilities R a tio ...
14
Table 4; Working Capital to Total Assets R a tio ...
14
Table 5; Rate o f Return on A sse ts...
15
Table 6: Total Asset Turnover R a tio ...
16
Table 7; Rate o f Return on Common Shareholders'E quity...
18
Table 8:
Leverage R a tio ...
19
Table 9:
Long-Term Debt R a tio ...
20
Table 10: Debt-Equity R a tio ...
21
Table 11: Cash Flow From Operations to Total Liabilities R a tio ...
21
Table 12: Total Liabilities/Owner's Equity R a tio ...
22
Table 13: Price In d ic e s...
27
Table 14: Historical Cost Based Accounting Figures Including the Revaluation
28
Fund
Table 15: General Price-Level Based Accounting F ig u res...
28
CHAPTER 1
INTRODUCTION
Accounting is means o f communicating the economic events o f an entity. The
economic events are identified by economic resources controlled by the entity and their
changes.
A financial statement is useful, since it represents the financial position and the
operating results o f the firm.The information provided in the financial statements should
facilitate comparison o f the performance o f the entity with other enterprises as well as
performance o f the entity over time.Financial ratios, on the other hand, are a convenient way
to summarize large quantities o f financial data and to compare firms' past performance with
current time.
Inflation in Turkey starts to play an important role in the economy especially, after
the Cyprus war and the petroleum crisis in 1974. It had become the most important item for
the governments and also for the public, but the problem is not solved yet. Instead, the public
is used to live with high inflation for many years.
In 1982, the first application o f inflation accounting was introduced as revaluation
fund. The government sets a certain percentage to revaluate assets at the end o f each fiscal
year. The percentage set for revaluation is constant for every industry but, inflation amount is
different from one industry to the other. Therefore, this method o f revaluating is
unsatisfactory.
In this study, monthly accounting data's were converted to balance sheets and income
statements are prepared. Considering the fact that, the monthly inflation rate in Turkey is
usually more than the yearly inflation in developed countries, monthly corrections in
accounting data will supply more meaningful information.
In chapter 2, the need for inflation accounting was discussed. Also, some information
was given about alternative accounting methods and adjustments in Turkish Codes . In
Chapter 3, the data and methodology were described. The analyses o f the results o f inflation
accounting were also made in this chapter. In chapter 4, the study was summarized and
recommendations were stated.
The goal o f this case study is to explore whether inflation adjusted accounting figures
is necessary for meaningful decision making by the user o f the financial statement.
CHAPTER 2
FINANCIAL REPORTING AND INFLATION
2.1. Do We Need Inflation Accounting ?
The goals o f the entity are normally economic goals. Consequently, the measurement
is primarily economic performance measurement.Any measure o f performance generated by
the accounting system must be relatively free o f dispute, and the measurement has to be highly
standardized and verifiable so that, it is relatively insulated from the pressures that may be
exerted by the interested parties o f their self interest.The virtue o f historical cost accounting
lies in the fact that, the rules under historical accounting are the least ambiguous o f the
methods o f accounting measurement. Because o f it's near complete verifiability, the difference
between measurer to measurer is likely to be the least.
The principle o f historical costs has remained fundamental to accounting
methodology for centuries. In fact, even today a large majority o f transactions are recorded
and reported based on historical costs. This, to some extent, is an indication o f its usefulness.
On the other hand, in a world o f changing prices, accounting information based on
historical cost principle can not adopt itself to the environment and hence doesn't aid the user
o f the financial statement for meaningful decision making. Because, in historical cost financial
statements the cost figures represents the figures o f a year ago, which in fact are not
comparable to current cost levels.
Adoption o f general price-level accounting doesn't mean discarding o f historical cost
accounting. The recording o f actual transactions in the past is still required for control
purposes. The alternative suggested is the simultaneous operation o f the historical cost and
general price-level systems o f accounting.
2.2. Alternative Financial Reporting Approaches
To meet the demand for more relevant information, three different solutions have
been offered.
2.2.1. General Price-Level Accoiiniing
A currency has a real value that is determined by the amount o f goods and services
for which it can be exchanged. I'his real value is commonly called purchasing power. As the
economy experiences periods o f inflation (rising price levels) or deflation (declining price
levels), the amount o f goods and seiwices for which a currency can be exchanged changes; that
is, the purchasing power o f a currency change from one time period to the next.
The aggregation o f specific prices at any particular time constitutes a general price
level. A general price level change recognizes the change in the value o f money in all its uses.
General price-level accounting is historical cost data adjusted for changes in the unit
o f measurement. If general price-level fluctuations are extreme enough to make cost data less
useful than desired, financial statements adjusted for price-level changes can be prepared from
the historical cost data.
General price-level accounting changes the measuring unit but retain the historical
cost reporting model.
The restatement is accomplished by multiplying the amount to be restated by a
fraction, the numerator o f which is the index for current prices and the denominator o f which
is the index for prices that prevailed at the date related to the amount being restated.
In preparing general price-level financial statements, it is essential to distinguish
between monetary items, and non monetary items.'
The advantages o f this approach are that it is simple to compute, objective in nature,
and easy to understand.
2.2.2. Current Value Accounting
Proponents o f this approach argue that the problem is not with the unit o f measure
but rather with the historical cost model. Current value accounting retains the measuring unit
but departs from the historical cost reporting model.
Their position is that users o f financial statements are primarily interested in what the
business is worth now, rather than what costs were incurred at some point in the past. Their
argument is based on the notion o f economic asset value, which conceptually is the present
value o f the future receipts from the particular asset in question.
Technically, the value o f an asset could change even during periods o f general price
stability, due to factors like technological change or change in the demand-supply situation o f
the asset.
The term current value has been adopted as the generic term representative o f the
process that reports an entity's resources and obligations on the basis o f present worth, using
any o f several means or techniques o f evaluation.
The three most commonly advocated concepts o f current value are;
1.
Present Value : discounted future cash flows.
2.
Net Realizable Value : current cash equivalents.
3.
Current Cost
Present value relates to the future cash inflows and outflows that can be attributed to
or related to the specific item or group o f items being measured. Present value is measured by
discounting at an appropriate interest rate the future estimated net cash inflows, or cost
savings, o f the item being valued.
A net realizable value model is based on the premise that the value o f the asset is the
selling price o f the asset in the market less cost o f disposal, instead o f its purchase price or
replacement cost. The criticisms o f this model are that some assets do not have ready market
price, that the computation o f value is subjective, and that many assets are held for use, not
sale, so that market value is not useful information.
Current cost is the cost o f replacing the identical asset owned, that is, one o f the
same age and the same operating capacity. Current cost may be approximated in a variety o f
ways but often is computed by applying a specific price index to the historical cost or book
value o f assets.
2.2.3. CurretH Value/GeneraJ Price-Level AccomHijig
A
third group contends that both the units o f measurement and the historical cost
model should be changed. Advocates o f this approach argue that the unit o f measurement
must be standardized and that after standardization some form o f current value accounting
should be employed.
2.3.
Results of Inflation Accounting: A Literature Summary
□
The gains and losses in purchasing power with respect to assets and liabilities
run to considerable amounts even if the rates o f price increases are not very
high.
□
The results o f inflation accounting depend to a high degree on the selection o f
the price index which is used as an indicator for the general price development.
Even slight differences in price trends do have a considerable impact on the
results o f purchasing power measurement.
□
Under general price level system, profit rates in the economy would be likely to
decline.
□
A number o f studies have concluded that the profit rates and both the rates o f
return in manufacturing had declined.
□
In restated accounting figures, the amount o f assets in total assets is decreasing.
The amount o f fixed assets, and therefore accumulated depreciation is
increasing.
□
The amounts o f current and long term-liabilities in total liabilities
are
decreasing, due to an increase in shareholder's equity.
2.4. Inflation Adjustnicnts in Turkish Codes
In 1982, the Turkish Ministry o f Finance has changed the accounting regulations, and
first applications o f “revaluation fund” ^ had begun.
At the end o f each fiscal year, the ministry sets a certain percentage to revaluate the
fixed assets. The asset in the balance sheet which can be depreciated and the amount o f
accumulated depreciation is multiplied by a factor, and thus revaluated. The increase due to
revaluation is shown in the revaluation fund account in shareholders' s equity. Revaluated
figures are stated as the beginning value for the following year's accounting statement.
The revaluation amounts can be added to the capital. If so, the amount added is
considered as an asset supplied by the shareholder's, and the amount is free o f taxation. If the
revaluation amounts are transferred to different accounts than capital, then they will be
considered as profits, and will be taxed.
If the revaluated asset is sold, similar to depreciation, the revaluated amount is
subtracted from the statements.
This method, in some way, prevents the depreciation o f capital. On the other hand, if
any gain obtained on retirement o f assets, by this method the company can write this gain in
the revaluation fund account, which will be tax proof for three years.
CHAPTER 3
DATA & METHODOLOGY
3.1. Data
In this study, inflation accounting adjustments are made on monthly basis. As, the
monthly inflation rates in Turkey are higher than the yearly inflation rates in developed
countries, restatement o f accounting figures on monthly basis will give more meaningful
information. Also, the management will be informed on monthly basis about the changing
economic conditions, which is a necessity in a dynamic economic environment. On the other
hand, the governments are making frequent changes in Turkish Codes, therefore monthly
analysis becomes very important.
Five year (1989-1993) monthly accounting figures o f a food manufacturing firm was
provided from the accounting department. Then, the effects o f beginning (except January
1989) and ending balance were eliminated from the figures, leaving out only the monthly
transactions. Finally, the figures were added together to obtain a monthly cumulative
accounting data on yearly basis (See Appendix A).
In this study, general price-level accounting method is used since;
□
General price-level accounting eliminates the effects o f price-level changes
without having to develop a new structure o f accounting; that is, it preserves the historical
cost-based accounting system that is currently used and understood.
□
General price-level accounting enhances comparability o f financial statements
o f a single firm, and also preserves comparability o f financial statements between firms if a
common price index is used.
U
In 1'urkey, neither we have specific price indexes which must be used for
current value method, nor an established market to determine the market price for some
assets.
3.2. Process and Analysis
3.2.1. Selection o f the Price Index
d’he results o f the inflation accounting depend to a high degree on the selection o f the
price index which is used as an indicator for the general price development. Even slight
differences in price trends do have a considerable impact on the results o f purchasing power
measurement.^ The index selection should essentially be determined by the objective o f the
analysis. In the analysis, the wholesale price index in food manufacturing industry obtained
from state statistical institute was used.
TABLE 1; MON ITILY W HOLESALE PRICE INCREASE RATES (%)
IN PRIVATE FOOD MANUFACTURING
MONTHS
1989
1990
1991
1992
1993
JANUARY
.1.9
6.4
5.7
7.8
4.5
FEBRUARY
1.9
1.2
3.8
3.4
4.5
MARCH
2.4
2.0
2.2
4.2
4.1
APRIL
6.6
3.0
3.4
2.7
3.7
MAY
7.7
2.3
4.2
3.6
3.2
JUNE
8.2
1.7
2.2
5.6
4.0
JULY
3.9
1.4
2.5
5.4
1.8
AUGUST
3.7
4.4
3.4
2.6
5.1
SEPTEMBER
2.8
4.9
9.8
5.0
6.8
OCTOBER
1.5
4.9
6.2
6.1
8.2
NOVEMBER
2.8
4.3
4.5
4.4
7.4
DECEMBER
3.5
4.1
5.1
4.9
4.9
Source: State Statistical Institute
Liitzel, H., Inflation Accounting for the Federal Repnblie of Germany Results Using DilTerent Deflator Price
Indiees, Review of Ineoine and Wealth Iss. .1 1985, pp. 207 - 221
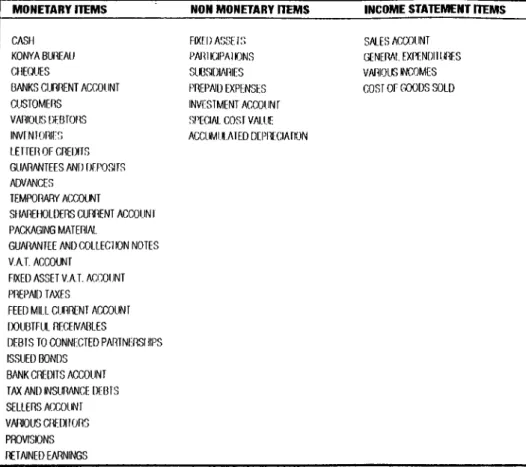
5.2.2.
Momtary and Non Monetary Classifications
M onetary items automatically gain or loose general purchasing power during inflation
or deflation as a result o f changes in the general price-level index.
On the other hand, holders o f non monetary items may lose or gain with the rise or
fall o f the general price-level index if the non monetary item does not rise or fall in proportion
to the change in the price-level index. In other words, a non monetary asset or liability is
affected;
(a)
by the rise or fall o f the general price level index and,
(b)
By the increase or decrease o f the fair value o f the non monetary
item.
TABLE 2: CLASSIFICATION OF MONETARY AND NON MONETARY ITEMS ^
MONETARY ITEMS NON MONETARY ITEMS INCOME STATEMENT ITEMS
CASH KONYA BUREAU CHEQUES
BANKS CURRENT ACCOUNT CUSTOMERS
VARIOUS [)EBE0i^S INVENiORIES LETEEROECREDITS GUARANTEES AND DEPOSliS ADVANCES
TEMPORARY ACCOUNT
SHAREHOLDERS CURRENT ACCOUNI PACKAGING MATERIAL
GUARANTEE AND COLLECI ION NOTES V.AT. ACCOUNT
FIXED ASSET V.A.T. ACCOUNT PREPAID TAXES
FEED MILL CURRENT ACCOUNT fX)UBTEUL RECEIVABLES
DEBIS TO CONNECTED PARTNERSI UPS ISSUED BONDS
BANK CREDITS ACCOUNT TAX AND INSURANCE DEBTS SELLERS ACCOUNT VAfTO S Cf^EDIiORS PROVISIONS RETAINED EARNINGS
FIXED ASSETS PARI ICIPAl IONS SUBSI[)IARIES PREPAID EXPENSES INVESTMENT ACCOUNT SPECIAL COST VALUE ACCUMULATED DEPRECIATION
SALES ACCOUNT GENERAL EXPENT)nURES VARIOUS INCOMES COSTOEGOOT^S SOLD
3.2.3. Adjustinent o f Balance Sheet Item.s
For meaningful analysis, the effect o f revaluation fund is removed from the restated
financial statement by deducting the fund amount from the assets and equities.
Also, the depreciation is not adjusted with an index. Instead, the monthly
depreciation o f the inflation adjusted asset value is recalculated in the adjusted financial
statement according to fl’uikish Tax Procedural Code.^
Two different depreciation methods are being used in Turkey;
1.
Normal - in equal amounts (20 %) in 5 years.
2.
Accelerated - 40 % each year, and the residual in fifth year.
The company decides on the method according to the profit level. If the profit is high
for a certain year, the company uses accelerated depreciation for the goods purchased during
that year. If not, they prefer normal depreciation. During the period 1989-1993 both methods
were used by the company, which were kept as same for restatements.
Restatement o f Accountinц Fiaures
Vii
; value according to historical cost method
V
r
: restated value
10
: prior period index
11
: beginning period index
L·
; ending period index
r
: inventory turnover rate
Ir
: index at r months prior to beginning period
L
; entry period index for an accounting figure
In
: exit period index for an accounting figure
Restatement o f Monetary Items
V
r
=
V
h x
(I
i
+ I
o
)
Restatement o f Non Monetary Items
V
r
= V
h
X (In -I-1.)
Restatement o f Income Statement Items
V
r
=
V
h
X
[(lo
+
Ii)
^
2]
+
lo
Restatement o f Inventories
V
r
= V
h
X (Ii H- Ir)
3.2.4. Analysis
After obtaining monthly historical and restated accounting figures, monthly balance
sheets and income statements were prepared (See Appendix C).
Then, the historical and restated balance sheets and income statements were used for
monthly financial ratio analysis (See Appendix E and F).
Finally, in order to prove that, there is a significant difference between the historical
and restated financial ratios, a hypothesis test was conducted.
Hypothesis Testing To Compare Means
Ho:
\i\
=
[L·
Ha:
pii ps pi2
Test Statistic
M ST/MSE
Assumptions
1. Both population probability distributions are normal.
Rejection Region :
F > Fa
3.3. Effects of Adjusted Statements on Decision Making
3.3.1. The Difference Between Financial Ratios o f General Price-Level and
Historical
Cost Accounting Systems
3.3.1.1, OperatinR Cash Flow to Current Liabilities
TABLE 3: OPERATING CASH FLOW TO CURRENT LIABILITIES RATIO
(YEARLY AVERAGE FIGURES OBTAINED FROM APPENDIX F)
1989
1990
1991
1992
1993
Historical
276 %
50 %
121 %
326 %
71 %
Restated
254 %
.116%
346 %
507 %
105 %
Cash flow from operations in restated figures is much higher than the historical
figures. This dilTerence is due to high increases in depreciation amount. Since, the restated
fixed assets shows an increase compared to historical method o f accounting, the depreciation
amount is also increased significantly.
Operating cash flow to current liabilities ratio is used to test possible financial
distress.
In restated figures, the company shows much healthier situation as the liquidity is
improved. The ratios obtained from the restated figures enables the company to a build-up in
current liabilities if necessaiy.
3.3.1.2. Working Capital to Total Assets
TABLE 4: W ORKING CAPITAL TO TOTAL ASSETS RATIO (YEARLY
AVERAGE FIGURES OBTAINED FROM APPENDIX F)
1989
1990
1991
1992
1993
Historical
45 %
28%
23 %
38 %
23 %
This ratio indicates the relative liquidity o f total assets and distribution o f resources
employed as to liquidity.
The increase in fixed asset for restated figures is effecting the outcome o f ratio
analysis by decreasing the working capital to total assets ratio.
The ratios obtained from the restated figures shows weaker current position. The
assets are less liquid, which increases the short-term risk.
The current asset needs to be improved. This improvement can be made by an
increase in long-term borrowing since, the company can increase it's debt capital.^
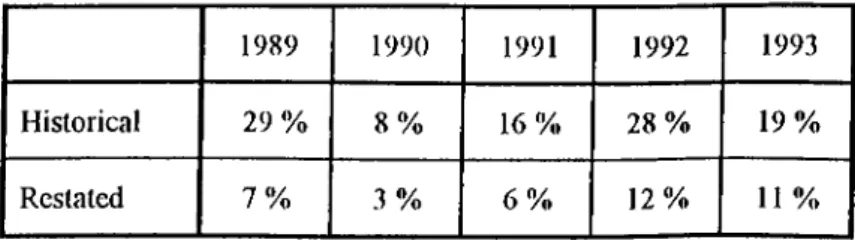
3.3.1.3. Rate o f Return on Assets
TABLE 5: RATE OF RETURN ON ASSETS (YEARLY AVERAGE FIGURES
OBTAINED FROM APPENDIX F)
1989
1990
1991
1992
1993
Historical
29 %
8%
16%
28%
19%
Restated
7%
3%
6%
12%
11 %
The rate o f return on assets measures a firm's performance in using assets to generate
earnings independent o f the financing o f those assets.
To study changes in the rate o f return on assets, we can disaggregate the ratio into
two other ratios, as follows;
Rate o f Return = Profit Margin x Total Asset Turnover
on Assets
Ratio
Ratio
The profit margin ratio measures a firm's ability to control the level o f expenses
relative to revenues generated.
The total asset turnover ratio measures a firm's ability to generate revenues from a
particular level o f investment in assets.
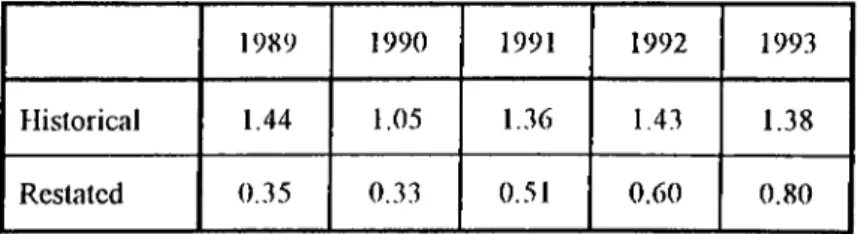
TABLE 6: TOTAL ASSET TURNOVER RATIO (YEARLY AVERAGE FIGURES
OBTAINED FROM APPENDIX F)
1989
1990
1991
1992
1993
Historical
1.44
1.05
1.36
1.4.1
1.38
Restated
0..15
0.33
0.51
0.60
0.80
The rate o f return on assets ratio shows a significant decrease in restated values.
Profit margins are exactly the same for both methods, but asset turnover obtained from
restated figures are also lower.
The value o f fixed assets, when restated, increases significantly. As the revenues do
not show too much difference, an increase in assets results in a decrease in above mentioned
ratios.
The rate o f return on assets has particular relevance to lenders, or creditors, o f a firm.
When extending credit or providing debt capital to a firm, creditors want to be sure that the
return generated by the firm on that capital (assets) exceeds its cost.
Starting from 1989, the company invested an excessive amount for a new mill. By
this investment, the company is planning to increase its production approximately three times
it's current level. As the executives tried to finance this investment from the earnings
generated, the new mill started operating at the end o f 1994.
A significant decrease for both total asset turnovers and return on assets is a result o f
this huge investment.
The current depreciation and revaluation methods according to Turkish accounting
procedures do not reflect the efiects o f high inflation in Turkey. Therefore, the book values o f
these assets are significantly lower than the actual market price for these assets.
As an example, the book value for the new investment is nearly $ 1 .3 million. On the
other hand, the company has invested approximately $ 10 million. A recent auditing report
prepared by “KPMG Optima Management Consulting” for the company points out the same
difference.
. The effects o f such a decrease in return on assets might be;
□
difficulty in finding creditors,
□
increased interest rates for borrowings,
since, the restated figure shows lower earnings generated from assets (higher risk).
Other possible changes in decision making can be explained as follows:
□
In acquisitions, mergers or in stock's exchange markets, the value o f the
company will be lower, if the ratios are evaluated from restated accounting datas.
□
Better control on the level o f investments will be possible under the new ratios.
The management will try to minimize the investment period and/or, to increase the revenues
generated from assets.
Another important point is taxation. If a firm shows the real market price, in
accounting figures, for an asset, and sell the asset according to the market price, than the firm
is obliged to pay an increased amount o f tax. Therefore, in Turkey, in buying and selling o f
assets, the value o f an asset is stated a value close to the book values instead o f its real price.
By changing the accounting methods to restated model, the government can increase its tax
income significantly.
Finally, the corporation in Turkey needs to invest more frequently, when compared to
their European associates, to minimize the tax amount, and to protect their capital against
inflation. By changing the accounting methods, companies will be protected well against
inflation.
3.3.1.4. Rate o f Return on Common Shareholders' Equity
TABLE 7: RATE OF RETURN ON COMMON SHAREHOLDERS' EQUITY
(YEARLY AVERACiE FIGURES OBTAINED FROM APPENDIX F)
1989
1990
1991
1992
199.3
Historical
41 %
to %
17%
.11 %
25%
Restated
8%
2%
5%
12 %
11 %
The rate o f return on common shareholders' equity measures a firm's performance in
using assets to generate earnings. Unlike the return on assets, it explicitly considers the
financing o f those assets.
This ratio primarily interests investors in a firm's common stock.
We can disaggregate the return on common stock into several components as
follows:
Rate o f Return
on Common
Shareholder's
Equity
Profit Margin X Total Asset Turnover x Leverage
Ratio
Ratio
Ratio
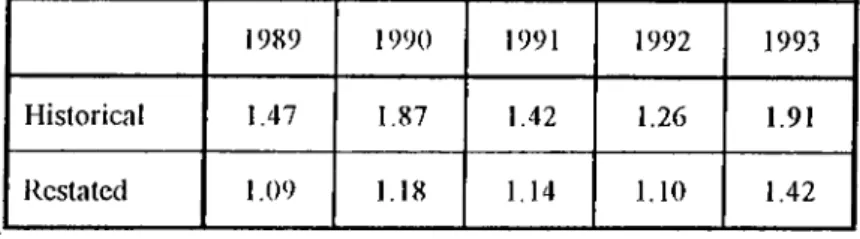
The leverage ratio indicates the extent to which common shareholders provide
capital.
TABLE 8: LEVERAGE RATIO (YEARLY AVERAGE FIGURES OBTAINED
FROM APPENDIX F)
Historical
Restated
1989
1.47
1.09
1990
1.87
1.18
1991
1.42
1.14
1992
1.26
1.10
1993
1.91
1.42
The leverage ratio obtained from the restated figures shows a significant decrease
thus, meaning that, the portion o f capital common shareholder's provide is higher. The reason
for the decrease is; to balance the assets and liabilities in restated balance sheets, the difference
is added to profit reserves in shareholder's equity. The relative increase in equities, compared
to assets, results a decrease in leverage ratio.
The equity capital is more costly, since the investors have higher expectations and
interest on debt is tax deductible.
Financial leverage increases the return on common shareholder's equity when the
return on assets is higher than the after-tax cost o f debt. The greater the proportion o f debt in
capital structure, however, the greater the risk the common shareholders bear. Lenders,
including investors in a firm's bonds, require increasingly higher returns to compensate for this
additional risk. At some point, the after-tax cost o f debt will exceed the return on assets. At
this point, leverage no longer increase the potential return on common stock holder's equity.
In summary, the difference in leverage amount under historical and general price-level
accounting methods may effect the debt capital amount. If the ratios were calculated according
to general price-level method than, the company could increase the debt capital by increasing
long-term borrowings. ^
If the ratios were calculated according to restated figures, than;
□
the price in stocks exchange may be lower and,
□
the value o f the company may decrease in mergers and acquisitions
since, the return on shareholders' equity is significantly lower under the general price-
level accounting method.
Under the new circumstances, the managers will try to increase the rate o f return on
common shareholder's equity by increasing debt capital.
3.3.1.5. Lon.g-Term Debt Ratio
TABLE 9: LONG-TERM DEBT RATIO (YEARLY AVERAGE FIGURES
OBTAINED FROM APPENDIX F)
1989
1990
1991
1992
1993
Historical
7%
19%
8%
7%
16 %
Restated
1 %
4%
3 %
3 %
8%
This ratio reports the portion o f the firm's long-term capital that is furnished by debt
holders.
As explained previously," the equity capital is more costly, and the debt capital can
increase the value o f the firm up to a point.
The restated figure shows that, the firm has improved its ability to meet fixed interest
and principal payments in the future, when compared to historical figures. The company can
afford to take on some additional risk by obtaining funds from issuing bonds or borrowings
from banks.
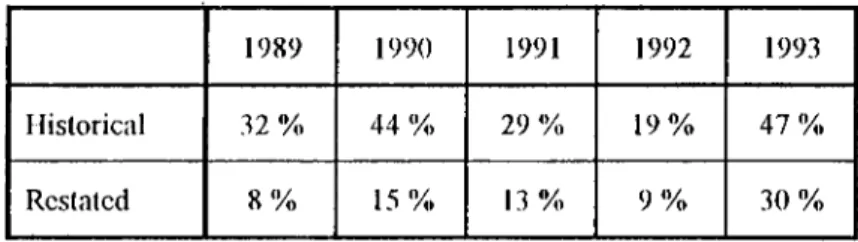
3.3.1.6. Debt/Equity Ratio
TABLE 10: DEBT-EQUITY RATIO (YEARLY AVERAGE FIGURES OBTAINED
FROM APPENDIX F)
1989
1990
1991
1992
1993
Historical
,12 %
44%
29 %
19%
47%
Restated
8%
15%
13 %
9%
30%
Similar to long-term debt ratio, the ratios obtained from restated figures shows better
situation when compared to historical method.
3’he firm is using more o f owner's equity. The firm can undertake more risks by
raising funds.
3,3.1.7. Cash Flow From Operations to Total Liabilities Ratio
TABLE 11: CASH FLOW FROM OPERATIONS TO TOTAL LIABILITIES RATIO
(YEARLY AVERAGE FIGURES OBTAINED FROM APPENDIX F)
1989
1990
1991
1992
1993
Historical
107 %
35 %
106 %
203 %
59 %
Restated
104 %
202 %
303 %
345 %
86 %
This ratio, unlike the debt ratios, considers the availability o f liquid assets to cover
various levels o f debt.
Due to increased depreciation amounts under the general price-level method when
compared to historical method, cash flow from operations in restated figures are much higher
than those in historical figures, which results in a higher ratio.
When we compare the differences in ratios between two methods; restated figure
shows a better situation. The availability o f liquid assets is increased, decreasing the long-term
liquidity risk.
The company can undertake more risks by raising funds from issuing bonds,
borrowings from bank, etc.
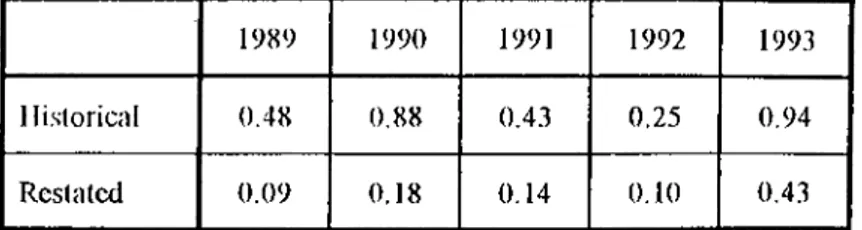
3.3.1.8. Total Liabilities/Owner's Equity
TABLE 12:
TOTAL LIABILITIES/OWNER'S EQUITY RATIO (YEARLY
AVERAGE FIGURES OBTAINED FROM APPENDIX F)
1989
1990
1991
1992
199.3
llislorical
0.48
0.88
0.4.3
0.25
0.94
Restaled
0.09
0.18
0.14
0.10
0.43
It shows relative amounts o f resources provided by creditors and shareholders.
The decrease in ratios for restated figures indicates the same outcome as “debt-
equity” and “long-term debt” ratios; possibility to increase debt capital.
3.3.2. Advantages and Disadvantages o f Restatements
Advantages o f general price-level financial statements are:
1. The general price-level accounting only changes one fact in historical accounting;
currency is not stable. Other implementations o f historical method are kept the same.
2. General price-level financial statements provide more meaningful information in
terms o f current economic conditions.
3. General price-level accounting is more objective compared to other accounting
methods. Therefore, auditing o f restated accounting data is quite easy.
Disadvantages o f general price-level financial statements are:
1. There is no general agreement as to which price-level index to use and how it
should be applied.
2. The value o f an asset could change even during periods o f general price stability,
due to factors like technological change or change in the demand-supply situation o f the asset.
Therefore, adjustment to financial statements under general price-level accounting is less
meaningful compared to other methods.
3. Historical costs have been employed traditionally over many years with satisfactory
results.
CHAPTER 4
SUMMARY AND RECOMMENDATIONS
4.1. Summai'y
The management o f a company is o f necessity concerned about the composition o f its
capital structure and about the changes and trends in earnings.
The interpretation and evaluation o f financial statement data require familiarity with
the basic tools o f financial statement analysis.
Various studies in accounting have shown that, historical cost model can not adapt
itself to the changing economic environment. The change that is being suggested is a
modification to the existing accounting practice o f reporting only historical cost information.
Three different solutions exists for accounting to adapt itself to the changed
economic environment;
1. General price-level accounting
2. Current value accounting
3. Current value/general price-level accounting
In order to modify the current accounting system; first, five year monthly accounting
data is obtained. Than, monthly balance sheets and income statements were prepared, and first
set o f financial ratios were calculated.
To evaluate the results o f inflation accounting and to prove the significance; first, the
effect o f revaluation fund was removed from the historical data. Than, monetary and non
monetary items were classified and the balance sheets and income statements were adjusted
with a selected price index.
Finally, after obtaining the second set o f financial ratios from adjusted balance sheets
and income statements, a hypothesis test was conducted to verify any significant difference
between two sets o f information,
The analysis shows that, there is a significant difference in some ratios obtained from
two different accounting methods; the historical model and the general price-level model.
The difference is arising from two different items;
1. An increase in the value o f fixed assets
2. An increase in shareholder's equity
A difference in the financial ratios has an important effect; a change in management
decision making. Under the new circumstance, the company will raise funds by increasing its
long-term borrowings. The funds obtained will be utilized to improve the current assets.
Finally, under general-price level accounting the company (own capital) will be
protected against the inflation. Increased depreciation amounts (compared to historical cost
model) will provide to pay less corporate tax if, the general price-level accounting method is
accepted by the tax authorities and the government.
4
.
2
.
Recommendations
The company policy for many years was to be self sufficient. The management was
keen not to use bank credits. Therefore, all the cash necessary for the investments were
supplied from the earnings. At the end, the long investment period, as a result o f using own
capital, pushed the company in deep financial problems in 1994. The company was not able to
generate earnings to supply cash for both the investments and to protect capital against
inflation.
If the management were using inflation accounting, instead o f historical method, than
they could adapt themselves in changing environments more quickly.
Analyzing
the
company
figures between
1989
to
1993,
the following
recommendations are made:
□
The company should raise funds by long term borrowings.
□
Some o f the funds obtained should be used to finance the ongoing investment
to shorten the investment period.
□
Rest o f the funds should be added to the working capital.
'file above recommendations will have the following effects:
□
The increase in working capital will increase the inventories for a certain period
o f time. But, by using the additional capacity obtained from the new investment, the company's
market share in domestic market should be increased. Also, there will be enough capacity for
exports.
□
An increase in sales will also increase the accounts receivable, but together with
the inventories, the current position o f the company will be improved.
U
The additional earnings generated and also shorter investment period will
improve both rates o f returns.
In addition to the recommendations that were submitted to the company, I would like
to point another important item; tax regulations. The current depreciation method is not
enough to protect the capital against inflation.
In Turkey, the initiative has to come from the government because o f the strong
linkage between the accounting system and the regulatory framework o f the government.
Application o f revaluation fund was a good initiative, but it is currently become meaningless,
since the rates determined by the government are lower than the actual inflation rates. The
accounting profession and industry too need to strongly express the need for inflation adjusted
accounts.
4.3. Response from the Management
After the first analysis were made (December 1994), the company has increased it's
debt capital both by short and long-term borrowings (May 95).
The managemet has decided to increase the level o f investments, and the second unit
in the new mill has started operating (August 1995). The third unit will start operating before
the end o f the year.'^
The company has almost doubled the domestic sales by changing the pricing policies,
and the remaining capacity is fully utiziled for export purposes.
As a result o f increased production, the company has increased the raw material and
finished products inventory level inorder to meet the necessary demands from the market.
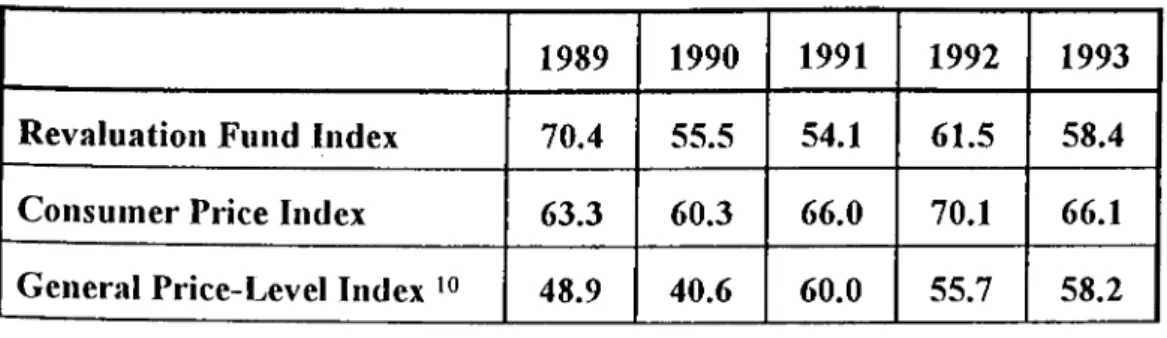
4.4. Comparison witli Revaluation Fund
In section 2.4. the revaluation fund application was explained. Now, the comparison
between the general price-level accounting and revaluation fund will be made to find out the
differences between these alternative approaches. First, the price indices than, accounting
figures will be compared.
TABLE 13: PRICE INDICES (%)
1989
1990
1991
1992
1993
Revaluation Fund Index
70.4
55.5
54.1
61.5
58.4
Consumer Price Index
63.3
60.3
66.0
70.1
66.1
General Price-Level Index
48.9
40.6
60.0
55.7
58.2
^ The new mill consists of three units of equal capacity. The first unit has started operating at the end of 1994.
The price index used in this study, which is the wholesale price index in private food manufacturing
industry.
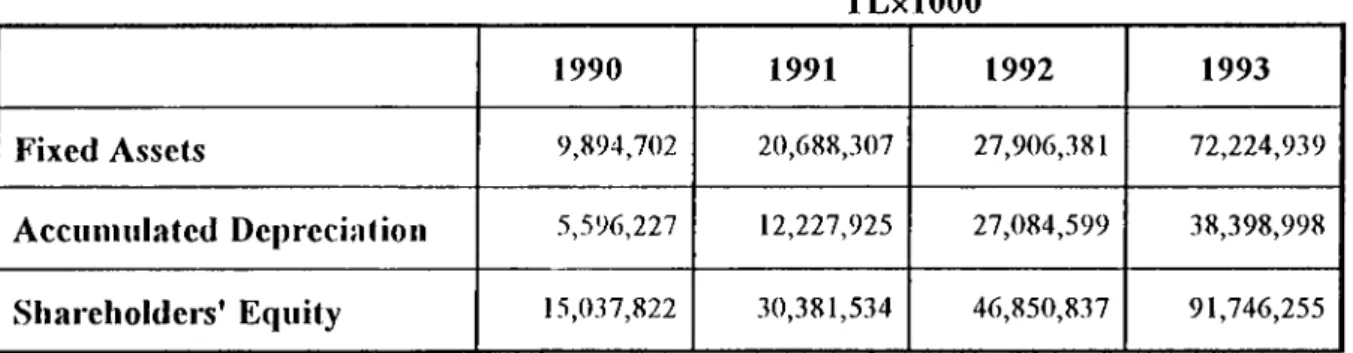
TABLE 14: HISTORICAL COST BASED ACCOUNTING FIGURES INCLUDING THE
REVALUATION FUND.
TLxlOOO
1990
1991
1992
1993
Fixed Assets
9,894,702
20,688,307
27,906,381
72,224,939
Acciiimilated Depreciation
5,596,227
12,227,925
27,084,599
38,398,998
Shareholders’ Equity
15,037,822
30,381,534
46,850,837
91,746,255
TABLE 15: GENERAL PRICE-LEVEL BASED ACCOUNTING FIGURES
TLxlOOO
1990
1991
1992
1993
Fixed Assets
54,661,846
75,504,855
108,289,562
129,527,666
Accumulated Depreciation
24,680,121
40,761,417
44,970,716
56,987,856
Shareholders' Equity
59,644,887
79,163,656
127,919,600
149,626,322
The figures shown above points out some important end results:
□
Price indices used for revaluation are higher than the index used for this study but, lower
than the consumer price index.
□
Although the price index used for revaluation is higher, because o f differences in
methodology, the fixed assets adjusted under the general price-level model is higher than
that o f revaluation fund.
□
Similar explanation for shareholders' equity can also be made; the equity under general
price-level is higher than that o f revaluation fund.
□
Ratio analysis showed no significant change for profit levels however, depreciation
expense under the general price-level is higher than that o f revaluation fund; providing
better tax shield and therefore better protection o f capital against inflation.
A P P E N D I X A
M O N T H L Y C U M U L A T I V E A C C O U N T IN G
CASH KONYA BUREAU CHEQUES
BANKS CURRENT ACCOUNT CUSTOMERS
VARIOUS DEBTORS INVENTORIES UTTER OF CREDCTS BUARANTEES ANO DEPQSTTS MANUFACTURED 6000S ACCOUNT GENERAL EXPENDITURES ADVANCES
TEMPORARY ACCOUNT
SHAREHOLDERS CURRENT ACCOUNT PACKAGING MATERIAL
SUPPORT FUND ACCOUNT FDQED ASSETS
GUARANTEE AND COLLECTION NOTES VJLT. ACCOUNT
FIXED ASSET VJLT. ACCOUNT PREPAID TAXES
FEED M ia CURRENT ACCOUNT KONYA BUREAU PRODUCTION ACCOU DOUBTFUL RECEIVABLES
PARTiaPAHONS CONNECTED FOUNDATIONS COMING YEARS EXPENDITURES INVESTMENT ACCOUNT SPECIAL COST VALUE
CAPITAL UNDERTAKING ACCOUNT CAPITAL
UGAL RESERVE FUND RENEWAL FUND REVALUATION FUND
DEBTS TO CONNECTED PARTNERSHIP ACCUMULATED DEPRECIATION SAUS ACCOUNT
ISSUQ) BONDS BANK CERDITS ACCOUNT TAX AND INSURANCE DEBTS SELLERS ACCOUNT VARIOUS CREDITORS CENTER CURRENT ACCOUNT VARIOUS INCOMES PROVISIONS PRQFmLOSS ACCOUNT INVESTMENT DEDUCTION PROFITS TO BE DISTRIBUTED FINANaNQ FUND STARTING BALANCE
Jan-89 Jan-89 Fei>.89
DEBIT CREDIT DEBIT
33.729.305 0 105.941416 0 0 •3 0 0 0 217.953.463 0 117.991,401 a576.712.5l1 0 Z355.176.948 326.724.521 (3 343.906.840 359.068.260 o 343.C69.974 299.578.092 3 300.293.500 0 >'' 0 0 0 0 131,033,157 0 321.473.537 0 110,517,947 |T 10.CCC 0 3.C08.334 0 272.261,514 Q 7.327.924 Q 7.C01.423 Z1C3.C68.154 ■J 0 0 2.123.795.505 113.333,334 ,Q 0 333.216,320 0 3 3 0 ROC 1¿ 2 16,981.711 0 13.575.968 48.368.360 0 95,737.720 1.561.153,183 0 1.4 3 3.4 5 1 .7 3 9 0 0 0 0 0 0 551.513.000 0 551.513.CCO 57,74^668 0 400.001385 0 0 0 0 0 0 0 0 0 0 0 0 0 4.060.000.000 0 0 307.575,114 0 0 0 0 0 512.205.024 0 0 0 0 0 1.07Z480218 0 0 2,050,143,766 0 0 0 0 0 2.C00.0C0.000 0 0 13.133.315 0 401.787.039 0 466,907.312 0 356,243.671 r\ 0 0 V-I 0 3,552.333 0 0 0 0 0 2.453,429.718 0 0 0 0 0 0 0 0 0 0 9.321.334,773 0 9,321,334.773 Fel>-«9 CREDIT
Q
0 o 0 0 0 0 1C3.957S47 Q•
í
5
ó
.:
c
3.
i
"4
r\ 4.C6C.000.000 307.575.114 0 o1Z2G5.0240
1.07Z480.213 3.9^.135.5S8 •j 2.000.000.CCO 13.950.155 0274,344,956
0 19.237.423 0 Z453.429.713 0 0 0Mar-89 Mar-89 Apr-89 Apr-89 May-89 May-89 Jun-89 Jun-89
DEBIT CREDIT DEBIT CREDIT DEBIT CREDIT DEBIT CREDIT
115.612.336 0 135,326.391 0 259,341.515 0 128,441271 0 0 0 0 0 C 0 0 0 0 Q 0 0 0 0 0 0 132,959.087 0 337.588.301 0 231,554,008 0 442.255,073 0 3,742.376.113 10 3.X1,563.969 0 3,221522.664 0 4,130.331.555 0 335.930.420 0 254.563,504 :·) 331,562.209 0 333.397,360 0 700.294,764 1.411363,388 0 1305.437,317 0 329.8C6.525 0 313.043.532 0 301,295.429 0 302,012.343 0 302.011-343 0 0 0 0 0 53,000 0 55.000 0 0 0 0 0 G 0 0 594.263.742 0 315,51- C6c 0 M61,6o0,C03 0 1433,-334.214 0 0 35,072.114 ,1 '15,534,165 •0 115.524,398 0 110,249,938 4 415.353 - 753.933.293 0 77-!,329.;33 0 773.983,272 0 0 535.393.114 0 533.398,114 0 2125.798,114 0 1224,373.114 14,291,730 0 0 25,541,573 n 1 3.9 7 5 .5 4 3 0 0 0 0 0 0 0 0 0 1125171.963
pi
2.^27,92^969 ,0 1145.094,525 0 2.207.263,151 0 18.000.COO 0 20.000,COO : 14,COO.COO 0 149,556,082 0 373,569.346 0 ‘31,956,519 0 0 3.C8O.'024 11.436,333 0 15.325.121 0 15,990.121 0 11020.450 0 13,137.411 0 145.106.580 0 0 518.245.17G 0 486,337,373 0 421,2-33,482 ’ 253.377.903 0 n 000 ■'‘^227”’ 0 1337,387,530 ,0 2.023.405.387 0 0 0 c 0 3 0 0 0 0 J 0 0 0 0 055i.513.CCO 0 55i.513.COC 0 551.513.COO 0 551,513,000 0
450,141,315 0 723.509.798 0 595.975,135 0 333117.343 0 1.125.C00 0 1.125.COC 0 1125.000 0 5,985,000 0 0 0 159.517,3-^3 0 290.C67.349 0 536.611,-309 0 0 0 0 0 0 0 0 0 0 0 0 0 0 0 0 0 Q 4.C60.0C0.C00 0 3.230.000,000 3 3.130,000.000 0 4,000,000.000 0 307,575.114 0 307,675.114 0 480.527.388 0 480.527.988 0 0 0 0 0 0 0 0 0 3112C5.024 0 512.205.024 0 311205,•024 0 0 G 0 3 0 0 0 0 0 1·^ 1,071480.218 0 1.071480118 0 1071480,213 0 1,071480.218 0 3.537.3514S8 0 3.193.426.506 0 11738,346,730 0 15.100.421350 0