P JF
/û68
Τ8
ó j¡^ 6
Pt
T"^
COURSE ASSESSMENT TEST AT FOUNDATION LEVEL AT BILKENT UNIVERSITY SCHOOL OF ENGLISH LANGUAGE (BUSEL)
A THESIS PRESENTED BY MÜGE AYŞE GENCER
TO THE INSTITUTE OF ECONOMICS AND SOCIAL SCIENCES IN PARTIAL FULFILLMENT OF THE REQUIREMENTS
FOR THE DEGREE OF MASTER OF ARTS IN TEACHING ENGLISH AS A FOREIGN LANGUAGE
BILKENT UNIVERSITY JULY 1999
INSTITUTE OF ECONOMICS AND SOCIAL SCIENCES MA THESIS EXAMINATION RESULT FORM
July 31,1999
The examining committee appointed by the Institute of Economics and Social Sciences for the thesis examination
of the MA TEFL student Müge Ayşe Gencer
has read the thesis of the student.
The committee has decided that thesis of the student is satisfactory.
Thesis Title: The Relationship between Progress Tests and the End of Course Assessment Test at
Foundation Level Bilkent University School Of English Language
Thesis Advisor: Dr. Necmi Akşit
Bilkent University, MA TEFL Program
Committee Members: Dr. Patricia N. Sullivan Dr. William E. Snyder Michele Rajotte
combined opinion it is fully adequate, in scope and in quality, as a thesis for the degree of Master of Arts.
Dr. Patricia N. Sullivan (Committee Member) Dr. William E. Snyder (Committee Member) ) X y ' > c /i.e ■(i
,/|
iJ k Michele Rajotti (Committee Member)Approved for the
Institute of Economics and Social Sciences
TABLE OF CONTENTS
LIST OF TABLES... vi
LIST OF FIGURES... vii
CHAPTER 1 INTRODUCTION... 1
Background of the Study... 3
Statement of the Problem... 6
Purpose of the Study... 7
Significance of the Study... 7
Research Questions... 8
CHAPTER 2 REVIEW OF THE LITERATURE... 10
Introduction... 10
Approaches to Language Testing... 10
The Purposes of Assessment... 13
Norm-Referenced Measurement and Criterion-Referenced Measurement... 17
Types of Classroom Testing... 19
Formative Tests... 19
Summative Tests... 19
Basic Qualities of Good Language Tests... 20
Reliability... 20 Validity... 22 Content Validity... 23 Costruct Validity... 23 Criterion-Related Validity... 24 CHAPTER 3 METHODOLOGY... 2 6 Introduction... 26 Subjects... 26 Materials... 28 Procedure...2 9 Data Analysis... 32
CHAPTER 4 DATA ANALYSIS... 33
Overview of the Study... 33
Data Analysis Procedures... 34
Results... 36 Research Question 1... 37 Group 1... 37 Group 2... 39 Sub-Question 1... 41 2-Year Students ... 41 Sub-Question 2... 42 4-Year Students ... 42 Research Question 2... 43 Group 1... 44 Group 2... 47
2-Year Students ... 49 Sub-Question 2... 51 4-Year Students ... 51 CHAPTER 5 CONCLUSIONS... 55 Introduction... 55 General Results... 56 Research Question 1... 56 Group 1... 57 Group 2... 57 Sub-Question 1... 58 2-Year Students ... 58 Sub-Question 2... 58 4-Year Students ... 58 General Conclusions... 59 Research Question 2... 60 Group 1... 60 Group 2... 62 Sub-Question 1... 64 2-Year Students ... 64 Sub-Question 2... 65 4-Year Students ... 65 General Conclusions... 66 Discussion... 67 Limitations... 73
Implications for Further Research... 73
REFERENCES... 7 6 APPENDICES... 79
Appendix A: The Correlation between PTs and ECA... 7 9 Appendix B: The Correlation between PTs and ECA(Both Vocabulary and Writing included and not included)... 84
Appendix C: The Measures of Central Tendency and of Dispersion of ECA and PTs (Both Vocabulary and Writing included and not included)... 86
Title :
Author :
The Relationship between Progress Tests and the End of Course
Assessment Test at Foundation Level at Bilkent University School of English Language
Müge Ayşe Gencer
Thesis Chairperson: Dr. William E. Snyder
Bilkent University MA TEFL Program
Committee Members: Dr. Necmi Ak?it
Bilkent University MA TEFL Program Dr. Patricia N. Sullivan
Bilkent University MA TEFL Program Michele Rajotte
Bilkent University MA TEFL Program Testing has always been an important part of every teaching and learning experience. Tests can serve a number of purposes. One of the important ones is that tests can help identify the strengths and weaknesses of learning so that necessary help can be provided to
learners.
The goals of this study were to investigate both the extent to which overall scores on progress tests were indicative of students' performance on the end of course assessment test and the extent to which each section on progress tests were indicative of performance on the end of course assessment test in Group l,who studied 2 weeks at zero beginners and 14 weeks at beginners levels, and
Bilkent University School of English Language (BUSEL). The subjects were 223 beginners level students. 98 of them were in Group 1 and 125 of them were in Group 2. The students in Group 1 consisted of only 4-year students whereas those in' Group 2 included both 2-year and 4-year students. Group 2 was a heterogenous group.
The overall scores and breakdown scores of students in both groups were gathered and analyzed systematically using Pearson Product-Moment Correlation Coefficient.
The study revealed that all the correlations of overall scores on progress tests and on the the end of course assessment test were positive and statistically significant at p<.001 level in both Group 1 and Group 2. Group 1 students' overall scores on progress tests showed the highest correlations with the one on the end of
course assessment test. The correlations ranged from .64 to .82 and they were all statistically significant at
.001 level.
On the other hand, the breakdown of scores showed a variation. All of them had positive correlations and
statistically significant between .001 and .10. In general, it was difficult to predict students'
performance on different sections of the end of course assessment test. The correlation coefficients indicated
Curriculum and testing affect students, teachers
and, in fact, institutions very much. Hills (1976)
stated that the basic principle involved in taking advantage of testing was to improve the organization of instruction. "The curriculum and the tests that are used to ascertain whether students are learning it [sic] must be coordinated for instruction to be most effective" (p. 267).
Since testing is an important part of every
teaching and learning experience, well-made tests of English can be used in a number of ways to help
students, as well as teachers. According to Madsen
(1983) ,
First of all, such [well-made] tests can help create positive attitudes toward class. In the interest of motivation of efficient instruction, teachers almost universally aim at providing positive classroom experiences for their students. There are some important ways that testing can contribute to this. One that applies in nearly every class is a sense
of accomplishment... Tests of appropriate
can also contribute to a positive tone by demonstrating the spirit of fair play and
consistency with course objectives, (p. 4;
A second way of supporting students is that well made tests of English can help students to master the
language. Learning can also be enhanced by students'
growing awareness of the objectives and the areas of
emphasis in the course. In addition, by diagnostic
features, tests can foster learning. Madsen (1983)
pointed out that "they [tests] confirm what each
person has mastered, and they point up those language
items needing further attention. Naturally, a better
awareness of course objectives and personal language needs can help ... [the] students adjust their
personal goals" (p. 4).
Third, teachers can use tests to diagnose their own efforts as well as those of their students
(Carroll & Hall, 1985). As the teachers record the test scores, they might ask themselves several
questions: "Are my lessons on the right level?" "What areas do we need more work on?" and " Which points need reviewing?"
the evaluation process can be improved (Valette,
1977). For example, "Did the test cause anxiety or resentment?" "Did the test results reflect accurately how my students have been performing in class, and in their assigned work?"
In short, students, teachers, and even
administrators can benefit from tests by confirming progress that has been made, and showing how they can best redirect their future efforts (Valette, 1977). Good tests can aid learning.
Background of the Study
Carroll and Hall (1985) stated that tests,
curricula, and programs should fully complement each other since learners see them as instruments of
success or failure. Tests in particular have a
dominating role in the curriculum. They can have not
only a stimulating effect on teaching programs but also a "washback". Hughes (1997) defined "washback" as the impact of testing on learning and teaching. As Bachman (1998) pointed out, "'Good' tests will provide 'good' instructional practice and vice versa"
(p. 11). Therefore, tests are of the utmost
university in Ankara, Turkey. Students registering at Bilkent University must take a proficiency test called Certificate of Proficiency in English (COPE)
which has two stages. The first stage serves as a
placement test for students who are placed in four lower levels: foundation 0 (FOU 0), foundation 1
(FOU 1), foundation 2 (FOU 2), and intermediate
(INT). FOU-0 is real beginners, FOU-1 is false
beginners and FOU-2 is pre-intermediate levels. The second stage of the placement test separates the ones who are successful on the test, and directly go to their departments from those who enter Bilkent University School of English Language (BUSEL) to
study at the upper-intermediate (UP), and pre-faculty (PF) levels.
At the beginning of 1998-1999 academic year 348 students started FOU-1 level. These students studied 8 weeks in FOU-1 taking 3 progress tests and another
8 weeks in FOU 2 taking 3 more progress tests. These
progress tests serve as formative tests/achievement tests. If students fulfil the course requirements, that is to say, 90 % attendance. Learning Portfolios handed in as required, and at least 60 % success rate covering the 6 progress tests and teacher assessment.
The end of course assessment functions as a summative test/final achievement test.
At foundation level, in BUSEL, students are required to obtain a grade of 60% to progress to the
intermediate level. Although some students move on
to the next level, some repeat the same course.
During this process, "'How am I getting on?' is the question the student[s] ask. [They want] to know how
much progress [they are] making in mastering [their]
course" (Carroll & Hall, 1985, p. 108). What has been taught and learned is measured by progress tests indicating how far students have approached their target (Hughes, 1997; Valette, 1977).
In BUSEL, at foundation level, six progress tests, prepared by the Testing Unit, are given to
students. The question types, and topics on these
progress tests and the end of course assessment are generally in line with the course books, and the
course objectives. However, sometimes, the students
who perform well on the progress tests do not show the same or similar performance on the end of course assessment test or vice versa. The teachers and
administrators as well as the students, value the students' performance on these achievement tests
success, but also of the effectiveness of the organisation as a whole.
Statement of the Problem
Bilkent University School of English Language is an institution which gives tuition to both 2-year and
4-year students. 2-year students are vocational school
students, whereas 4-year students are faculty students. They enter this university having performed very
differently on the University Entrance Exam, extremely low and extremely high, respectively. Then, in BUSEL these students are placed according to their scores on the placement test administered by BUSEL. In foundation level, there are 3 progress tests administered
periodically in an 8-week course. The purpose of these
tests is to give feedback to students on their
progress, to make slight adjustments in the instruction and to provide support to those who need it. BUSEL is interested in understanding the degree to which the performance on the progress tests can predict students' performance on the end of course assessment test so that administrators can take action to help students
reach the required standards for advancement. However,
The purpose of the study is to find out the relationship between students' overall scores on progress tests and on the end of course assessment test, and the relationship between scores of each section on progress tests and on the end of course assessment test which student take at 2+14 week and 16-week foundation courses at BUSEL in 1998-1999 academic year. From this point onward, 2+14 week foundation course will be called Group 1 and 16-week foundation course will be named Group 2. In Group 1, students study 2 weeks at real beginners(fou-0), 6 weeks at beginners(fou-1) and 8 weeks at
pre-intermediate(fou-2) levels. In Group 2, students
study 8 weeks at beginners and another 8 weeks at pre-intermediate levels.
Significance of the Study
A wide range of individuals, such as teachers, administrators, the Head and members of the Curriculum and Testing Unit at BUSEL, future MA TEFL participants, and testers in other universities, can benefit from
this research. First, teachers, administrators, and
testers at BUSEL will have a chance to see/review how faculty and vocational school students at BUSEL perform
this study some changes, in question type(s), wording, or topic(s), might be made in the progress tests and the end of course assessment test or the same tests
could be re-used. Second, since such a research study
on testing at BUSEL has not been conducted before, it can bring a different perspective to the Curriculum and
Testing Unit. Third, future MA TEFL participants can
use it as a basis for their studies, either by
continuing the same study from a different angle or applying it to different levels in BUSEL or at other universities. Finally, although testers in other
universities do not have access to tests prepared and given by BUSEL, they may use this research study to structure their assessment system so that they can redesign and/or develop their own tests.
Research Question(s)
In the study, the research questions will be as follows:
1. To what extent are the overall scores of six
progress tests indicative of students' performance on the end of course assessment test in Group 1 and in Group 2 at BUSEL?
Sub-questions
a. To what extent are the overall scores of six progress tests indicative of 2-year students'
Group 2 at BUSEL?
b. To what extent are the overall scores of six progress tests indicative of 4-year students'
performance on the end of course assessment test in Group 2 at BUSEL?
2. To what extent are the scores of each section on six progress tests indicative of students' performance on the end of course assessment test in Group 1 and in Group 2 at BUSEL?
Sub-questions:
a. To what extent are the scores of each section on six progress tests indicative of 2-year students'
performance on the end of course assessment test in Group 2?
b. To what extent are the scores of each section on six progress tests indicative of 4-year students' performance on the end of course assessment test in Group 2?
CHAPTER 2 REVIEW OF THE LITERATURE Introduction
In the past, a great number of tests have encouraged a tendency to separate testing from teaching. Both testing and teaching are so closely interrelated that it is actually impossible to work in either field without being constantly concerned with the other (Heaton, 1988, p. 5) .
This chapter reviews the related literature on
testing in the following order: (a) approaches to
language testing, (b) purposes of assessment, (c) norm- referenced measurement and criterion-referenced
measurement, (d) types of classroom testing, (e) basic qualities of good language tests.
Approaches to Language Testing
Language tests can be roughly classified in the following order: (1) the structuralist approach, (2) the integrative approach, and (3) the communicative approach
(Heaton, 1988). They should not be considered as limited
to certain periods in the development of language
testing. A useful test will generally include features
of several of these approaches. These approaches can be defined as follows:
The structuralist approach is guided by the view that language learning is mainly concerned with the
systematic acquisition of a set of habits. The learner's mastery of the separate elements of the target language,
phonology, vocabulary, and grammar, is tested using
words and sentences completely apart from any context on the grounds that a larger sample of language forms can be covered in the test in a comparatively short time. The skills of speaking, listening, reading, and writing are also separated from one another as much as possible because it is considered essential to test one thing at a time (Heaton, 1988).
The integrative approach involves the testing of language in context and is therefore concerned mainly with meaning and the total communicative effect of
discourse. Integrative tests are often designed to
assess the learner's ability to use two or more skills simultaneously (Heaton, 1988).
The communicative approach to language testing is
sometimes linked to the integrative approach. Although
both approaches emphasize the importance of the meaning of utterances rather than their form and structure,
there are, nevertheless, fundamental differences between
the two approaches. Communicative tests are primarily
concerned with how language is used in communication. They aim to incorporate tasks as close as possible to
which is concerned with how people actually use the
language for a multitude of different purposes, is
emphasized (Heaton, 1988).
At BUSEL, progress tests and the end of course
assessment test are given to foundation level students at
certain time intervals. These tests consist of reading,
listening, grammar, vocabulary and writing. In general,
the progress tests and the end of course assessment test at foundation level seem to be a combination of the
integrative approach and the communicative approach as much as possible.
Bachman and Palmer (1996) claim.
We should be able to bring about improvement in instructional practice through the use of tests which incorporate with the principles of effective teaching and learning (p. 34 ).
This is what is intended through the use of the progress tests and the end of course assessment test at BUSEL.
In brief, the tests aim at covering a representative sample of syllabus objectives, having more reliable
grading across and between courses and providing a
positive effect on learning and teaching through washback and feedback.
The cumulative nature of progress tests enables
recycling in both teaching and learning. These tests
contain a mixture of language, lexis, and sub-skills, rather than focusing on one skill.
Heaton (1988) believes:
Language testing constantly involves making compromises between what is ideal and what is practicable in a certain situation.
Nevertheless this should not be used as an excuse for writing and administering poor
tests: whatever the constraints of the
situation, it is important to maintain
ideals and goals, constantly trying to devise a test which is valid and reliable as much as possible - and which has a useful backwash effect on the teaching and learning leading
to the test (p. 24).
The Purposes of Assessment
"While trying to establish the worth of anything,
hence to evaluate it, we need information and we need
yardsticks against which to judge not only the
information we require, but the information we receive.
In education, where we are concerned with the worth of such things as curricula, teaching methods, and course materials, one significant source of information.
although not the only one, is the performance of those being taught - the students" (Harlen, 1978, p. 12).
Although many writers (Brown, 1996; Gronlund, 1985; Harlen, 1978; Heaton, 1988; Macintosch & Hale, 1976; Ooosterhof, 1994; Valette, 1977) define purposes
differently, there is common thread of agreement in all of them.
Tests can serve several purposes. They may be
constructed as devices to reinforce learning and to motivate the student or as a means of assessing the
student's performance in the language. In the former
case, as stated by Heaton (1988)," the tests are guided by the teaching that has taken place,...[whereas in the
latter] case, the teaching is guided largely by the
tests" (p. 5). In fact, testing is believed to be useful to increase student success (Bloom et al., 1971; Ebel, 1980; Natriello & Dornbush, 1984). Therefore, it can be used in the classroom evaluation to observe the extent to which learning outcomes are achieved (Gronlund, 1985). Namely, it is a systematic process to determine the degree of students' achievement during the instruction. It is very important to many facets of the school
programs. It can directly contribute both to the
and to a number of school uses (Carroll & Hall, 1985; Gronlund, 1985).
It is possible to classify and describe evaluation in many different ways with respect to the purpose.
Testing and evaluation not only take an important role in the classroom instruction but also contribute to
curriculum development.
Evaluation procedures can be categorized and
explained in several forms. Gronlund (1985) presents the categories in terms of the evaluation of students
performance in the following order:
1. determine ...[students] performance at the beginning of the instruction (placement evaluation)
2. monitor learning process during instruction (formative evaluation)
3. diagnose learning difficulties during instruction (diagnostic evaluation) 4. evaluate achievement at the end of
instruction (summative evaluation) (p. 11).
Formative evaluation can be used to provide feedback to both students and teachers. Furthermore, it supports
necessary support is provided both to the students and the teachers.
At BUSEL, progress tests serve the same purpose. One of the aims is to provide concrete and specific
feedback to students. For example, instead of saying
"You are poor at reading", teacher says "You are poor at reading main ideas". In other words, the tests give
chance to see progress on not only each skill but also sub-skill.
Summative evaluation comes at the end of a course, "...it [summative evaluation] is designed to determine the extent to which the instructional objectives have been achieved" (Gronlund, 1985, p. 12). This type of
evaluation provides information for judging the appropriateness of the course objectives and the effectiveness of the course (Oosterhof, 1994).
Like summative evaluation, the end of course assessment test at BUSEL is designed for the same
purpose. It tests what has been taught throughout the
whole course using the course objectives.
Language teachers are in the business of fostering achievement in the form of language learning. The purpose of most language programs is to maximize the
possibilities for students to achieve a high degree of language learning (Brown, 1996). Teachers can find
themselves making achievement decisions sooner or later. " Achievement decisions are decisions about the amount of learning that students have done. Such decisions may
involve who will be advanced to the next level of study or which students should graduate "(Brown, 1996, p. 14).
All these purposes should be considered similar. Norm-Referenced Measurement and Criterion-Referenced
Measurement
Within a language program, tests can function in
various ways. There are mainly two categories. The
first one is norm-referenced (NR) and the other one is
criterion-referenced (CR). The former category helps administrators and teachers to make program-level
decisions and the latter category helps teachers to make
classroom-level decisions (Brown, 1996). Program-level
decisions are proficiency and placement decisions whereas classroom-level decisions are diagnostic and achievement decisions.
There is a tendency to assume that comparisons must
be made between individuals. This is known as norm-
referencing.
Spolsky (1988) points out that the norm-referenced
test is a discriminating test which aims to discover how
spreads out students as widely as possible in terms of their ability.
Unlike the norm-referenced test, a criterion-
referenced test is usually used to measure well-defined
and fairly specific objectives, which are related to a
particular course, or program (Hills, 1976), The purpose
of the CRT is to measure the amount of learning that a
student has achieved on each objective. Students know in
advance what types of questions, tasks, and content to expect for each objective (Brown, 1996).
Criterion-referenced assessment uses predetermined levels of performance, assessment being made in relation to objectives. This has the obvious advantage that the criteria can be pitched at any level, the primary concern being to ensure that as many students as possible reach the requisite level. Typically, it is used for guidance and diagnosis. Spolsky (1988) adds that a criterion- referenced test is a mastery test, designed to establish how many students have achieved a certain standard, or whether an individual student has performed a given a task. For example, formative and summative tests are criterion-referenced tests. They assess to what extent students have achieved course objectives during or at the end of the course.
Types of Classroom Testing
Criterion-referenced tests can be used for a variety
of instructional purposes. The most important ones in
this research study are formative testing and summative testing.
Formative tests
Formative tests are given periodically during the instruction to monitor students' learning progress and to provide continuous feedback to students and teachers.
They reveal learning weaknesses in need of correction and
encourage successful learning. They cover units,
chapters, particular set of skills, tasks covered or
practised during instruction. These tests are typically
criterion-referenced tests (Finocchiaro & Sako, 1983). At BUSEL, progress tests serve for the same
purposes.
Summative Tests
They are given at the end of a course. The results
can be used for evaluating the effectiveness of the
instruction. They include test items with a wide range of difficulty. They include test items with a wide range of difficulty (Finocchiaro & Sako, 1983).
The end of course assessment test at BUSEL is administered for similar purposes.
Basic Qualities of Good Language Tests A test, like any other type of instrument used to measure, should give the same results every time it
measures, and should measure exactly what it is supposed to measure. In language testing, these terms are defined as reliability and validity. Reliability and validity are vital measurement qualities (Bachman and Palmer, 1996). Reliability
In examining the meaningfulness of test scores, we are concerned with demonstrating that they are not unduly affected by factors other than the ability being tested"
(Bachman, 1990, p. 25). If errors in measurement affect
test scores, the scores will not be meaningful, and
cannot supply the basis for valid interpretation and use
(Bachman, 1990). Unfortunately, all examinations are
subject to inaccuracies. While some measurement error is
inevitable, it is possible to quantify and minimise the presence of measurement error (Henning, 1987).
Reliability is one of the important points in
measurement. It is a quality of test scores, and a
perfectly reliable score, or measure, would be one free from errors of measurement (American Psychological
Association, 1985). This sort of accuracy is reflected
in obtaining similar results when measurement is repeated with different instruments, by different students, and on
different occasions (Harris, 1969; Henning, 1987; Hughes, 1997). As Henning (1987) says "reliability is a measure of accuracy, consistency, dependability or fairness of scores resulting from administration of a particular examination"(P- 73), which is needed in all exams.
Deale (1975) defines reliability as consistency, meaning how far the test would give the same results if it could be done again by the same students under the same conditions. He points out that it is, of course, a theoretical definition since such conditions would be almost impossible to impose, and, therefore, a perfectly reliable test would be equally impossible to produce. "The factor variability, even if it is inevitable, needs to be reduced to an acceptable minimum, and to do this it is necessary to identify the principal sources of
variability; these would seem to be:
• variations in performance of the student
talcing the test. These may stem from
extraneous influences such as physical or mental or nervous conditions and anxiety and
stress related to talcing the test. Not much
can be done to prevent these factors, but
the teacher can take them into account when interpreting the results.
measure a small sample of a [student's] ability and a different sample could give a different result.
• variations in the marking. Except for
objective tests, the marker's judgement can be·as variable as the [student's]
performance... Variations can occur for a
variety of reasons: for example, the
marker's standards being affected after marking a set of either very good or very bad scripts; or the teacher subconsciously being influenced by knowledge of the
[student] whose work is being marked" (Heaton, 1988, p. 89).
Validity
Reliability is an important quality which should be monitored in tests; however, it is not itself sufficient for claiming that a test doing a good job. In fact, reliability is a pre-condition for validity, but not sufficient for purposes of judging overall test quality
(Madsen, 1983). Validity must also be examined.
Brown (1996) defines validity "as the degree to which a test measures what it claims, or purports, to be measuring"(p. 231). To make sound decisions in
educational institutions, the development and use of valid tests are vital.
There are three main categories that exist for investigating the validity of a test: content validity, construct validity and criterion-related validity.
Content Validity
Testers should decide whether the test is a
representative sample of the content of whatever the test is designed to measure in order to investigate the
content validity. To have good content validity, a test must reflect both the content of the course and the balance in the teaching which led up to it.
Brown (1996) warns that " ...Once [testers] have established that a test has adequate content validity, they must immediately explore other kinds of validity arguments (construct or criterion-related) so that they can assess the validity of the test in terms related to the specific performances of the types of students for whom the test was designed in the first place" (p. 239).
Construct Validity
Hughes (1997) points out that " a test, part of a test, or a testing technique is said to have construct validity if it can be demonstrated that it measures just the ability which it is supposed to measure" (p. 26). The word 'construct' refers to any underlying ability
which is hypothesized in a theory of language ability. The tester conducts an experiment to investigate the degree to which the test is measuring the construct for which it was designed.
Criterion-related Validity
"Criterion-related validity is sometimes called concurrent or predictive validity. These terms are just
variations... Concurrent validity is criterion-related
validity but indicates that both measures were administered at about the same time... Predictive validity...[indicates] that two sets of numbers are
collected at different times... In fact, the purpose of the test should logically be 'predictive' " (Brown, 1996,
p. 248). Henning (1987) defines predictive validity as
"... an indication of how well a test predicts intended performance" (p. 196). Besides, "...[It] indicates how well performance on a test correlates with performance on
[another]" (Oosterhof, 1994, p. 60).
The usual procedure to compute predictive validity is to correlate statistically the two sets of scores and to report the degree of relationship between them by means of a correlation coefficient.
Anastasi (1961), Brown (1996; 1998), Cronbach
(1964), and Davies (1984) emphasize that both content and construct validity and concurrent or predictive validity
are needed in the process of test validation. Combining validities strengthens overall validity.
To sum up, as Bachman (1996) states "...
[reliability and validity] are the qualities that
provide the major justification for using test scores ... as a basis for making inferences or decisions" ( p. 19) .
CHAPTER 3 METHODOLOGY Introduction
The aim of this study is, in general, to
investigate the relationship between six progress tests and the end of course assessment given to foundation
(beginners) level students at Bilkent University School of English Language (BUSEL) in 1998-1999 academic year. More specifically, this study aimed at finding out both the extent to which the overall scores on progress tests were indicative of students' performance on the end of course assessment test in Group 1 and Group 2 at
foundation levels at Bilkent University School of English Language, and the extent to which scores on sections on progress tests were indicative of performance on the same sections on the end of course assessment test as far as Group 1 and Group 2, and 2-year students and 4-year students in these courses are concerned.
Subjects
This study was carried out at Bilkent University School of English Language (BUSEL) in Ankara, Turkey. Bilkent University is an English-medium university; therefore, the students in its various departments have to have a good command of English in order to be
successful in their studies. At the beginning of each
an English proficiency exam, prepared by the Curriculum and Testing Unit at BUSEL. Those who are successful in this exam become freshman students in their departments. The students who fail the exam are given a placement test to be classified into various levels: foundation 0
(FOU-0), foundation 1 (FOU-1), foundation 2 (FOU-2), intermediate (INT), upper-intermediate (UP) and pre faculty (PF). In the fou-0 level are real beginners, in the fou-1 level false beginners, and in fou-2 level pre intermediate students study.
The subjects in this study were chosen from false beginners (FOU-1) level. This group was divided into two groups as Group 1 and Group 2. The ones in the first group studied 2 weeks at real beginners (fou-0), 6 weeks
at false beginners(fou-1) and 8 weeks at pre-intermediate
(fou-2) levels. As mentioned before, the students in Group 1 were placed at this level according to their
scores on the placement test. On the placement test since they did not score as well as the students in Group 2 did, they studied at real beginners level for 2 weeks. Then, they continued their study at fou-1 and fou-2 levels. This group consisted of only 4-year students, i.e., faculty students.
The second group studied 8 weeks at false beginners and 8 weeks at pre-intermediate levels. They performed
better than group 1 on the placement test; therefore, they did not study at real beginners level.
The test scores of 348 students were gathered. Then, the students who were repeating the course or did not sit at least one exam for reasons such as health, or late registration were excluded from the study as suggested by Brown (1996). The total number of the subjects was 223.
98 of them were in the first group. All the students in this study were 4-year students. There were 125
subjects in the second group. Seventy-one of them were 2-year students, that is to say, vocational school students. 4-year vocational school students were also included in this group. Fifty-four of them were 4-year students, in other words, faculty students.
Materials
In this study, initially, overall scores of six progress tests and of one the end of course assessment test were used. Next, breakdown scores of these progress tests and of the end of course assessment test were
collected.
Both of Group 1 and Group 2 took 6 progress tests throughout the course. The progress tests started in the fourth week of the instruction and continued every other week except progress test 4. This progress test was
was given in the sixteenth week. This was followed by the end of course assessment test in the seventeenth week. The end of course assessment test functions as a final achievement test.
The progress tests and the end of course assessment test contained a mixture of language, lexis and sub
skills rather than focusing on one skill. During each 8- week course, three progress tests were given in the 4*^^, 6*^^ and 8*^^ weeks. The last block or the last two blocks on Monday afternoon was/were the exam time. Teachers and students were informed of the task types in the progress test the Wednesday before the exam to reduce the anxiety for the students but also to avoid constant practice of only one task type in the classroom. However, on the end of course assessment test, they were not informed since they were responsible for everything they had studied and since it was a summative test. The end of course
assessment test was double scored to get reliable
information whereas progress tests were marked only by class teachers.
Procedures
In this study, overall scores and breakdown scores of 223 students on seven tests were gathered. The
breakdown scores of these progress tests were entered onto the computer to be analyzed using Pearson
Product-Moment Correlation. The collection of data was finished on May 29,1999. To estimate this relationship between progress test overall scores and the end of course assessment test overall scores, first, the
researcher put students in two groups. Group 1 and Group 2. Then she divided these groups as 2-year students and 4-year students (see Fig. 1).
Group 1 2 weeks fou-0 6 weeks fou-1 8 weeks fou-2 98 students 4-year (98 students) 4-year
Group 2 8 weeks fou-1 125 students (54 students)
8 weeks fou-2 2-year
(71 students) Fig.l: How the subjects were put into groups
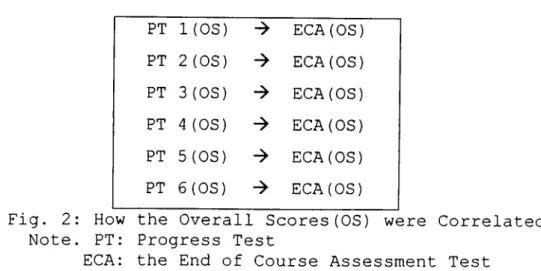
In the next stage, she computed the correlation between the overall scores on each of the six progress tests and the scores on the end of course assessment on the basis of Group 1 and Group 2, and 4-year and 2-year students (see Fig. 2).
PT I(OS) EGA(OS) PT 2 (OS) ECA(OS) PT 3 (OS) -> EGA(OS) PT 4 (OS) EGA(OS) PT 5 (OS) EGA(OS) PT 6 (OS) EGA(OS)
Fig. 2: How the Overall Scores(OS) were Correlated Note. PT: Progress Test
EGA: the End of Course Assessment Test The next step was the computation of breakdown scores of progress tests and of the end of course
assessment test in Group 1, Group 2,and 4-year and 2-year students in these groups (see Figure 3).
PT 1(read) EGA(read) (listen) -> EGA(listen) (gram) EGA(gram) PT 2 (read) -> EGA(read) (listen) -> ECA(listen) (gram) EGA(gram) PT 3(read) EGA(read) (listen) EGA(listen) (gram) EGA(gram) (write) EGA(write) PT 4 (read) EGA(read) (listen) EGA(listen) (gram) EGA(gram) PT 5 (read) EGA(read) (listen) EGA(listen) (gram) EGA(gram)
PT 6 (read) EGA (read)
(listen) ECA(listen)
(gram) -> EGA(gram)
(write) EGA(write)
Fig. 3: How the Breakdown of Scores were Correlated Note. PT: progress test
EGA: the end of course assessment test
read: reading listen: listening
Data Analysis
After taking permission from BUSEL, the data were gathered. The 223 students' scores on six progress tests and one end of course assessment were analyzed to find the mean, the standard deviation and the correlation
coefficient in terms of the type of course and the length of the study in departments. The Pearson Product-Moment Correlation was used to calculate the correlation
coefficient.
After performing the necessary statistical
techniques, the researcher used tables and figures to illustrate what she had discovered.
CHAPTER 4 DATA ANALYSIS
A foolish man always thinks only of the results, and is impatient, without the effort that is necessary to get good results. No good can be attained without proper effort, just as there can be no third story (on a house) without the foundation and the first and second stories.
(The teaching of the Buddha)
Overview of the Study
The purpose of this study was to find out both the extent to which the overall scores of progress tests were indicative of foundation level students' performance on the end of course assessment test at Bilkent University School of English Language; and the extent to which the overall scores of each section on each progress test were indicative of similar performance on the end of course assessment test with respect to Group 1 and Group 2, and 2-year students and 4-year students in Group 2.
The researcher obtained the six progress test
scores and an end of course assessment test scores of 223 students. Then, she correlated the overall scores of
progress tests and the end of course assessment test for each group. Following this, she computed the correlation of each section on progress tests and the end of course assessment test for different groups in the study.
Data Analysis Procedures
This study investigated the degree of relationship between progress tests and the end of course assessment test, and the degree of relationship between each section on progress tests and on the end of course assessment test on the basis of Group 1 and Group 2.
This process was divided into several stages. In the first stage of data analysis, the researcher correlated progress test scores and the end of course assessment test scores using the Pearson Product Moment Correlation to see the degree of association between the progress tests and the end of course assessment test.
In the next stage of the analysis, again using the Pearson Product Moment Correlation Coefficient, each section on each progress test was correlated with each section on the end of course assessment test. To
illustrate, reading section on each progress test was correlated with reading section on the end of course assessment test. Vocabulary was the only section which was not correlated since there was no vocabulary section on the end of course assessment test. Writing was
correlated only twice as it was tested only on the third and sixth progress tests. In addition, the central
tendency and dispersion of each progress test and the end of course assessment test were computed to understand the anomalies that occurred in the correlation of these
tests. ■
In the next stage, because of the fact that
vocabulary was tested on five progress tests, but not on the end of course assessment test and writing was tested only on two progress tests, the researcher excluded
vocabulary and writing sections on five progress tests and the end of course assessment test. Progress test 5 was the only test that tested neither vocabulary nor writing, but reading, listening and grammar.
In the end, there were only three sections on
progress tests and on the end of course assessment test, which were reading, listening and grammar. The researcher correlated the overall scores on the progress test and on the end of course assessment test to see whether
vocabulary and/or writing were the sources of differing correlations between progress tests and the end of course assessment test, using Pearson Product Moment Correlation Coefficient. The results of this calculation were
Results
This section is divided into two main headings: correlation between overall scores on progress tests and the end of course assessment test (research question 1), and correlation between each section on progress tests and the end of course assessment test(research question 2). Under each section, sub-questions are also analyzed.
In the interpretation stage, the results of
correlations are presented in an order of general results and specific results.
The correlation coefficients are interpreted with respect to the strength of the relationship, the
direction of the relationship and the statistical significance of the correlation. As correlation
coefficients range between -1.00 and +1.00, the strength and direction of the correlation are interpreted using the following values in Figure 4, suggested by
Fitz~Gibbon and Morris (1987).
+ .99
+ 1.00 + .80
perfect positive correlation very strong positive correlation
+ .79 + .60 strong positive correlation
+ .59 + .40 moderate positive correlation
+ .39 + .20 weak correlation
+ .19 -.20 no correlation
-.21 -.40 weak negative correlation
-.41 -.60 moderate negative correlation
-.61 -.80 strong negative correlation
-.81 -.99 very strong negative correlation
-1.00 perfect negative correlation
Fig. 4: The Range of Possible Correlations and their usual Interpretations
Research Question 1 ; Correlation between Overall Scores on Progress Tests and on the End of Course Assessment Test
The degree of relationship between overall scores of progress tests and the end of course assessment test
which was given, to Group 1 and Group 2 at foundation level is interpreted in terms of the strength, the direction and the statistical significance of the correlation.
Group 1. This group is composed of 98 students, all
of whom are 4-year students. Namely, they are faculty students. They studied 2 weeks at fou-0 and 14 weeks at fou-1 and fou-2.
Table 1
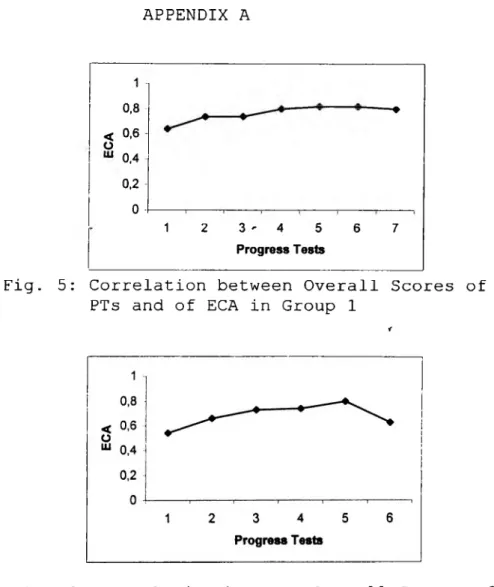
Correlation between Overall Scores of Progress Tests(PTs) and of the End of Course Assessment Test (EGA) in Group 1
n=98 EGA (week 17) PT 1 (week 1) PT 2 (week 2) PT 3 (week 3) PT 4 (week 12) PT 5 (week 14) PT 6 (week 16) .64 ** .74 * .80 * .82 * .82 * .80 *
Note. n = number of students
* p< .001
To start with, the correlation between progress test 1 and the end of course assessment test is at .64.
(see Table 1). This correlation is higher than expected for the first progress test because it is the first the
students sit for a progress test at BUSEL and it is just the beginning of the course. The correlation rises over
the next four progress tests. It remains stable on
progress test 5, but there is a slight decrease on progress test 6 (see Appendix A, Fig. 5).
The correlation between each progress test and the
end of course assessment test is .64. This suggests that
there is a strong positive relationship between progress test 1 and the end of course assessment test. This
relationship is statistically significant at the .001
level. On progress test 2, the correlation coefficient is .74, which indicates a strong positive relationship
between progress test 2 and the end of course assessment test, r is statistically significant at p< .001. r = .80 and r = .82 values imply that the correlation between progress tests 3, 4, 5 and the end of course assessment test is strongly positive. Regarding the degree of
association, the closer to 1.00 in either direction, the greater the strength of correlation (Brown, 1996). The
relationships are significant at the .001 level.
During the analysis process, the researcher notices that r decreases when progress test 6 is concerned.
Thinking that vocabulary and writing might be the source of low correlation because of the fact that they are either tested very rarely or not tested on the end of
course assessment test, the researcher excludes
vocabulary and writing from progress tests and the end of course assessment test. After this, overall scores on progress tests and on the end of course assessment test
are correlated. However, it is found out that all the
correlations between progress tests and the end of course assessment test further decrease apart from progress test 2. There is a slight increase in the correlation between overall score on progress test 2 and the end of course assessment test when writing on the end of course
assessment test is not included (see Appendix C ) .
Group 2. There are 125 students in this group. On
the placement test administered at the beginning of the academic year, these students scored better than the
students in Group 1. Therefore, they did not study at
fou-0 level as real beginners. 71 of these students are 2-year students and the rest are 4-year students.
Table 2
Correlation between Overall Scores of PTs and of EGA in Group 2 n= 125 EGA (week 17) PT 1 (week 4) .54 * PT 2 (week 6) . 66 ★ PT 3 (week 8) .73 * PT 4 (week 12) .74 * PT 5 (week 14) .80 ★ PT 6 (week 16) .63 *·
Note, n = number of students * p< .001
The correlation coefficient between progress tests and the end of course assessment test starts at .54 and
increases steadily until it reaches progress test 5 (see Appendix A, Fig. 6). On progress test 6, however, the correlation coefficient drops slightly as observed in Group 1. As Table 2 indicates, the highest correlation, r = .80, is between progress test 5 and the end of course
assessment test. The lowest correlation is between
progress test 1 and the end of course assessment test again.
There is a moderate positive correlation between progress test 1 and the end of course assessment test, with a value of .54 (see Table 2). It is also
statistically significant at .001 level. The correlation
coefficients between progress test 2, progress test 3,progress test 4 and the end of course assessment test
range from .66 to .74, which means a strong positive
correlation. These values have statistical significance
at the .001 level. Namely, there is only .001%
probability that these correlation coefficients occurred by chance. On the other hand, r = .80 suggests that there is a very strong positive and statistically significant relationship between overall scores on progress test 5 and the end of course assessment test. However, this correlation decreases to .63 as far as progress test 6 is
concerned. There is again a moderate positive and
statistically significant correlation, but this value is not as high as the one between progress test 5 and the end of course assessment test.
When vocabulary and writing are not included in the overall scores on progress tests and the end of course assessment test, the correlation coefficients show a fall in values (see Appendix C).
Sub-question 1. Correlation between Overall Scores of PTs and EGA in 2-Year Students in Group 2
As Group 2 is a heterogeneous group, it is divided into two according to the departments the students will study in. These two groups are the 2-year student and
4-year student groups. Table 3
Correlation between Overall Scores of 2-Year and 4-Year Students in Group 2 on PTs and on EGA
EGA (week 17) EGA (week 17)
(2-year Students ) n=71 (4-year Students) n=54 PT 1 (week 4) .52 * .59* PT 2 (week 6) .63 * .71* PT 3 (week 8) .70 * .76* PT 4 (week 12) .65 * .83* PT 5 (week 14) .73 * . 84* PT 6 (week 16) .55 * .69*
Note. n = number of students
* P < .001
In the 2-■year student group. as illustrated in
end of course assessment test starts at a moderate
positive value and it goes up steadily. However, when it comes to progress test 6, there is a sudden decline (see Appendix A, Fig. 7).
The correlation between progress test 1, 6 and the end of course assessment test is moderately positive. The overall scores on progress test 2, 3, 4 and 5 have strong positive correlations with the overall scores on the end of course assessment test. All the values are also statistically significant at p < .001.
As mentioned in other groups, when vocabulary and writing are excluded from progress tests and the end of course assessment test, it is observed that r does not increase, which can be interpreted as vocabulary and writing are not the source of low correlations between progress tests and the end of course assessment test (see Appendix C ) .
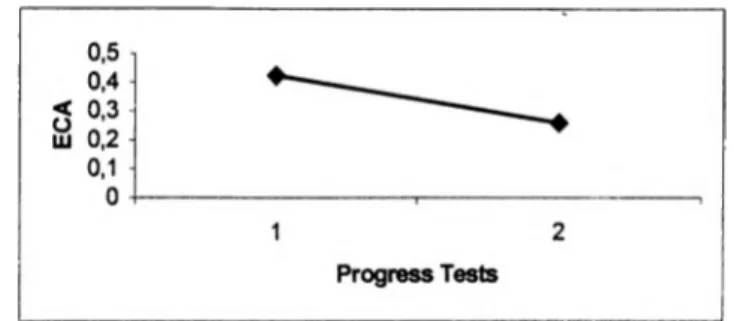
Sub-question 2: Correlation between Overall Scores of Progress Tests and on the End of Course Assessment Test in 4-Year Students Group in Group 2
4-year Students
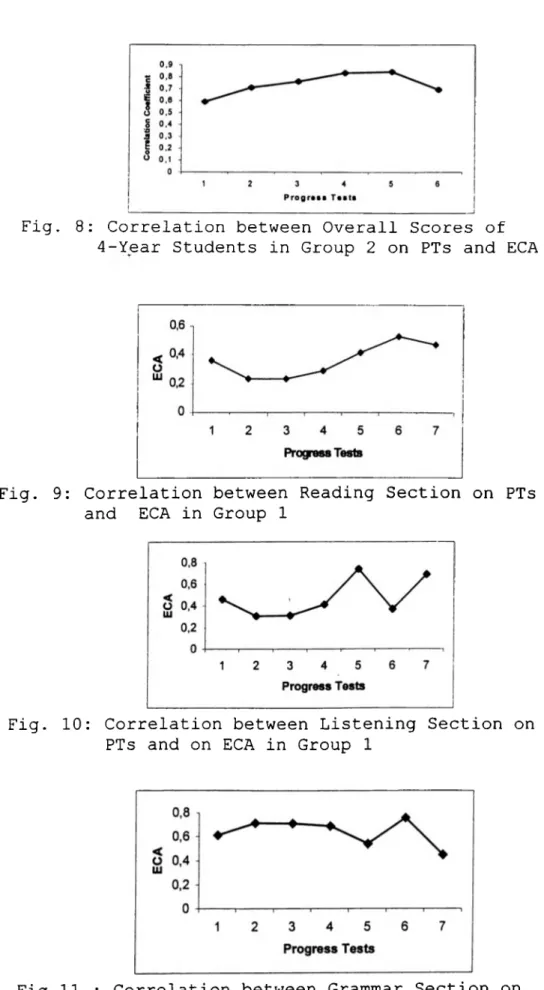
As Table 3 demonstrates, in 4-year student group, there is a gradual increase in the correlation
coefficient except progress test 6. As far as the relationship between progress test 6 and the end of
course assessment test is concerned, there is a slight drop (see Appendix A Fig. 8).
Although r = .59 is a moderate positive correlation, it is also very close to r = .60, which would be a strong positive correlation. The relationship between progress test 1 and the end of course assessment test is
moderately positive. Progress test 2, 3 and 6 have strong positive correlations with the end of course assessment test. Progress test 4 and progress test 5 have very strong positive relationships with the end of course assessment test. All the correlations are statistically significant at .001 level.
It is also found that when vocabulary and writing are not included in progress tests and the end of course assessment test, the correlation coefficient of the
overall scores drops just as in the other groups (see Appendix C ) .
Research Question 2; Correlation between Each Section of Progress Tests and the End of Course Assessment Test
In this section, each section on progress tests is correlated with the one on the end of course assessment test. That is to say, the reading section is correlated with reading section or listening section is correlated with listening section. Sections are categorised into 4 groups depending on the sections on the end of course
assessment test as reading, listening, grammar and writing. Vocabulary is not included since it is not
tested on the end of course assessment test. As described at the beginning of this chapter and shown in Table 4, 5 and 6, the breakdown scores of each progress test and of the end of course assessment test are correlated both for Group 1 and Group 2.
Group 1 Table 4
Correlation between Each Section of PTs the and EGA in Group 1
n=98 READING LISTENING GRAMMAR WRITING
EGA EGA EGA EGA
PT 1 .36** .46* . 61* PT 2 .23*** . 31** .71* PT 3 . 30** .41* . 69* .49* PT 4 . 42* 74* . 54* PT 5 .53* .37* .76*
1
PT 6 .47* .69* .45* .55*Note. n = number of students
* p< .001 ** p< .01 *** p< .05
In the reading section, the correlation coefficient fluctuates. It sometimes increases sometimes decreases.
Just like the correlation between overall scores on progress tests and on the end of course assessment test, r falls on progress test 6 (see Appendix Fig. 9).Progress testl, 2 and 3 have weak positive correlation with the end of course assessment test whereas progress test 4, 5, and 6 have moderate positive correlation. The
statistical significance of these values vary from p< .001 to p< .05.
In the listening section, r starts at a .46 value. Just like the one in the reading section, it fluctuates. There is a sudden rise and decline. For example, r rises from .41 to .74 then declines to .37 followed by a rise to .69. In short, there is not a consistent increase or
decrease as illustrated in Appendix A Fig.10. progress
test 2 and 5 have weak positive and significant
relationships with the end of course assessment test while progress test 1 and 3 have moderate positive correlations. Finally, r=.74 and r=.69 suggest that progress test 4and 6 have strong positive relationships with the end of course assessment test. They are
statistically significant at .001 level.
Although correlation coefficient in grammar section fluctuates, it is relatively more consistent than reading and listening sections (see Appendix A Fig. 11). It
progress test 4 and 6 have moderate positive
correlation, the rest have strong positive correlation. All of them are statistically significant at .001 level. Grammar is the only section where X is high when compared to other sections (see Appendix C ) . What is more striking is that although X of progress test 6 is the highest and SD is the lowest among all progress tests, the lowest correlation is between progress test 6 and the end of course assessment test in grammar section.
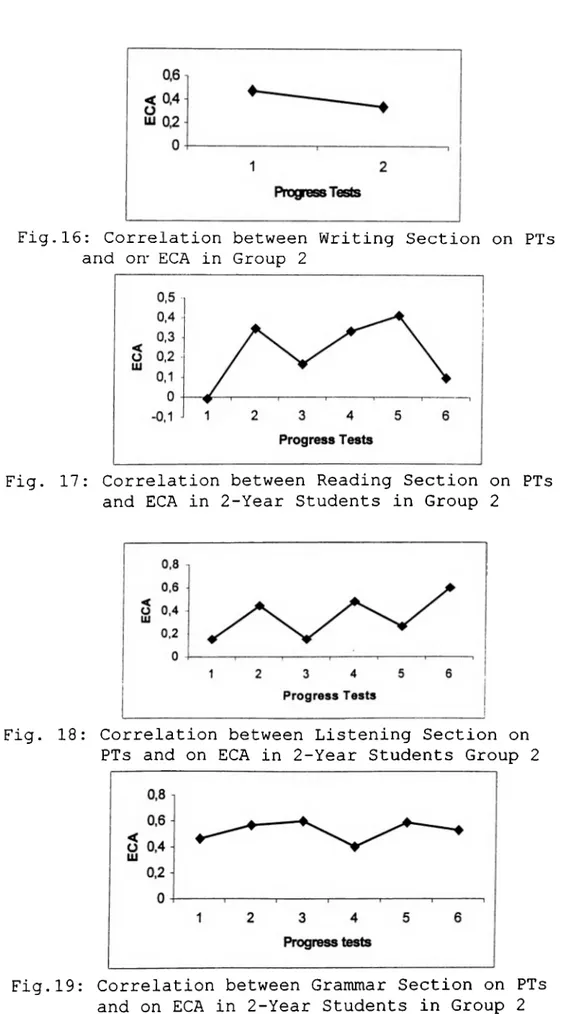
As far as the writing section is concerned, it is really difficult to make any estimations since writing is tested only twice on progress tests and using different criteria on each of them (see Appendix A Fig.12). In
addition, there is a long interval between progress test 3, which is administered in week 6, and the end of course assessment test, which is administered in week 17. When looked at separately, it seems that there is a moderate positive correlation between writing section on progress tests and the end of course assessment test. Both r
values are statistically significant.
To sum up, sections on progress tests do not show very strong positive correlations with the end of course assessment test. Therefore, it is difficult to make
estimations about students' performance on different sections on the end of course assessment test.
Group 2 Table 5
Correlation between Each Section of PTs and on EGA in Group 1
n=125 READING LISTENING GRAMMAR WRITING
EGA EGA EGA EGA
PT 1 ]_ 7 Tk-★ * ■*■■*■ g ★ -A-* .51* PT 2 . 44* . 39* . 62* PT 3 .23*** .58* . 47* PT 4 .36* .53* .52* PT 5 . 44* .27** . 68* PT 6 . 13 .57* . 55* .34*
Note. n = number of students
★ p< .001 *** p< .02 ***** p< .10
★ -k p< .01 **** p< .05
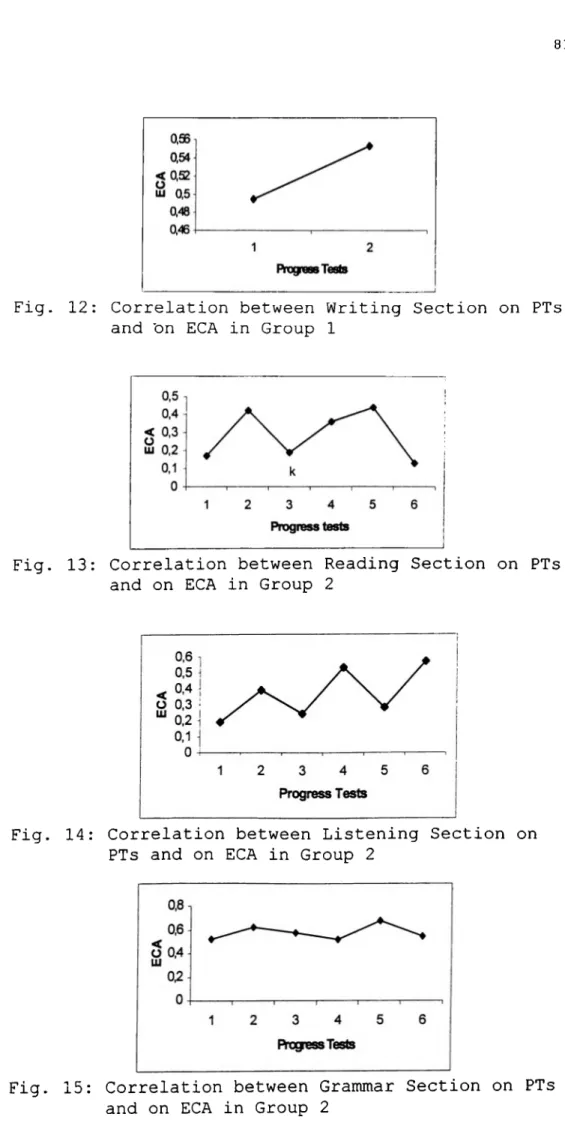
In the reading section, the correlation1 coefficient
starts at .17 and then it fluctuates . There are steep
rises and declines as illustrated in Appendix A Fig.13. It is observed that there is no correlation between progress test 1, 3, 6 and the end of course assessment test. It is supposed that progress test 6 is the one
which is the most similar to the end of course assessment test in terms of content and is the 'closest one in time
since progress test 6 is administered in week 16 and the end of course assessment test is administered in week 17. On the contrary, as far as reading section is concerned, the correlation coefficient between progress test 6 and the end of course assessment test is the lowest one among the others. All-r values are statistically significant except progress test 6.
The correlation coefficient goes from .19 to .57 in the listening section. However, there is not a sustained rise but abrupt plunges (see Appendix A Fig.14). The statistical significance of r varies between .05 and .001
The r in grammar section values higher than the ones in the other sections. There is fluctuation among
correlation coefficients but it is not as steep as the ones in the reading and listening sections (see Appendix A Fig. 15). Progress test 1, 3, 4, and 6 have moderate positive relationships with the end of course assessment test. Progress test 2 and 5 have strong positive
correlation with the end of course assessment test. All of the correlation coefficients have significance at .001 level. It seems that it is easier to estimate Group 2 students' performance on grammar section on the end of course assessment test than other sections.
The correlation coefficient in the writing section
then this goes down .34, which means weak positive relationship with the end of course assessment test.
These values are statistically significant at .001
level. In fact, it is almost impossible to say anything about students' probable performance on writing on the end of course assessment test (see Appendix A Fig. 16).
Sub-question 1: Correlation between Each Section on PTs and EGA in 2-Year Students Group in Group 2
2-Year Students Group in Group 2 Table 6
Correlation between Each Section on PTs and EGA in 2-Year Students in Group 2
n=71 READING LISTENING GRAMMAR WRITING
( 2-year
students) EGA EGA EGA EGA
PT 1 .00 . 15 .46* PT 2 .35** . 44* .57* PT 3 .17 . 15 . 60* .42* PT 4 .33** .48* .59* PT 5 .41* . 26**** .59* PT 6 .10 . 60* .53* 2 ^ ★
Note, n = number of students
* p< .001 **** p< .05