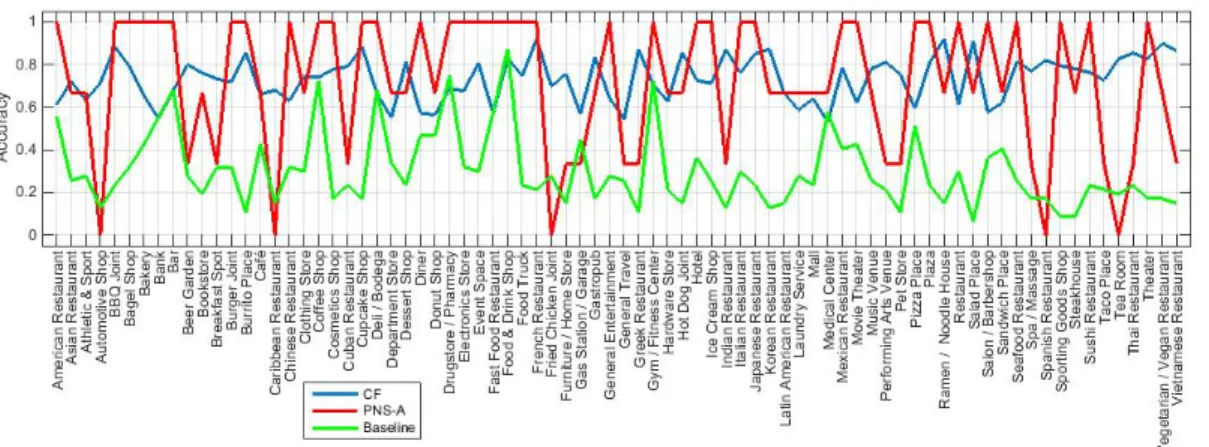
Location recommendations for new businesses using check-in data
Tam metin
Şekil


Benzer Belgeler
By this device we are constantly reminded of: 1) the extent of the changes that had taken place in the West; and 2) the destiny of their eventual absorption into Ottoman life.
The B-band shifts slightly towards higher energies with increasing excitation density, which is a characteristic for donor-acceptor pair recombination.. From the
共Received 2 September 2010; accepted 8 January 2011; published online 2 February 2011兲 Strong directional selectivity is theoretically predicted and experimentally validated at
This study assesses the genetic distribution and the diversity of wild einkorn throughout Turkey, using total of 59 accessions from 22 locations in four different
The generalization of the Hermite-Biehler Theorem due to Levin ([2, ch. 4]) shows that the above problem is equivalent to the following, also non-asymptotic, one: for which values of
The aim of the location-based movie advisor application for Android devices is to give a brief summary about movies, movie times and also nearest location information of the
Sözen, başlangıçta, iki Sovyet sanatçının karşısına, Okan Kültür, Eğitim ve Spor Vakfı’nın sanat danışmam olarak çıkmış.. Sergiye alınacak yapıtların
Beton Ankara 2016 Fuarı etkinlikleri çerçevesinde 18 Şubat 2016 tarihinde Türkiye Hazır Beton Birliği tarafından Beton- da Kalite Denetiminin Önemi Semineri gerçekleştirildi..
