MODELLING AND OPTIMIZATION OF
TURKISH ARMY FUEL SUPPLY SYSTEM
VIA SIMULATION
A THESIS
SUBMITTED TO THE DEPARTMENT OF INDUSTRIAL
ENGINEERING AND THE INSTITUTE OF ENGINEERING AND
SCIENCE OF BILKENT UNIVERSITY
IN PARTIAL FULFILMENT OF THE REQUIREMENTS
FOR THE DEGREE OF
MASTER OF SCIENCE
By
Ahmet HATİP
June, 2001
I certify that I have read this thesis and in my opinion it is fully adequate, in scope and in quality, as a thesis for the degree of Master of Science.
--- Assoc. Prof. İhsan Sabuncuoğlu (Principal Advisor)
I certify that I have read this thesis and in my opinion it is fully adequate, in scope and in quality, as a thesis for the degree of Master of Science.
--- Asst. Prof. Emre Berk
I certify that I have read this thesis and in my opinion it is fully adequate, in scope and in quality, as a thesis for the degree of Master of Science.
--- Asst. Prof. Murat Fadıloğlu
Approved for the Institute of Engineering and Science
--- Prof Mehmet Baray
ABSTRACT
MODELLING AND OPTIMIZATION OF
TURKISH ARMY FUEL SUPPLY SYSTEM
VIA SIMULATION
Ahmet HATİP
M.S. in Industrial Engineering
Advisor: Assoc.Prof. İhsan SABUNCUOĞLU
The movement of the troops, which is so critical to tactical success, depends on the provision of large quantities of fuel. This thesis employs the simulation tool as an effective vehicle for defining the path from competitive concepts to real world solutions, models Turkish Army Fuel Supply System and brings up ways of optimization. During peace, the utilization of all the pipelines between the tanks and the utilization of the tanks are measured, minimum number of tanks and their sizes needed to meet the demands of troops are specified, the thought of making the system available for civilian use is analyzed and some suggestions are made. In war conditions, the endurance of the existing system for different demand sizes are measured and new system configurations are investigated. The trigger levels of the tanks are optimized in each of these new scenarios so that the system can supply fuel longer for the troops.
ÖZET
SİMULASYON KULLANARAK TÜRK SİLAHLI
KUVVETLERİ AKAYAKIT TEDARİK
SİSTEMİNİN MODELLENMESİ VE
OPTİMİZASYONU
Ahmet HATİP
Endüstri Mühendisliği Bölümü Yüksek Lisans
Danışman: Doç. İhsan SABUNCUOĞLU
Taktiksel başarı için büyük öneme haiz olan birliklerin harekat sahasındaki intikal ve faaliyetleri, büyük miktarlarda akaryakıt ikmalini gerektirmektedir. Bu tez çalışması simulasyonu etkili bir araç şeklinde kullanarak Türk Silahlı Kuvvetleri akaryakıt tedarik sisteminin modellenmesi ve optimizasyonunu amaçlamaktadır. Barış şartlarında, yerleşim yerlerinde bulunan akaryakıt depolarının kullanım oranları, iki yerleşim arasındaki mevcut akaryakıt boru hattının kullanım oranı, yerleşim yerlerinde bulunması gereken en az sayıdaki akaryakıt depoları ve bunların büyüklükleri tesbit edilmiş, boru hattı sisteminin sivil kullanıma açılması yönündeki çalışmalara yönelik analizler yapılmıştır. Savaş şartlarında, boru hattı sisteminin birliklerin değişik akaryakıt taleplerini karşılayabilme seviyesi araştırılmıştır. Sistemin işlerliğini arttırabilmek ve muharebe şartlarında artan bu talepleri karşılayabilmek maksadıyla akaryakıt depolarının tetikleme seviyeleri optimize edilmiştir.
Anahtar Sözcükler: Simulasyon, Optimizasyon, Boru Hattı, Akaryakıt, Silahlı Kuvvetler
ACKNOWLEDGEMENTS
I would like to express my deep gratitude to Dr. İhsan Sabuncuoğlu for his guidance, attention, understanding, and patience throughout all this work
I am indebted to the readers Emre Berk and Murat Fadıloğlu for their effort, kindness and time.
I cannot fully express my gratitude and thanks to my parents and friends for their care, support and encouragement.
CONTENTS
List of Figures………...IX
List of Tables………...X
Glossary………... XII
1. INTRODUCTION………...1
1.1 The Army Logistics……… 1
1.2. Objectives and Scope of the Thesis……….. 9
2. LITERATURE SURVEY...11
2. Literature survey………...………. ... 11
3. SIMULATION OF THE MILITARY FUEL SUPPLY SYSTEM...16
3.1. Formulation of Problem and Plan Study ... 16
3.2. System Description... 16
3.2.1. Shipment of Fuel to the Main Locations... 16
3.2.2. Transportation of Fuel through the Pipeline System... 17
3.2.2.1. In Peace Conditions... 25
3.2.2.2. In War Conditions (In Defense Operation Analysis)... 26
3.3. Why not Analytical Solution... 27
3.4. Why Simulation? ... 28
3.5. Model Development... 28
3.5.1. Conceptual Model... 29
3.5.1.1. Events... 29
3.5.1.2. Entities and Attributes... 29
3.5.1.3. Exogenous Variables... 30
3.5.1.4. Endogenous Variables... 30
3.5.1.5. Initial Conditions and Operational Rules... 30
3.5.1.6. Assumptions of the Model... 31
3.5.2. Logical Model... 31
3.5.3. Simulation Model (code). ... 31
3.6. Verification and Validation of the Model. ... 37
3.6.1. Verification of the Existing Model... 37
3.6.2. Validation of the Existing System... 38
3.6.2.1. Face Validity... 38
3.6.2.2. Data Validation... 38
4. THE EXPERIMENTATION AND OUTPUT DATA ANALYSIS... 46
4.1. Determination of Warm-up Period... 46
4.2. Determination of Run Length... 49
4.3. Output Analysis of the Existing System... 49
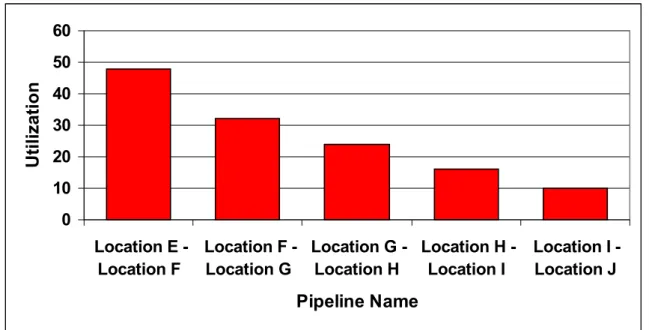
4.3.1. Pipeline Utilizations... 49
4.3.2. Ship Utilizations... 54
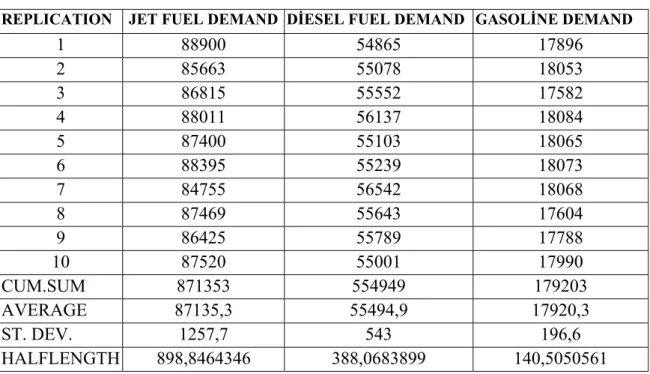
4.3.3. Demands.... ... 55
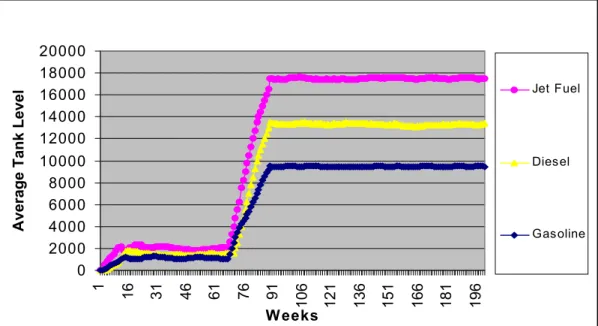
4.3.4. Average Tank Level... 58
4.3.5. Minimum Tank Sizes... 60
4.4. Conclusion……….. 65
5. OUTPUT ANALYSIS OF THE EXISTING SYSTEM IN WAR CONDITIONS 5.1. Introduction... 67
5.2 Objective...………... 68
5.3. Scenario 1; 10 Percent Trigger Level for All Tanks... 70
5.4. Scenario 2; Optimum Trigger Level for All Tanks... 72
5.5. Optimization of the Existing System with using Genetic Algorithm... 74
5.5.1. Genetic-Algorithm based Optimization Algorithm... 75
5.6. Scenario 3; Different Trigger Levels for Different Fuel Types... 79
5.7. Scenario 4; Different Trigger Levels for All Tanks... 83
5.8. Proposed New System... 90
5.9. Comparison of the Scenarios... 95
5.10. Availability of the Scenarios for Different Demands... 96
5.11. Sensitivity Analysis... 98
5.11.1. Increasing Ship Numbers... 98
5.11.2. Changing the Batch Size... 101
5.11.3. Changing the Pump Breakdown Rates... 103
6. CONCLUSION... 105
Bibliography... 113
Appendix... 116
A... 116
A.1. Data Requirements... 116
A.1.1. Pump Machines Breakdown Rates and Duration Data,... 116
A.2. Events... 117
B... 127
B.1. Number of Tanks and Their Sizes... 127
B.1.1. Current Number of Tanks and Their Sizes... 127
B.1.2. Minimum Required Number of Tanks and Their Sizes... 128
B.2. Batch Sizes... 130
C... 132
C.1. Additional Warm-up Graphs. ... 132
C.2. Summary Statistics of the Existing System... 135
List Of Figures
Figure 1.1. Fuel supply protocol... 6
Figure 3.1. The East Pipeline System ... 19
Figure 3.2. Examples related to the trigger levels and fuel types to be Transported………... 23
Figure 3.3. Structure of development ... 29
Figure 3.4. General fuel supply system of Turkish army. ………... 32
Figure 3.5. Shipment of fuel from the refinery to main tanks and behavior of main tanks... 33
Figure 3.6. Transportation of fuel through a multi-purpose pipeline... 34
Figure 4.1. Warm-up graph for the tanks in Location F... 48
Figure 4.2. Graphical representation of some pipeline utilizations... 52
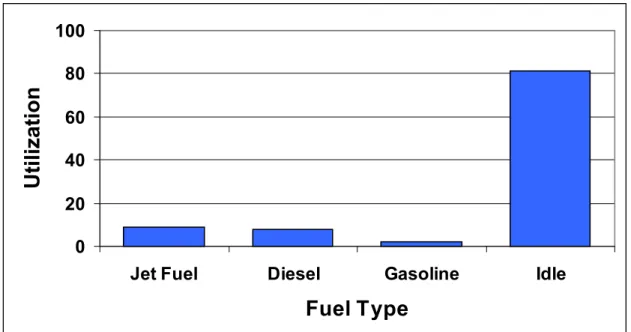
Figure 4.3. Total Utilization of pipelines per fuel type... 53
Figure 5.1. Effect of different trigger levels on duration... 74
Figure 5.2. Uniform Crossover mechanism………. 77
Figure 5.3. Progress graph for different trigger levels for different fuel types... 80
Figure 5.4. Progress graph for different trigger levels for all tanks... 85
Figure 5.5. Progress graph for the proposed new system... 92
Figure 5.6. Comparison of the scenarios in terms of duration... 96
Figure 5.7. Availability of different demands to the system... 97
Figure 5.8. Effect of additional assigned ships... 98
Figure 5.9. Effect of different batch size for different scenarios... 102
Figure 5.10 Effect of different breakdown rates... 104
Figure 6.1. Comparison of scenarios in terms of duration……… 108
Figure 6.2. Availability of different demand sizes……… 109
Figure 6.3. Comparison of the existing system with the proposed system for Ships………. 110
Figure 6.4. Introduction of new trigger levels 111 Figure C.1. Warm-up graph for Location J ... 132
Figure C.2. Warm-up graph for Location I... 132
Figure C.3. Warm-up graph for Location H... 133
Figure C.4. Warm-up graph for Location G... 133
Figure C.5. Warm-up graph for Location K... 134
Figure C.6. Warm-up graph for Location M... 134
List of Tables
Table 3.1. Ships assigned to transport fuel to the main locations... 17
Table 3.2. The capacities of the tanks for each type of fuel... 20
Table 3.3. The diameters and the capacities of the pipelines... 20
Table 3.4. Current pumping capacities of the pipelines... 24
Table 3.5.1. Throughput of the existing system for demands... 40
Table 3.5.2. Historical data about the actual system for demands... 40
Table 3.5.3. Comparison for all types of fuel demands... 41
Table 3.6.1. Pump breakdowns... 42
Table 3.6.2. Pump breakdowns... 43
Table 3.6.3. Pump breakdowns... 43
Table 3.6.4. Historical data related to pump breakdowns... 43
Table 3.6.5. Historical data related to pump breakdowns... 44
Table 3.6.6. Historical data related to pump breakdowns... 44
Table 3.6.7. Welch approach for pump breakdowns... 44
Table 3.6.8. Welch approach for pump breakdowns... 45
Table 3.6.9. Welch approach for pump breakdowns... 45
Table 4.1. Total quantities discharged from pipelines... 50
Table 4.2. Total utilization of the system... 53
Table 4.3. Ship utilizations... 54
Table 4.4. Only A-type ship utilizations……….. 55
Table 4.5. Demands for each location... 56
Table 4.6. Total demands for each type of fuel... 58
Table 4.7. Average tank utilizations... 59
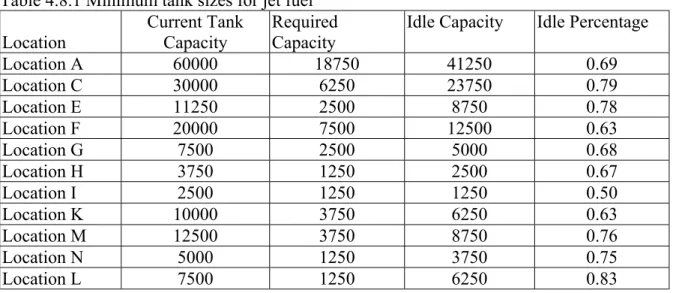
Table 4.8.1. Minimum tank sizes for jet fuel... 62
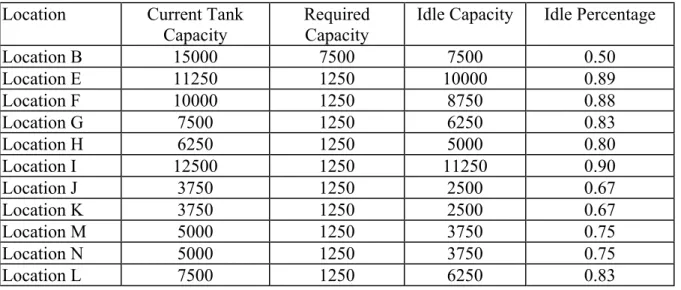
Table 4.8.2. Minimum tank sizes for diesel fuel... 62
Table 4.8.3. Minimum tank sizes for gasoline... 63
Table 4.9. Minimum tank sizes for each type of fuel... 64
Table 4.10. Number of tanks needed and idle... 64
Table 5.1. Duration of fuel types for 10% trigger levels... 70
Table 5.2. The durations for each fuel types... 72
Table 5.3. List of factors... 79
Table 5.4. New trigger levels for the 2nd scenario... 81
Table 5.5. List of factors for different trigger levels for all tanks... 84
Table 5.6. New trigger levels for all tanks... 86
Table 5.7. New duration for fuel types... 87
Table 5.8. Tank locations and number of times they failed first for every type... ... 88
Table 5.9. New assignments of gasoline tanks to jet fuel and diesel fuel.... 91
Table 5.10. Durations for each fuel type... 93
Table 5.11. Optimum trigger levels for proposed system... 94
Table 5.12. Paired-t approach for the 1st scenario... 99
Table 5.13. Paired-t approach for the 2nd scenario... 100
Table 5.14. Paired-t approach for the 3rd scenario... 100
Table 5.15. Paired-t approach for the 4th scenario... 100
Table 5.16. Paired-t approach for the 5th scenario... 101
Table 6.1. Total quantities discharged……….. 106
Table 6.2. Number of tanks needed and idle……….. 107
Table A.1. The breakdown rates and the duration related to these Breakdowns... ... 116
Table B.1. Current jet fuel tanks and their sizes... 127
Table B.2. Current diesel fuel tanks and their sizes... 127
Table B.3. Current gasoline tanks and their sizes... 128
Table B.4. Current and required jet fuel tanks and their sizes... 128
Table B.5. Current and required diesel fuel tanks and their sizes... 129
Table B.6. Current and required gasoline tanks and their sizes... 129
Table B.7. Current total tanks and required total tanks and their sizes... 129
Table B.8. Batch sizes for different pipelines... 131
Table C.1. Confidence intervals for demands... 135
Table C.2. Confidence intervals for breakdowns... 139
Table C.3. Confidence intervals for leaks... 141
Table C.4. Confidence intervals for average tank levels... 141
Table C.5. Confidence intervals for total quantity discharged... 145
Table C.6. Outputs of the A-type ship assigned to transport jet fuel to Location A... 151
Table C.7. Outputs of the B-type ship assigned to transport jet fuel to Location A... 151
Table C.8. Outputs of the A-type ship assigned to transport diesel fuel to Location B... 152
Table C.9. Outputs of the B-type ship assigned to transport diesel fuel to Location B... 152
Table C.10. Outputs of the B-type ship assigned to transport gasoline to Location B... 152
GLOSSARY
BREAKDOWN: Malfunctioning of the pump machines.
DESTINATION LOCATION: Location where fuel types are stored in tanks and the
transportation comes from source location by means of a pipeline. Location H is a destination location for Location G, but a source location for Location I.
END LOCATION: The end of the pipeline system where fuel cannot be transported
any further by means of a pipeline. Location L and Location N are end locations for all fuel types, Location J is end location for diesel fuel and gasoline and Location I is the end location for jet fuel.
FUEL: Liquid that troops demand for their vehicles, generators, etc. Jet fuel, diesel
fuel and gasoline are the types that the system transports.
LOCATION: Cities where either one type of fuel or more than one type of fuel are
stored in various number of tanks. There are 14 locations in the system. These are: Location A, Location B, Location C, Location D, Location E, Location F, Location G, Location H, Location I, Location J, Location K, Location L, Location M, Location N,
MAIN LOCATION: Beginning of the pipeline system where fuel is firstly
transported from the refinery. Location A is the main location for jet fuel, Location B is the main location for both diesel fuel and gasoline.
PIPELINE: A system through which something, especially liquid, is conducted as a
means of supply.
PUMP MACHINE: Machines that used to start or activate the transportation of fuel
RE-ORDER PERCENTAGE: The full percentage of fuel in a tank. The fuel level in
a tank when decreased under re-order percentage demands a new batch of fuel from the previous location. 95% is the re-order percentage for every fuel type in each location.
SHIPMENT: Transportation of fuel from refinery (Location Z) to main locations by
ships.
SOURCE LOCATION: Location where fuel types are stored in tanks and transported
to destination location by means of a pipeline
TANK: Cylindrical shaped large containers where fuel is stored either to meet the
demands of troops or transport fuel to the next location.
TRIGGER LEVEL: The full percentage of fuel in a tank. The fuel level in a tank
when decreased to trigger level suspends the transfer a new batch of fuel to the next location. 10% is the believed trigger level for every fuel type in each location.
1
CHAPTER 1
INTRODUCTION
In this chapter, we present brief information about the army logistics and the problem undertaken in this thesis.
1.1. The Army Logistics
Logistics is the ability of creating, providing and increasing the military capability. It has the essential capabilities, functions, activities and tasks necessary to sustain all elements of operating forces in theater at all levels of war and peace conditions. Successful Army operations depend on continuity of support. As a matter of fact, a number of support functions require peak activity during lulls in combat operations to prepare the force for the next battle or engagement. Planning for support continuity involves providing for multiple sources and means of support. At the strategic level, it may mean setting priorities and arranging for more than one source of supply (Field Manuel 63-1,1992).
Although the logistics system is based on expectation of support needs, no planner can accurately predict the course of all future operations. At the national level, we live in a dynamic global society that places shifting demands on our military. At the operational and tactical levels, operations often evolve in unexpected directions as commanders constantly seek to exploit fleeting opportunities (Field Manuel 63-1,1992).
2
The primary role of the Turkish Army Logistics is to support Army forces in the field in war and peace conditions. The logistics effort is successful only if it concentrates and supports forces as required to meet the commander's intent. Its focus is the mobilization, deployment, sustainment, reconstitution, redeployment, and demobilization of military forces. The logistics system must provide those resources in such a way that it minimizes constraints on the commander. Logistic activities are performed at all levels of war and peace (Kara Kuvvetleri Talimnamesi 54-1, 1994).
Turkish army logistics is responsible for the acquisition and distribution of five classes of supply materials (Kara Kuvvetleri Talimnamesi 54-1, 1994). These are:
Class I :
These are the materials consumed almost always the same amount every day by the troops. Food and food preparation materials, bread, bread-like components, vegetables, fruits, water, animal foods, health and comfort packages such as disposable razors, toothbrushes, toothpaste, and other personal care items are essential Class I components. Troops carry a 6-days ready to use supply materials and use them when no chance of supply can be conducted.
Class II :
Class II supplies include a wide variety of supplies and equipment from clothing and individual equipment to tools. Maps, chemical defense equipments, helmets, mechanics' tools, vehicles and their spare parts are also classified as class II
3
supplies. In most cases, class II consumption is predictable. Demand history, together with anticipated fluctuations, can provide accurate forecasting of needs. Troops carry a very limited stockage of class II items since such items are bulky and impede mobility.
Class III :
Today's Army consumes large quantities of petroleum products in support of operations. Its ability to move and fight depends on its supply of fuel. All types of motorin, benzin jet fuel, lubricants, greases, hydraulic fluids, antifreeze materials, firewoods, coal and specialty items are considered as class III supply materials.
Class IV :
Class IV items consist of special purpose materials and assigned to the troops whenever there occurs a need to execute a special duty. The supplier unit takes these materials back after the execution of the duty has been accomplished. For example, if a troop is desired to perform an operation in a very cold terrain which is apart from its original location, all the equipment given to that troop for that specific purpose are called class IV supply materials.
Class V :
Class V includes all ammunition items from small arms ammunition, grenades, mines, rockets, missiles, and tank artillery cartridges to all components for separate
4
loading artillery rounds, chemical rounds, nuclear, biological and chemical weapons, pyrotechnic/specialty items such as explosive bolts, ejection cartridges, fire machines, and demolition charges.
Supply of Fuel for the Troops:
Fueling the force is demanding and requires a surge capability especially during combat operations. The mobility, which is so critical to tactical success, depends on the provision of large quantities of fuel. However, the routine requirements for fueling are significant throughout all Army operations, not just combat. All operations depend on movement of large numbers of personnel, equipment, and supplies. The activities performed by the troops would only succeed if logisticians were able to accurately forecast and effectively provide the fuel to meet these needs when required.
Military Supply and NATO Facilities Administration Center (MSNF) is responsible for the fuel supply of the Turkish Armed Forces (TSK). The military fuel supply network system, which is maintained and managed by MSNF, has the following parts: Sea transportation, pipeline transportation and highway transportation. Sea transportation is used to transport the processed fuel to the main locations of the pipeline system by sea tankers. Pipeline transportation is extensively used to deliver this incoming fuel from main locations to further locations throughout the country and highway transportation is used to transport the fuel from the tanks in all these locations to the various troops using POAS (Petrol Ofisi Anonim Şirketi) transportation tankers.
5
In the Turkish Army, fuel supply system is conducted in four consecutive phases.
1. Fuel Supply Protocol:
Army units, in peace conditions, prepare and send the “Fuel Demand Forms” to the Forces Commands in December of every year showing the average fuel demand quantities for all the vehicles, generators and other instruments run by the fuel engines during training, service and drills for a year. The Land Forces Command (K.K.K), Air Forces Command (Hv.K.K) and Navy (Dz.K.K) then translate the annual demands into monthly requirements and a monthly fuel distribution sheet is prepared for each unit showing the amount of fuel and type of the fuel the troop needs in a month. The Forces Commands then send these monthly demands to the Ministry of National Defence, where the date the troop will receive this fuel and the location, which will supply the fuel would be decided on by the “Fuel Supply Protocol” carried out by National Defense Ministry and POAS, which is signed for a yearly basis. All the data (amount of fuel needed, the date the troop may obtain the fuel, type of the fuel troop needs) is submitted in the “Fuel Supply Protocol “ for a year. Then the refinery in Location Z begins to produce the needed amount of fuels for the transportation. The fuel supply protocol is summarized in Figure 1.1
Although the troops have demanded the average fuel quantities, they do not have to take all they demand and they can get only what they need in that period. Except for the regular fuel demand, the troops may need extra fuel for unplanned actions and drills and this extra need is also met by the location, which is responsible to deliver the regular demand for that troop.
6 Figure 1.1. Fuel Supply Protocol
Army troops report their annual fuel demand for each type to K.K.K
Navy troops report their annual fuel demand for each type to Dz.K.K
Air troops report their annual fuel demand for each type to Hv.K.K
Hv.K.K determines the monthly need for each troop and report it to Ministry of National
Defense
Refinery in Location Z begins to produce the needed amount of fuel
Dz.K.K determines the monthly need for each troop and report it to Ministry of National
Defense K.K.K determines the
monthly need for each troop and report it to Ministry of National
Defense
National Defense Ministry determines the amount and the type of the fuel the troops will take, the date troop will obtain it, the location that will provide
the fuel for the troop
Fuel supply protocol is signed between the National Defense Ministry and POAS
7
During wartime, troops do not prepare fuel demand forms. Since time is very limited for the execution of an operation, the troops can obtain the fuel daily from the locations by reporting it to the MSNF and Forces Commands
2. Shipment of the Fuel to the Main Locations:
Fuel, when produced and refined in Location Z, is shipped from Location Z and transported to the main locations of the east and west pipeline systems. To transport fuel from Location Z to these main tanks, A-type and B-type ships are used. A-type ships can carry 7000 metercube units and B-type ships can carry 5000 metercube units. Each ship can be assigned to carry only single type of fuel.
3. Fuel Transportation from Main Locations to the Further Locations:
All types of fuels are transported to the local tanks by means of Turkey-NATO pipelines where the troops get their demands. Turkey –NATO pipeline facilities were constructed by NATO in 1953 and these facilities are in use since 1957. The duty to take care of and preserve the system was assigned to Turkısh National Defense Ministry and for this aim Military Supply and NATO Facilities Administration Center (MSNF) was assembled. Missions of MSNF can be summarized as below:
A) To operate Turkey-NATO pipeline facilities
B) To ensure the fuel for Turkish armed forces in peace and in war conditions
C) To ensure the need for fuel for other NATO forces whenever these NATO forces are assigned a duty, a drill or an action in Turkey
Turkey- NATO pipeline system consists of two separate pipelines in the east and west regions of Turkey. Although we considered the system as a whole, we mostly
8
concentrated on the fuel supply system of the troops in the east region of Turkey and investigated the response of the pipeline systems, which we thought to be of vital importance for the system.
The original aim to build the pipeline in 1953 was to provide the jet fuel for Air Forces Command, but as time passed it was realized that the system remains idle for most of the time. Thus the idea to transport motorin and benzin in addition to jet fuel was accepted. Today three types of fuel can be transported from a single pipeline without the need to transport any purification material between the transportation of two distinct fuel types.
4.
Transportation of Fuel from the tanks to the Troops:In locations, there exist huge tanks to store different types of fuel. Some locations store and supply only one type of fuel, where as some others store and supply two or three types of fuel. The troops having been assigned the location, the amount of fuel and the date to get the fuel in a month, may get more or less the same amount of fuel from the tanks in that location by reporting that amount to the Forces Commands and MSNF. Also the date to obtain the fuel is not a strict rule and the troops in practice may get that fuel in any day of the month. The fuel is taken from the locations and carried to the troops by the POAŞ tankers.
1.2. Objectives and Scope of the Thesis
In the thesis, we strictly discuss the second and third steps of fuel supply related to the east pipeline system widely. We try to find the steady-state performances of the system in the peace conditions. The Ministry of National Defense is currently thinking
9
of making the system available for civilian use up to some amount of fuel, but they can not estimate the amount of this availability. Thus, we first investigate the utilization of the ships, try to infer some conclusions by evaluating these utilizations and make some suggestions. The east pipeline system has 15 different pipelines. We calculate the yearly transportation amounts of each of these pipelines and find the additional quantities that can be transported when the system remains idle. Furthermore, we check the utilization of tanks and try to find the minimum numbers and capacities of tanks in each of the locations so that the troops continue to get their demands but MSNF does not store any extra amount of fuel. This study also provides us a basis to make studies on the war conditions, which Turkey has never experienced. The main operation rule of the pipeline system, the concept of trigger levels for the tanks in the locations, remains as a mystery for MSNF. Without the knowledge of when to suspend transfer of a fuel type to the next location and when to resume it, the system can not provide fuel efficiently for the troops. We checked the existing belief about the trigger levels, which is the 10%. Then, we search the optimum trigger levels for these tanks with the help of genetic algorithm so that the system supports all types of fuel for a longer time. Doing so, we are almost sure that the system cannot provide fuel not because of inefficient scheduling, but because of insufficient fuel. That is, whole tanks containing the same fuel type in all locations collapse at the same time. We make some tank assignment changes in the system and measure the effect of this new alteration for the system in terms of duration. We also test the availability of these trigger levels for different demands and batch sizes and conclude some important results. The breakdown rates of the pumping machines are increased and the response of this increment is checked.
10
The rest of the thesis is organized as follows: In Chapter 2, a brief review of the literature is presented. The pipeline system is described in Chapter 3. First, a general view of the system is given and the simulation model is explained in detail. The elements of the simulation model, their relationship and the flow of the entities that represent the products are explained. The data requirement is also discussed. In Chapter 4, we perform the validation and the verification of the model, determination of the warm-up period and the run lengths. Also the outputs of the existing system are discussed in this chapter. In Chapter 5, we look for the best operational rules by applying the genetic algorithm and evaluated the performance of the system in the simulated war conditions. In chapter 6, the results of the simulation study are discussed and future research directions are given.
11
CHAPTER 2
LITERATURE SURVEY
Our study contains simulation of pipelines and optimization of the trigger levels using Genetic Algorithm. So, we search the studies related to these subjects. Crane, Wainwright and Scoenefeld (1994) study the scheduling of multi-product liquid pipelines using Genetic Algorithms. The study explores the application of GA to the problem of scheduling product movement in a multi-product liquid pipeline. The objective of the study is to simulate the movement of products in a pipeline in an efficient way and then assess the relative value of the end-state according to the preset goals (to meet the demands). Some assumptions are of course made. These are; only unidirectional flow is allowed, no pump failure exists, tank sizes are the same and tanks have the trinary storage capacity of 0 (empty), 1(half full) and 2 (full). The problem is solved by GA using LIBGA. In a two products pipeline application the incoming product at each terminal could be product A, product B or no product. The storage product at a terminal could be 0, 1 or 2. Thus there exist 27 possible combinations of the status at each terminal. The actions once evolved for each of the 27 status combinations are constant and are applied to the pipeline in a series of time.
Santos (1997) studies the design of the Bolivia-Brazil pipeline. The paper focuses on a single pipeline without storage facilities and with a flow demand that varies with respect to time in an hourly basis so as to show a behavior that could not be considered as a steady-state flow. The software used is TGNET 5.3E. He employs the transient analysis to make a pre-definition of the compressors that best fit the
12
system and also defines the best arrangement for these compressors (whether few units and bigger compressors or more units and smaller compressors). In line with this a failure analysis for a single unit or for whole units (the worst case) and foresee how the system would cope with that, define a better maintenance procedure and even detect a necessity of a standby unit. Transient analysis is extremely important for the pipeline simulation because it could be seen well in advance the need of capital investment without any risk for the future, as well as better define the transportation cost involved in the scenarios.
Ruskinov (1994) conducts simulation studies on the pipelines in Russia. The objective of the study is to identify the measures to be taken and the investment to be realized to ensure that the audited infrastructure will operate safely within acceptable environmental and economic conditions due to a continuous increase in the demand is expected within next 10 years. Software is Simone. The study uses the following successful steps: Analysis of available studies on the network in Russia, physical audit on selected pipeline sections, pump stations and associated facilities, data collection, hydraulic modeling of the existing pipeline system, identifications of the average renovation/modernization cost and screening, evaluating and ranking of all potential activities to be performed in order to put the audited pipeline infrastructure to meet the future demands. The results indicate that the network with, in the present topology with some minor changes is sufficient to satisfy the internal demand forecasts up to year 2002, but seems to be inadequate to meet the foreseen demand after 2002.
Johnson (1993) investigates the forecasting wartime fuel tank levels. In this study, the author gives a brief description of peacetime fuel needs for a troop in a specific time unit and explores the amount of the necessary fuel for the same troop
13
under war conditions in a given time period. Type of the war, length and width of the front ahead of the troop, organic sectors of the troop, the terrain of war scene, the weather conditions all effect the need for fuel either in negative or positive way.
Beggs and Johansen (1994) deal with the optimization of the simple pipeline systems, which are up to three levels. The problem is regarded as an example of network problem. Fuel is regarded as “moving resources” along routes. There exists a pumping cost per barrel per each mile. Single type of fuel is taken into account and any possible failures are ignored. The whole system is deterministic, and the demand does not vary. Objective function is to minimize the total pumping cost. Constraints are the capacity of the stockhouses, capacity of the pipeline, and the demand at each stockhouse. In other words, the paper examines to decide how many barrels per a given period to pump along the pipeline so that minimum amount of extra fuel is left at the stockhouses after the demand has been met.
DeJong and Spears (1989) investigated the benefits of solving combinatorial optimization problems using genetic algorithms. They suggest that the pipeline-scheduling problem has a very large solution space. The number of possible schedules is a function of the size of the pipeline and the number of products it transports. A sufficiently large pipeline transporting many different products will produce a solution space far too large to exhaustively search. They choose GA approach as a likely method for producing effective results.
In another study, Mason (1998) compares one-dimensional and three-dimensional models for the simulation the flow of a gas-solid mixture through a pipeline. The implementation of each model is presented in terms of the changes made to the generic model in order to describe this type of flow.
14
Jerry Banks (1998) explains the importance of selecting software for simulation and selection includes: Input, Processing, Output, Environment, Vendor and Cost. There are many popular discrete event oriented simulation languages. Since our study is a continuous simulation and Automod has this capability in describing the “Tanks & Pipes” system, we use advantage of Automod. The range of definition is extensive. Numerous control statements and also a separate utility option (AutoStat) is available.
The decision-makers concerned with whether a model and its results are correct. This concern is addressed through model verification and validation. Sargent (1994) recommends a procedure for the verification and validation.
Simulation models are built with the intent of studying the behavior of the real system represented by the model. However, a simulation model generates random outputs. Centano and Reyes (1998) state that these outputs should be analyzed with certain techniques and concepts to interpret some conclusions about the model.
There exist some techniques to find the optimal values of controllable variables through a response surface generated by simulation of a particular system. The classification scheme according to Tekin and Sabuncuoglu (2000) is:
1. Local Optimization, which comprises Discrete Decision Space and Continuous Decision Space
2. Global Optimization, which contains Genetic Algorithms, Tabu Search, Simulated Annealing, Bayesian / Sampling Algorithm and Gradient Surface Method
They classify these techniques according to the problem characteristics such as the shape of response surface, objective functions and parameter spaces. Major advantages
15
and possible drawbacks of the existing studies are discussed.
The Genetic Algorithm procedure is a useful procedure when the system has stochastic variables (Stuckman, Evans and Mollaghasemi (1994)). The paper presents a methodology for the application of global search methods to optimizing the results of simulation. They discuss specific global optimization methods included simulated annealing, genetic algorithms and bayesian techniques in terms of their strengths and weaknesses.
While studying on the outputs, we benefit from AutoStat and Carson (1996) studies AutoStat, the output statistical analyzer. In the paper he gives brief information about AutoStat and states that it offers several statistical methods, including confidence intervals, a ranking and selection procedure, design of experiments and warm-up determination. It sets factor levels to realize desired scenarios, without having to modify the underlying model.
These studies tell us that pipeline simulation is an advancing field of study. Almost all of the studies deal with only one purpose, i.e., meeting the demands. In our study, we also want to satisfy the troops in terms of demands. Different from the usual studies where the purpose is generally to transport a specific fuel type, we study a pipeline system, which can transport three different fuel types at the same time. The concept of trigger levels, which we will try to optimize, is not a well-studied subject. Since some people conduct Genetic Algorithm for that kind of studies, and the nature of our study is also suitable for the same purpose, we notice that we may benefit from GA.
16
CHAPTER 3
SIMULATION OF THE MILITARY FUEL SUPPLY SYSTEM
In this study, simulation is used to analyze the existing military pipeline system, which is used to supply troops’ demands in the east region of Turkey.
3.1. Formulation of problem and plan study
War requires extraordinary logistics in extraordinary quantities. The more fuel provided to a force, the farther, faster and longer the force would be able to sustain a fight. There is no doubt about the importance of petroleum in a wartime scenario. Without fuel, the force changes instantly from a fierce fighting machine to a sitting target. In the previous chapter, we have described the four consecutive stages of fuel supply. In this chapter, we will explain the second and third stages in details. Some of the data families required will be explained in this chapter when system description is being made, others are included in Appendix A.1
3.2. System Description
3.2.1. Shipment of Fuel to the Main Locations
It is assumed by the Ministry of National Defence that enough fuel of any type can be produced and refined in Location Z in case of a war. Thus, no short of fuel production is being expected. Once the required amount of fuel is produced and refined in Location Z, the need of transporting them in batches to the main locations emerges. The main locations for the east pipeline system are the tanks in Location A
17
and Location B. Location A stores jet fuel and Location B, in two distinct regions, stores diesel fuel and gasoline. To transport fuel from Location Z to these main tanks, A-type and B-type ships are used. A-type ships can carry 7000 units and B-type ships can carry 5000 units. All the fuel units mentioned in this thesis are type of cubic meters. The data about these ships are available at Table 3.1. The distributions of these data are all uniform distribution. These ships are available in peace conditions. In addition to these ships, when a war comes into sight, an additional A-type ship will be assigned to transport jet fuel to Location A.
Table 3.1. Ships assigned to transport fuel to the main locations
DESTINATION
LOCATİON A LOCATİON B LOCATİON B
Fuel Type Jetfuel Diesel fuel Gasoline
Number of A-Type Ships Assigned 1 1 0
Number of B-Type Ships Assigned 1 1 1
Time of A-Type Ship to Travel 4-5 Days 5-6 Days 0 Time of B-Type Ship to Travel 3-4 Days 4-5 Days 4-5 Days
3.2.2. Transportation of Fuel through the Pipeline System
East pipeline system has three starting locations. As can be seen from Figure 3.1, one starts from Location A and reaches Location E after Location C. The other starts from Location B, reaches Location E after Location D. The last pipeline also starts from Location B and reaches Location E parallel to the second pipeline. The reason to have three main tanks is to ensure Location A pipeline to transport only jet fuel, to ensure one of the pipelines originating from Location B to transport only diesel fuel and the other to transport only gasoline up to Location E. From Location E
18
there exists only a single pipeline from which the three types of fuel are transported via a special scheduling. The pipeline arrives Location F after Location E and from Location F the pipeline system separates into two distinct directions. One reaches Location J by means of Location G, Location H and Location I. The other pipeline reaches Location K and again the system separates into two, one of which goes to Location L, the other goes to Location M and then Location N. There is also a pipeline constructed short time ago parallel to the original pipeline between Location K and Location M to transport only jet fuel to Location M because of the high jet fuel consumption in Location M. The capacities of the tanks for each type of fuel are depicted in Table 3.2 and the capacities of the pipelines and the diameter of the pipeline between two tanks are depicted in Table 3.3.
Location I Location H Location J Location G Location K Location L Location F Location N Location E Location M Location C Location D Location A Location B Jet Fuel Diesel fuel Gasoline
Table 3.2. The Capacities of the Tanks for each type of Fuel
Table 3.3. The diameters and the capacities of the pipelines
TANK CAPACITIES
NO
TANK
LOCATION JETFUEL (units) DIESEL (units) GASOLİNE (units)
1 Location A 50000 0 0 2 Location C 40000 0 0 3 Location B 0 15000 15000 4 Location D 0 30000 0 5 Location E 11250 11250 11250 6 Location F 20000 15000 10000 7 Location K 10000 3750 3750 8 Location M 12500 7500 5000 9 Location N 5000 5000 5000 10 Location L 7500 10000 7500 11 Location G 7500 10000 7500 12 Location H 3750 6250 6250 13 Location I 2500 15000 12500 14 Location J 0 3750 3750 TOTAL 170000 132500 87500
NO PIPELINE NAME PIPELINE DIAMETER PIPELINE CAPACITY
1 Location A-Location C 16 inches 4000 units 2 Location C-Location E 16 inches 5000 units 3 Location B-Location D 10 inches 2500 units 4 Location D-Location E 10 inches 2500 units 5 Location B-Location E 10 inches 5000 units 6 Location E-Location F 12 inches 7000 units 7 Location F-Location G 6 inches 2000 units 8 Location G-Location H 6 inches 4500 units 9 Location H-Location I 6 inches 3000 units 10 Location I-Location J 6 inches 2000 units 11 Location F-Location K 8 inches 2500 units 12 Location K-Location L 6 inches 4500 units 13 Location K-Location M 6 inches 1000 units 14 Location K-Location M (jet) 4 inches 500 units 15 Location M-Location N 4 inches 750 units
The pipeline can transport three types of fuel without the need of any purification material between the transportation of two distinct fuel types. Since these three fuel types are being transported in the same pipeline, the leaps of one type of fuel sticked to pipeline walls are swept away by the following type of fuel and only the foregoing little amount of the second type is mixed with the first type. This mixed amount is considered negligible for diesel fuel and gasoline, but for jet fuel this mixed amount should be discarded away before taken into a tank.
There are 14 locations connected to the pipeline. The troops get their demand from the tanks in these locations. The tanks in Location A and Location B pump all their fuel forward as soon as possible so that new batches can be ordered from the refinery in Location Z. The procedure applied in the system is a typical continuous review procedure. The order point for Location A is 38000 units. That is, when the current level of jet fuel in Location A decreases to 38000 units, Location A requires a batch from Location Z. The order points for both for diesel fuel and gasoline tanks in Location B are 8000 units. The fuel tanks in Location C and Location D also try to pump their contents to get fuel from the main locations causing the tanks in these locations to reach their order points more quickly.
As we have mentioned before, all the other locations in the pipeline system after Location E use a single pipeline to transport three different types of fuel. Thus the transportation between the source location and the destination location should be conducted in a systematic technique. In a pipeline between two locations, there can be three types of fuel at different amounts at the same time. Deciding on the type of the fuel to transport from a source location to the destination location depends upon the full percentages of the fuel tanks in the destination locations. First the
percentages of each type of fuel in the destination location tanks is evaluated and once the minimum of these percentages is found, the source location begins to transport a batch of the fuel if it has enough fuel. That is if the destination location has the lowest full percentage of diesel fuel when compared to the other two types, the transportation becomes a diesel fuel transportation with the condition that the source location should have enough diesel fuel to send. If the source location does not have enough diesel fuel, then out of two remaining fuel types, the one having the minimum percentage in destination location is found and this type of transportation begins. The amount of a fuel type already in a pipeline between two locations is also included into the percentage of that type as if it were in the destination location tank. The source location does not transport a type of fuel if that fuel tank in destination location is 95% or more filled. All the source locations are considered to have enough fuel if they have 10 percent of the tanks full. That is, they can transport fuel to the destination locations if their current fuel levels are above their 10% capacities. This percentage is also called “trigger level”. Once the tank of a fuel type in a location decreases its trigger level, it immediately suspends the flow and does not resume until its level exceeds its trigger level by one batch. As a result, to ensure transportation, two conditions should hold; a fuel tank in a destination location should be less than 95% and the same fuel tank in source location should be greater than its trigger level. We try to give some examples about the usage of trigger levels. Below, in Figure 3.2 we present four examples related to deciding the type of fuel to be transported between Location E and Location F. The arrow shows the direction of transportation. J, D and G correspond to jet fuel, diesel fuel and gasoline respectively. The percentage written on a tank depicts the ratio of the material in that tank to its capacity. The reason why a fuel type
Location E Location E Location F Location F
Location E transports gasoline. Because, Location F has minimum percentage of gasoline and Location E has enough gasoline
Location E transports gasoline. Because, although Location F has minimum percentage of jet fuel, Location E does not have enough jet fuel. Between the other two types, Location F has less percentage of gasoline. Location E Location E Location F Location F Location E transports diesel fuel. Because, although
jetfuel and gasolin percentages in Location F are less than diesel fuel percentage, Location E does not have enough amounts of these fuel types
No transportation occurs. Because, all the fuel types in Location F has percentages of greater or equal to 95%
Figure 3.2. Examples related to the trigger levels and fuel types to be transported
J 60% D 70% G 60% J 60% D 80% G 20% J 5% D 70% G J 15% D 80% G J 5% D 15% G 5% J 25% D 80% G 20% J 60% D 70% G 60% J 95% D 96% G 97%
be transported, is explained under each example.
To transport the fuel from one source location to a destination location, there exist 53 pumping stations in some towns and big cities. Some of these pumping stations are nearby the location while some other are placed at the proper mid-points of some location to provide the flow of fuel more efficiently, where altitude differences make it impossible to pump from source location to destination location with the help of only one pump. Since there exist multi pumps between the source location and the destination location and since these pumps are very old fashioned, the current pumping capacity of these pumps may differ from one batch to another batch or from one day to another. The pumping capacities between of the pipelines the locations are included in Table 3.4. In peace conditions the pumping stations work for 8 hours a day, 5 days a week. In war conditions they can work up to 22 hours a day which will allow the system 2 hours for maintenance and rest. The sizes of the batches transported in each pipeline and their calculation are included in Appendix B.2.
Table 3.4. Current Pumping Capacities of the Pipelines
NO PIPELINE NAME CURRENT PUMPING CAPACITY (unit/hour)
1 Location A-Location C 300-330 2 Location C-Location E 300-330 3 Location B-Location D 100-120 4 Location D-Location E 100-120 5 Location B-Location E 100-120 6 Location E-Location F 120-140 7 Location F-Location G 60-80 8 Location G-Location H 60-80 9 Location H-Location I 60-80 10 Location I-Location J 60-80 11 Location F-Location K 80-100 12 Location K-Location L 60-80 13 Location K-Location M 60-80
14 Location K-Location M (jet) 30-40
In this thesis, we study on the sufficiency of the Turkish Military Fuel distribution and network system in both peace and war conditions so as to improve the system and to optimize it, if possible. The main objectives of the study are listed below, under two titles.
3.2.2.1. In Peace Conditions:
The utilization of the pipelines in terms of the amount of fuel transported is extremely important to calculate the idle usage of the pipelines. The fuel tanks in the source locations transport three types of fuels via pipelines by taking into account the percentages of the tanks in the destination locations. When the percentage for each of the three fuel types in the destination location are not less than 95 %, the source location suspends the transfer and the pipeline remains idle. We calculate the amount of fuel that can be discharged when the pipeline is idle and call it idle_fuel. Having done this, we manage to have the total amounts of all fuel types that are transported in each pipeline. Thus, it helps us to collect statistics not only about the percentages of each three types of existing fuel types passing through a specific pipeline, but also gives the amount of idle_fuel and the percentage of the idle_fuel to the total amount discharged. The Ministry of National Defence is thinking of making the system available for civilian use up to some amounts and the determination of the amount of idle_fuel discharged can help them to make some conclusions about the whole system. They can consider some amounts of this idle_fuel as diesel fuel and some amounts as gasoline and transport these fuels for civilian use to make money.
Every type of fuel is stored in various sized multi-tanks in each location. The number of tanks in each location and their volumes have been submitted in
Appendix B.1.1. Since the utilization of the tanks in every location is very low, it is possible to use only limited number of these tanks to avoid the cost of extra inventory on yearly basis. Thus we tried to find the minimum number of tanks in each location and their capacities, which satisfy the need of fuel for troops in peace conditions.
Finally, modeling the system in peace conditions will help us to validate the model in war conditions and will provide us the initial conditions for an expected war.
3.2.2.2. In War Conditions (In Defense Operation Analyses):
It is known that for the very first 30-40 days of a war, the fuel demand for these types of fuels increases for about 15 times than that of peace conditions (Fuel Master Plan, K.K.K. Fuel Acquisition Office, 1998). We search whether the system can meet such huge demands in these 30-40 days for all types of fuels. If met, what can be the longest time period that the system can keep on providing the same amount of fuel. If not met, what alterations in the system such as additional tank construction or assigning some tanks to store other types of fuel can avoid this short of fuel.
Turkey has not been in war since the first construction of the pipelines. Thus the efficiency of the trigger levels could not be tested. The trigger level, which is believed to be the 10% of the tank capacity for a fuel type, suspends the flow of fuel to the next location until tank current level of that fuel type reaches a level, which is considered as batchsize + trigger level of the tank capacity. Hence, a fuel tank falling to 10% suspends transfer, does not transfer any amount of fuel until it reaches batch size + trigger level and then resumes transfer. This might work well if the fuel demands for each location are proportional to fuel tank capacities. But in reality, this is not the situation. Thus, we will attempt to find the optimum trigger levels for each type
of fuel tank in each location so that both the demands can be met and the system performs longer.
3.3. Why not Analytical Solution?
At first glance Multi-echelon forms of inventory problems seem to be available for the modeling and solution of the system, but there are some reasons that prevent the use of Multi-echelon approach. Firstly, Multi-echelon forms mostly deal with the transportation and storing of a single type of an item, but in our system we have three different types of fuel and there occurs an interaction among these fuel types during transportation. Secondly the system has a replenishment capacity, i.e. pipeline capacity, between two locations, which both restricts the transportation amounts and restricts the arrival of two or more types of fuel at the same time since the pipeline can discharge only a single type of fuel at any time. Thirdly, while Multi-echelon forms is mostly applicable and effective on two and on three levels, our system has more than three levels everywhere in the system. For example, diesel fuel is transported on a seven levels route, i.e. follows the path Location B Location D Location E -Location F - -Location G - -Location H - -Location I - -Location J. That makes the system very complicated for the use of analytic approach. Lastly, the system includes many stochastic features, which forces us to ignore analytic solution. The system mostly is a continuous one and the state variables change continuously over time. Thus, in order to solve it analytically, one should solve many differential equations all of which are stochastic. As a result, we prefer to use simulation and modeling approach.
3.4. Why Simulation?
Simulation allows much greater flexibility in representing the real system. Once a model is built, it can be used repeatedly to analyze different policies, parameters or design alternatives. In our model we tried different trigger levels rather than taking the chance of experimenting on the real world system which we can never do so. Our system consists of many locations and pipelines in which the alterations in the capacities and flow rates would cause different outputs and would direct us to different solutions. Thus, the system is very suitable for “what if” questions and the application of all the alternative projects can be easily evaluated without so much effort.
The system also has many stochastic features such as the transportation times of the fuel from the refinery to the main locations, peace and war time demands of the troops, breakdowns and the survival times of the pumping machines, the pumping capacities of these pumping machines etc. Thus, we should not decide on a single run and these stochastic features make it necessary to make many replications of the system to have an estimate of the parameters. Finally, the simulation has the capability to animate the model, which helps us to see whether we have modeled the system right and to notice the bottlenecks of the system while running it and watching every event.
3.5. Model Development
The model is developed under the structure of the Figure 3.3. (Law and Kelton, 1991). The stages of the model development process is given next.
Figure 3.3. Structure of development.
3.5.1. Conceptual Model
Conceptual model contains elements of the real system, which should be included in our model. These include events, entities, attributes, exogenous variables, endogenous variables, operational rules, initial conditions and assumptions of the existing system.
3.5.1.1. Events
In this model, the events are the arrival of the 5000 and 7000 units of batches to the main locations, transportation processes to the next location by means of pipelines, trigger processes for each of the fuel types in the locations, breakdown processes for the pumping machines, leakage processes and the arrival of the demand processes. Complete lists of the events are presented in the Appendix A.2.
3.5.1.2. Entities and Attributes
The entities are ships, the tanks in all the locations, pumping machines, fuel and the pipelines. The attributes are the type of the ships, the capacity of the main and local tanks, the capacity of the pipelines, the speed a pumping machine can transport fuel, breakdown rates for the pumping machines and the type of the fuel being transported through a pipeline or being stored in a tank.
Conceptual Model Logical Model Simulation Model (Code)
3.5.1.3. Exogenous Variables
Exogenous Variables are the type and number of ships and their specifications, the capacities of the fuel tanks in the locations, the capacities of the pipelines, the pumping rate of a pipeline, batchsize, the trigger levels, number of breakdowns and their specifications, working times and arrival and size of demands.
3.5.1.4. Endogenous Variables
(1) State Variables: State of ships, state of pumping machines, current level of fuel in
the tanks, current amount of fuel in the pipelines are the state variables of the system.
(2) Performance Measures: Average utilization of ships, utilization of fuel tanks and
pipelines for every type of fuel, minimum tank sizes, the duration the system can supply fuel for troops, optimum trigger levels.
3.5.1.5. Initial Conditions and Operational Rules
There is no beginning breakdown in the system. No ship is en route to main locations or refinery. No back order is designed for the demands and the whole system is accepted to have collapsed when any one of the fuel tanks in any location cannot meet the required demand for any troop. For peacetime scenario, the tanks in the regional locations are completely empty at the beginning of the simulation so that we can delete the transient period of the non-terminating simulation. The tanks in the main locations are half full to start the transportation immediately. For wartime scenario, all the fuel tanks in the locations are at their peacetime mean levels at the very beginning of a war. The system operates 8 hours in a day and 5 days in a week in peacetime scenario, 22 hours in a day and 7 days in a week in wartime scenario.
3.5.1.6 Assumptions of the Model
In this study our main goal is to model the east pipeline system. We assume that whenever there occurs a breakdown in any one of the pumping machines between two pipelines, the current amount in that pipeline couldn’t be transported until the breakdown is repaired. Since it is not possible to model the leaks from a pipeline, we assume that the leaks occurred in the tanks into which the pipeline discharged its fuel. We also assume that ships transporting fuel to the main locations do not undergo any major breakdown that would prevent the accomplishment of the duty.
3.5.2. Logical Model
The logical model relates the relationships among the elements of the system. Figures 3.4-3.6 describe the logical relationship between these elements and exogenous variables that effect the system.
3.5.3. Simulation Model (Code)
The simulation code of the existing pipeline system is developed in Automod 9.1 (2000). Automod has the capability to model continuous simulation and it enables to define tanks and pipes system with no difficulty. Autostat, which is the output data analyze processor of Automod, assists to implement optimization for different factors, obtain confidence intervals, construct warm-up periods and so on. The source file for the system is about 3000 lines and also additional process definitions, order lists, variables, counters and functions are defined in experimental frame of Automod. A part of code is presented at the Appendix A.3.
Figure 3.4. General Fuel Supply System of Turkish Army. Fuel is produced and
processed in the refinery.
Wait until the main tanks decrease their re-order levels
Decide on the type of the ship to transport the needed type of
fuel
Transport the fuel by ships to the main
locations
Transport the fuel to the regional locations by means of
pipeline system
Distribute the fuel from all locations to the troops using
Yes No
Yes
No
Figure 3.5 Shipment of fuel from the refinery to main locations and behaviour of the main locations.
Main Location Fuel level < Re-order Level?
Keep on transporting fuel to the next location, Supply fuel for troops
Keep on transporting fuel to the next location, Supply fuel for troops
Decide on the type of ship to transfer fuel to the main location
Wait for travelling time for the ship
Main location current level < main location trigger level ?
Keep on transporting fuel to the next location, Supply fuel for troops
Begin to pump the fuel to main location if ship has arrived
Stop transporting fuel to the next location until current level
exceeds trigger level by
batchsize, supply fuel for troops.
Check main location current level < main location re-order level?
No Yes Jet Fuel Yes No Yes Yes Yes No No No Yes No No Yes
Determine the fuel type having the minimum percentage in the destination location
Does the destination location have all fuel types of more than 95% ?
Destination location current diesel fuel level < destination location current gasoline level ?
Is source location current diesel fuel level > source location diesel fuel trigger level?
Transport diesel fuel
Transport gasoline
Is source location current diesel fuel level > source location diesel fuel trigger level ?
Do not transfer any type of fuel, keep the pipeline idle Re-evaluate the destination location fuel percentages
Transport Diesel fuel Does source location current
gasoline level > source
location gasoline trigger level ?
Wait until one of the fuel types in the source location is greater than its trigger level Does source location
current jetfuel level > source location jetfuel trigger level
Wait until one of the fuel types in the destination location is less than 95% Transport jetfuel
Is source location current gasoline level > source location gasoline trigger level ?
Transport gasoline
Do not transfer any type of fuel, keep the pipeline idle
Re-evaluate the destination location D
Yes No Yes Yes Yes No No No Yes No No Yes D
Destination location current jetfuel level < destination
location current gasoline level ?
Does source location current jetfuel level > source location jetfuel trigger level ?
Transport jetfuel
Does source location current jetfuel level > source location jetfuel trigger level ?
Do not transfer any type of fuel, keep the pipeline idle Re-evaluate the destination location fuel percentages
Transport jetfuel Does source location current
gasoline level > source
location gasoline trigger level ?
Wait until one of the fuel types in the source location is greater than its trigger level Does source location current
diesel fuel level > source
location diesel fuel trigger level Transport diesel fuel
Does source location current gasoline level > source
location gasoline trigger level ? Transport gasoline
Do not transfer any type of fuel, keep the pipeline idle
Re-evaluate the destination location fuel percentages Transport gasoline