SOFTWARE DESIGN, IMPLEMENTATION,
APPLICATION, AND REFINEMENT OF A
BAYESIAN APPROACH FOR THE
ASSESSMENT OF CONTENT AND USER
QUALITIES
a thesis
submitted to the department of computer engineering
and the graduate school of engineering and science
of bilkent university
in partial fulfillment of the requirements
for the degree of
master of science
By
Melihcan T¨
urk
September, 2011
I certify that I have read this thesis and that in my opinion it is fully adequate, in scope and in quality, as a thesis for the degree of Master of Science.
Prof. Dr. Halil Altay G¨uvenir(Advisor)
I certify that I have read this thesis and that in my opinion it is fully adequate, in scope and in quality, as a thesis for the degree of Master of Science.
Dr.-Ing. Markus Schaal
I certify that I have read this thesis and that in my opinion it is fully adequate, in scope and in quality, as a thesis for the degree of Master of Science.
Dr. David Davenport
Approved for the Graduate School of Engineering and Science:
Prof. Dr. Levent Onural Director of the Graduate School
ABSTRACT
SOFTWARE DESIGN, IMPLEMENTATION,
APPLICATION, AND REFINEMENT OF A BAYESIAN
APPROACH FOR THE ASSESSMENT OF CONTENT
AND USER QUALITIES
Melihcan T¨urk
M.S. in Computer Engineering Supervisor: Prof. Dr. Halil Altay G¨uvenir
September, 2011
The internet provides unlimited access to vast amounts of information. Technical innovations and internet coverage allow more and more people to supply contents for the web. As a result, there is a great deal of material which is either inaccurate or out-of-date, making it increasingly difficult to find relevant and up-to-date con-tent. In order to solve this problem, recommender systems based on collaborative filtering have been introduced. These systems cluster users based on their past preferences, and suggest relevant contents according to user similarities. Trust-based recommender systems consider the trust level of users in addition to their past preferences, since some users may not be trustworthy in certain categories even though they are trustworthy in others. Content quality levels are important in order to present the most current and relevant contents to users. The study presented here is based on a model which combines the concepts of content qual-ity and user trust. According to this model, the qualqual-ity level of contents cannot be properly determined without considering the quality levels of evaluators. The model uses a Bayesian approach, which allows the simultaneous co-evaluation of evaluators and contents. The Bayesian approach also allows the calculation of the updated quality values over time. In this thesis, the model is further refined and configurable software is implemented in order to assess the qualities of users and contents on the web. Experiments were performed on a movie data set and the results showed that the Bayesian co-evaluation approach performed more ef-fectively than a classical approach which does not consider user qualities. The approach also succeeded in classifying users according to their expertise level. Keywords: Information quality, web 2.0, collaborative systems, recommender systems, collaborative filtering, Bayesian networks, co-evaluation, trust-based systems.
¨
OZET
BAYES YAKLAS
¸IMI KULLANILARAK ˙IC
¸ ER˙IK VE
KULLANICI N˙ITEL˙IKLER˙IN˙IN
DE ˘
GERLEND˙IR˙ILMES˙I ˙IC
¸ ˙IN YAZILIM TASARIMI,
KODLAMASI, UYGULAMASI VE GEL˙IS
¸T˙IR˙ILMES˙I
Melihcan T¨urk
Bilgisayar M¨uhendisli˘gi, Y¨uksek Lisans Tez Y¨oneticisi: Prof. Dr. Halil Altay G¨uvenir
Eyl¨ul, 2011
˙Internet, her t¨urden bilgiye ula¸smak i¸cin ¨onemli bir kaynaktır. Teknolojik yeni-likler, ¸cok sayıda insanın internette bilgi payla¸sabilmesini sa˘glamı¸stır. Bu du-rum, internetteki gereksiz bilgi miktarının artmasına yol a¸cmı¸s ve insanların ihtiya¸c duydukları bilgiye ula¸sması zorla¸smı¸stır. ˙Insanların gereksinim duyduk-ları bilgiye kolayca ula¸sabilmeleri i¸cin Katılımcı Filtrelemesini Kullanan Tavsiye Sistemleri ortaya ¸cıkmı¸stır. Bu sistemler, kullanıcıların ge¸cmi¸s tercihlerini g¨oz ¨
on¨unde bulundurarak onları gruplandırır ve aralarındaki benzerlikleri dikkate alarak ilgili olan i¸cerikleri onlara ¨onerir. G¨uvenirlik Tabanlı Sistemler kullanıcı benzerliklerinin yanı sıra onların d¨ur¨ustl¨uk seviyelerini de hesaba katar. C¸ ¨unk¨u bir kullanıcının birka¸c konuda g¨uvenilir olması o ki¸sinin her konuda g¨uvenilir olaca˘gı anlamına gelmez. ˙Internetteki i¸ceriklerin kalitesi de kullanıcılara uygun ve g¨uncel i¸cerikleri sunabilmek i¸cin ¨onemlidir. Bu tezde, i¸cerik kalitesi ve kullanıcı g¨uvenirli˘gi kavramlarını bir arada kullanan bir ¸calı¸smayı baz aldık. Bu ¸calı¸smaya g¨ore, i¸ceri˘gi de˘gerlendiren ki¸silerin kaliteleri hesaba katılmadan, o i¸ceri˘gin kalitesi belirlenemez. C¸ alı¸smada, i¸cerik ve kullanıcı kalitelerinin bir arada belirlenme-sine imkan veren bir Bayes y¨otemi kullanılmı¸stır. Bayes y¨ontemi, bu kalite de˘gerlerinin zaman i¸cerisindeki de˘gi¸simlerinin hesaplanmasına da olanak sa˘glar. Bu tez i¸cin, yukarıda bahsedilen modeli geli¸stirip, kullanıcı ve i¸cerik kalitelerini de˘gerlendirmek i¸cin kullanılacak bir yazılım geli¸stirdik. Bir film veri seti ¨uzerinde yaptı˘gımız deneyler, modelimizin kullanıcı kalitelerini g¨oz ¨on¨unde bulundurmayan klasik y¨ontemden daha iyi sonu¸c verdi˘gini g¨ostermi¸stir. Y¨ontemimiz, kullanıcıları uzmanlık seviyelerine g¨ore sınıflandırmada da ba¸sarılı olmu¸stur.
Anahtar s¨ozc¨ukler : Bilgi kalitesi, katılımcı sistemler, tavsiye sistemleri, katılımcı fil-trelemesi, Bayes a˘gları, kullanıcı g¨uvenirli˘gi.
Acknowledgement
I am grateful to my supervisor Prof. Dr. Halil Altay G¨uvenir for his suggestions and criticisms about my study. I am also grateful to Dr.-Ing. Markus Schaal who has allowed me to use his previous studies and supplied essential material for my study. I would like to thank Dr. David Davenport for his valuable comments and suggestions.
I would like to address my thanks to The Scientific and Technological Re-search Council of Turkey (T ¨UB˙ITAK) for their financial support within National Scholarship Programme for MSc Students.
I would like to thank my parents and sister who encouraged and supported me during my studies.
Contents
1 Introduction 1
1.1 Statement of the Problem . . . 1
1.2 Significance of the Study . . . 3
1.3 Thesis Outline . . . 3
2 Literature Review 4 2.1 Recommender Systems . . . 4
2.2 Collaborative Filtering . . . 5
2.3 Trust Based Systems . . . 6
2.4 Information Quality . . . 6
2.5 A Bayesian Approach for Small Information Trust Updates . . . . 7
3 Co-Evaluation of Content and User Qualities 9 3.1 Model . . . 9
3.2 User Feedback . . . 11
3.3 Bayesian Reasoning . . . 12 vi
CONTENTS vii 3.4 Software Module . . . 14 4 Experiments 22 4.1 Experimental Setup . . . 24 4.1.1 Data Set . . . 24 4.1.2 Experimental Parameters . . . 25
4.1.3 Description of the Experiments . . . 34
4.2 Experimental Results . . . 36
4.2.1 Comparison with Classical Approach . . . 37
4.2.2 Ability of the System to Identify Experts . . . 38
4.2.3 Comparison between Experiments . . . 47
4.3 Evaluation . . . 48
5 Conclusions 49 5.1 Thesis Summary . . . 49
5.2 Contributions and Future Work . . . 50
List of Figures
3.1 The Relations between the Elements of the System . . . 10
3.2 Co-Evaluation of Content and Evaluator Qualities . . . 11
3.3 An example of a Bayesian Network . . . 12
3.4 Structure of the Bayesian Network . . . 13
3.5 System Architecture . . . 15
3.6 Class Diagram of Co-Evaluation API . . . 17
4.1 Structure of the Bayesian Networks in the experiments . . . 27
4.2 Conditional Probability Distribution Functions for Expert Users . 28 4.3 Conditional Probability Distribution Functions for Intermediate Users . . . 29
4.4 Conditional Probability Distribution Functions for Novice Users . 30 4.5 Conditional probability distribution (low quality movie/director) . 31 4.6 Conditional probability distribution (average quality movie/director) 32 4.7 Conditional probability distribution (high quality movie/director) 32 4.8 Change in Average Errors According to Expertise . . . 40
LIST OF FIGURES ix
4.9 Change in Mean Average Error According to Expertise . . . 41
4.10 Change in Median Average Error According to Expertise . . . 42
4.11 Change in Maximum Likelihood Average Error According to Ex-pertise . . . 43
4.12 Change in Average Errors According to Expertise . . . 44
4.13 Change in Mean Average Error According to Expertise . . . 45
4.14 Change in Median Average Error According to Expertise . . . 46
4.15 Change in Maximum Likelihood Average Error According to Ex-pertise . . . 47
List of Tables
4.1 Conditional probability distribution values . . . 31
4.2 Number of Movies Grouped by Monthly Ratings . . . 33
4.3 Number of Movies Grouped by Genres . . . 35
4.4 Precision, Recall and F-Measure Values per Approach . . . 38
4.5 Average Error Values per Experiment . . . 48
A.1 Experiment 1: Average Errors - Expertise . . . 55
A.2 Experiment 2: Average Errors - Expertise (Part-1) . . . 56
A.3 Experiment 2: Average Errors - Expertise (Part-2) . . . 57
A.4 Experiment 3: Average Errors - Expertise . . . 58
A.5 Experiment 4: Average Errors - Expertise (Part-1) . . . 59
A.6 Experiment 4: Average Errors - Expertise (Part-2) . . . 60
Chapter 1
Introduction
The invention of the World Wide Web [15] is a milestone in information sharing, allowing many to reach greater amounts of information in any field. At the beginning, it was designed as read-only, but later, the readers themselves were able to create new materials or new links on the web.
The second wave of World Wide Web technology, Web 2.0 [21], is built on the concepts of information sharing, user-centered design and collaboration, resulting in the establishment of Wikis (e.g. Wikipedia [12]), blogs (e.g. Blogger [2]), and social networks (e.g. Google+ [7], Facebook [5], and Twitter [11]). These web sites allow users to participate on the web as content creators. These develop-ments caused the amount of information available on the web to increase rapidly. As a result, a wide variety of information can now be accessed using the internet.
1.1
Statement of the Problem
The World Wide Web technology provides unlimited access to vast quantities of information. However, the information on the web is created without a control mechanism. As a consequence, there is a great deal of material which is either inaccurate or out-of-date, making it increasingly difficult to find relevant and
CHAPTER 1. INTRODUCTION 2
up-to-date content.
In order to solve this problem, some filtering mechanisms have been designed to cope with the mass of information available. Recommender systems were intro-duced in order to suggest important content items to the web users. Collaborative filtering is one of the methods used in recommender systems. The method con-siders user feedback on content items in order to group users according to their interests, so that items are recommended if similar users also liked or purchased that item.
However, the collaborative filtering approach has a number of weaknesses in the process of making recommendations. For example, some of the users may not be completely trustworthy in some categories, while they may be reliable in others. Trust-based systems were proposed in order to eliminate these weaknesses; such systems not only consider user similarities, but also the trust level of users. The concept of information quality on the web is also used to address the issues mentioned at the beginning of the section. Information quality is a type of measurement unit used to define the relevancy of information to the needs of people. The concept information quality is also used for describing the quality level of the content items on the internet. The quality of each content item is determined by either the users of each item or the information system profession-als. Then, only those content items that are relevant and of value to the users are presented.
The bridge between the information quality and trust is defined in an innova-tive study by Schaal [25]. This study proposes a model for assessing the quality of both contents and users on the web. Since the content and user qualities change according to time, they are updated throughout time.
CHAPTER 1. INTRODUCTION 3
1.2
Significance of the Study
In this thesis, we suggest improvements in Schaal’s model, mentioned at the end of the previous section. Since the methodology can be applied to different systems, we designed and implemented configurable software. We also performed experiments to test the model and refined the methodology.
In the model, the feedbacks submitted by the users for the content items are considered. A feedback identifies the user and carries information about the content, the value, and the submission time. The system processes the feedbacks as they arrive and updates the user and content qualities over time.
1.3
Thesis Outline
The thesis is organized as follows: The related systems are reviewed in Chapter 2. In Chapter 3, the model of co-evaluation of content and user qualities by Bayesian reasoning is presented. The experimental design is explained and the results are discussed in Chapter 4. The aim of the experiments is to demonstrate the feasibility of the approach and measure the ability of the system to identify high quality users. In Section 4.1 the experimental parameters are presented and explained. The results of the experiments are shown in Section 4.2. In Section 4.3, the performance of the system is evaluated. We conclude the thesis and provide future works in Chapter 5.
Chapter 2
Literature Review
The chapter discusses previous works proposed to solve the information relevance problem defined in Chapter 1. Recommender systems were introduced in order to suggest the relevant content items on the web with respect to preferences shown in the past. There are two types of recommender systems. The first type is content based recommender systems, which consider the similarities between the attributes of content items. The second is collaborative filtering, which considers similarities between the preferences of collaborators. Trust based systems were introduced because of the wide variety of preferences across the range of content items. At the end of the chapter, information quality and the innovative ap-plications which combine the concepts of user trust and information quality are discussed.
2.1
Recommender Systems
Due to the vast amount of information on the internet, some mechanisms are needed to filter the unnecessary data. Recommender systems were introduced because of this requirement. The aim of these systems [23] is to help people to locate the necessary information in the shortest possible time. These systems suggest useful content to the users based on their interests. Amazon [1] and eBay
CHAPTER 2. LITERATURE REVIEW 5
[3] are two of the most famous web-sites which use recommendation systems in making suggestion for their products.
There are two main types of recommendation systems. The first is content-based recommender systems [22], which use the features of the item and the interest of the users. For example, the web site Amazon makes further suggestions of relevant books to customers based on the attributes of the book bought, which may be related to the author or genre of the purchased book.
The other methodology is collaborative filtering [16], which simply uses the user feedbacks on items in order to make recommendations. The details of the methodology are described below.
2.2
Collaborative Filtering
Some web sites allow users to submit feedback about the content items on the site. Collaborative filtering considers this feedback in the recommendation pro-cess. The approach is built upon the idea that people often make decisions after considering the suggestions of friends who have similar tastes. In order to de-termine the users whose tastes are similar, the system groups users according to similarities in feedback given. If one user in a group buys an item, it is also recommended to the others who have not yet purchased the item. In Amazon, collaborative filtering approach is also used. They recommend the relevant books with the statement ”the users who bought this book also bought that book”.
In the collaborative filtering methodology, information regarding contents is not required because the system relies on the item ratings of users. Recommen-dations are made taking into account the similarities between user ratings.
CHAPTER 2. LITERATURE REVIEW 6
2.3
Trust Based Systems
Collaborative filtering recommendation strategy assumes that if the ratings sub-mitted by a group of users are similar, their interests will also be similar for other items. However, the similarities between individuals’ tastes differ according to the fields of interest. As a result, not all people will be reliable for all categories, although all will be reliable for some categories.
According to the approach proposed by O’Donovan, the reliability of collab-orators should also be considered in the recommendation process [20]. This ap-proach considers that user similarities in themselves are not a sufficient basis for making accurate suggestions, but that users should also have similar preferences and they should be considered trustworthy in order to make reliable recommen-dations.
According to Abdul-Rahman et al. [13], the concept of trust is defined in two categories: Context-specific interpersonal trust describes the trust of a user for a specific situation. In this kind of trust systems, if a user trusts another user under a certain condition, it does not necessarily mean he/she trusts the same user under a different condition. The second type of trust is system/impersonal trust, which defines the trust level of a user for the whole system.
Epinions [4] is one of the web-sites which include the trust level of evaluators in their system. The web-site is used to sell goods, and collaborators are allowed to write reviews about items. The system evaluates the reviewers and classifies them according to their trust level. In the suggestion process, both the feedback and the reliability of the reviewer are considered.
2.4
Information Quality
Information quality is a measurement mechanism used to define the quality of content items in the information systems. This mechanism was firstly introduced for applications such as databases and management information systems [17]. In
CHAPTER 2. LITERATURE REVIEW 7
respect of this study, information quality is defined as the effectiveness of systems and subsystems in relation to the operational goals.
Wang et al. discuss the negative social and economic impacts of poor data quality and put forward the idea that data consumers have a wider perspective of the conceptualization of data quality as compared to information system pro-fessionals [27].
The measurement of the data quality on the web is also important because the internet holds great amounts of information [19]. The study by Moraga et al. represents the attributes which are considered relevant for the assessment of data quality in Web portals.
A recently accepted approach regarding the assessment of information quality considers the users point of view. Strong et al. suggest that the data quality cannot be determined independent of the data users [26].
Rieh [24] examines the problem of judgment of information quality and cog-nitive authority by considering web searching behavior. According to this study, those using the information have to evaluate its quality for themselves. The sys-tem creates a subjective environment for each user and the quality perception of an individual user has a little or no effect on the other users.
2.5
A Bayesian Approach for Small Information
Trust Updates
As mentioned in Chapter 1, Schaal defined a reputation model for the source of the information in order to determine the quality of the contents on the web. The aim of this model is to assess the quality of the content items and the reputation of the item sources by considering the user feedbacks over time.
Two types of actors are defined in this approach, information providers and voters. The voters are the users who create feedback to evaluate the items.
CHAPTER 2. LITERATURE REVIEW 8
According to the model, a content item can be evaluated after its activation time span on a binary scale as either correct or wrong. Voting on the item begins after the start of the activation time and the process concludes at the end of the activation time span. A voter has an option not to rate a particular content item. In this system, the providers and voters have a value of trust between 0 and 1. The trust values changes throughout time. According to the initial theory, each trust value is 0.5 upon creation. A provider who has a high trust value provides correct items, and a provider who has a low trust value provides wrong items respectively. A voter whose trust value is high submits correct votes and a voter whose trust value is low submits wrong votes. Voters with high trust values have an enormous influence on the trust value of a provider. The trust value of a voter will decrease if he submits a vote against the actual trust value of a provider, similarly if a voter submits a vote in favor, his trust value will increase.
In this work, a Bayesian approach is used to assess the change in trust values of voters and providers according to time, because this is considered a well-designed model for the update of knowledge about voters and providers after each voting event.
Chapter 3
Co-Evaluation of Content and
User Qualities
3.1
Model
Trust based recommender systems generally use implicit or explicit user feedbacks to evaluate only the quality of the contents on the web. Our model is based on the previous studies of Schaal which is mentioned in Section 2.4. The aim of the model is not only to assess the quality of the content items, but also the quality of the users. We define the quality of the users as their ability to make correct evaluations. Trustworthiness and expertise are some of the attributes which helps users to do right judgments.
In order to determine the content and user qualities, we consider the following elements in our system:
• a set of content items C • a set of source channels S • a set of evaluators E • a set of feedbacks F
CHAPTER 3. CO-EVALUATION OF CONTENT AND USER QUALITIES10
Figure 3.1: The Relations between the Elements of the System
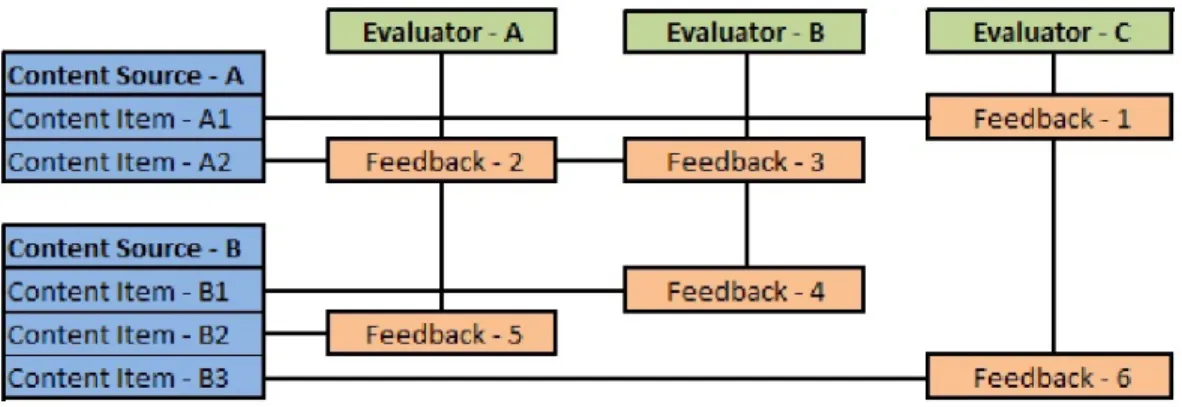
In Figure 3.1, we see the relations between the elements of our system. In the system, each content item (cn∈ C) is a target which is created by a content
provider. The versions of the articles in Wikipedia, blog entries in blog spaces, and the contents (videos, notes, images, etc.) added by the collaborators in social networks are some of the examples of the content items.
A source channel (content source) (sn ∈ S) is the source of a content item.
It can be defined as an element whose quality is correlated with the quality of an individual content item. In the system, the source channels are used in order to group the content items. For each content item cn, there is only one source
channel sn. However, one source channel can be associated with multiple content
items. A blog space is one of the examples of the source channels. In order to determine the quality of a blog space, the individual blog entries should be considered.
In our system, the role of an evaluator (en) is to provide feedbacks. A feedback
hold the information about the content item (cn), the evaluator (en), the value,
CHAPTER 3. CO-EVALUATION OF CONTENT AND USER QUALITIES11
3.2
User Feedback
The main input of our system is user feedbacks which contains the following information:
• Content item • Evaluator • Value
• Submission time
The model is built on the idea that a feedback holds the information about both a content item and an evaluator, so it can be used to assess the qualities of them. Since the information of the submission time is also available, the change in these qualities can also be observed in timeline. For each feedback, the system updates both the quality of the evaluator and the quality of the source of the content item.
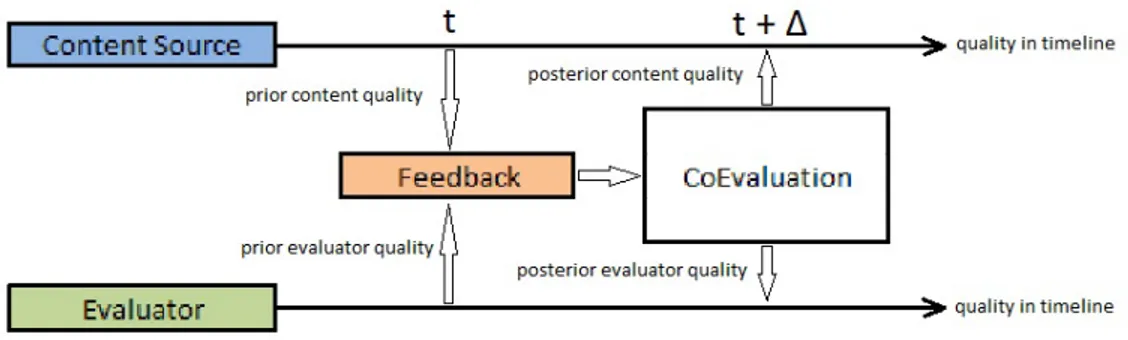
Figure 3.2: Co-Evaluation of Content and Evaluator Qualities
In Figure 3.2, we see the process of co-evaluation for a content source and an evaluator. Here, a feedback is submitted by an evaluator to one of the content items which belongs to a specific content source in time t. Our method uses the feedback feedback and the prior quality values of content source and evaluator in
CHAPTER 3. CO-EVALUATION OF CONTENT AND USER QUALITIES12
order to calculate the posterior quality values of them. The posterior values are stored ∆ time later than the time in which prior values are received. The value of ∆ is defined as update frequency of our online processing methodology.
3.3
Bayesian Reasoning
In order to determine the qualities, we use a Bayesian approach. The approach is built based on the studies [14] of Thomas Bayes. By using these studies, Jensen and Nielsen introduced the concept of Bayesian networks and decision graphs [18] which are the graphical models of the approach. A Bayesian network is a directed acyclic graph which represents a set of variables and their conditional dependencies. Nodes of Bayesian networks represent the variables and edges represent conditional dependencies.
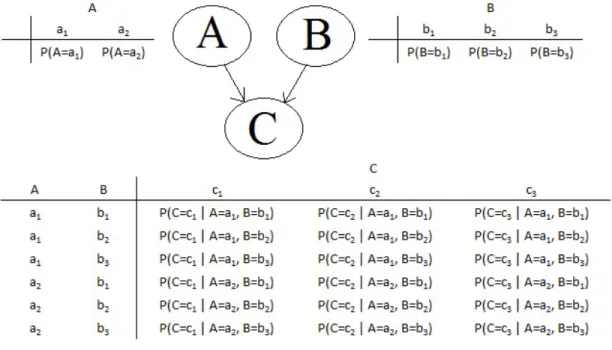
Figure 3.3: An example of a Bayesian Network
In order to make the concepts clear, we give an example of a Bayesian network which is presented in figure 3.3. The nodes A, B, and C represent the variables and the arrows show that there are conditional dependencies between the variables
CHAPTER 3. CO-EVALUATION OF CONTENT AND USER QUALITIES13
A − C and B − C. The variables A and B are called the parent variables of C. The values of each variable and their probabilities are associated with the variable. According to the figure, the variable A has two values (a1, a2), and
the variables B, and C have three values (b1, b2, b3 and c1, c2, c3 respectively) for
each. The probabilities of these values (probability distribution) are given below the values of each variable. P (V ariable = valuen) represent the probability of
V ariable being valuen. For the variable C, the probabilities take two inputs (one
for each variable) which are used to represent the conditions. The conditions are the possible combinations of the values of the parent variables. Since we have two values for the variable A and three values for the variable B, we have six conditions for each value of the variable C.
Bayesian networks can be used to calculate the updated knowledge of the val-ues of the variables by using the observation of the other variables. For example, if we have a knowledge about the value of the variable C, we can calculate the updated probability distributions of the other variables by considering the prior probability distributions of them and the conditional probability values of the variable C.
Figure 3.4: Structure of the Bayesian Network
The aim of our methodology is to assess the quality level of evaluators and content sources by considering the values of feedbacks. The basic structure of the Bayesian network which we use in our model is presented in Figure 3.4. The network contains three variables which represent quality of an evaluator, quality of a content source, and a feedback. The values of the variables for an evaluator and content can be varied according to the application. However, they should be orderable in the sense of quality. The values of a feedback variable are determined according to the data set. They should be same as the values of the feedbacks in the data set.
CHAPTER 3. CO-EVALUATION OF CONTENT AND USER QUALITIES14
Since the value of a feedback is conditionally dependent on the quality level of the relevant evaluator and content, the relations are represented by the arrows between the corresponding variables.
In the system, the information about the value of a feedback (observed vari-able) is available, so it can be used to calculate the quality level of evaluators and content sources (target variables). Prior probability values of the target variables, conditional probability values of the feedback variable, and the observed value of the feedback are considered in this calculation. The prior probability values represent the distribution of evaluators and content sources according to the qual-ity level. For example, we consider two values (high and low) for the evaluator quality variable. If the numbers of high and low quality evaluators are assumed to be equal, the prior probabilities are uniformly distributed to the values high and low (0.5 for each).
As feedbacks are processed, posterior probability values are calculated by using the prior probabilities. The posterior probabilities which are inferred for a target (evaluator or content) by using a Bayesian network are considered as prior probability values of the same target in different network which is created later.
The conditional probabilities of the feedback variable are determined accord-ing to the values of the target variables. For a high quality content source, the value of the feedback is most likely high. The value of the feedback is proba-bly low for a low quality content source. Since the high quality evaluators are able to make accurate judgments, the variances of the conditional probability distributions are low. However, the variances are high for low quality evaluators.
3.4
Software Module
In this section, we explain the details about the software module of our system. Since our aim is to apply the methodology to various fields, design of a config-urable software system is needed.
CHAPTER 3. CO-EVALUATION OF CONTENT AND USER QUALITIES15
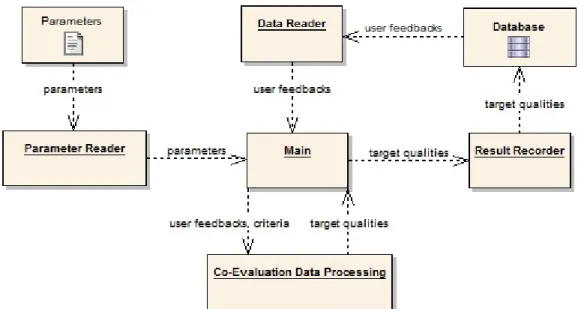
Figure 3.5: System Architecture
Our system gets the relevant data from database, processes them, and stores the calculated quality values to the corresponding table. Figure 3.5 presents the system architecture. The system consists of five main components:
• Parameter Reader • Data Reader • Main
• Co-Evaluation Data Processing • Result Recorder
In order to make the software flexible, the parameters which are necessary to apply the methodology are stored in a text file. Parameter Reader is implemented to read the parameters which are used to connect to the relevant database (user, password, database), associate the table columns with the variables, add the variables (name, values) and define the conditional probabilities.
CHAPTER 3. CO-EVALUATION OF CONTENT AND USER QUALITIES16
Data Reader is implemented in order to obtain relevant data from database. It is used to retrieve feedbacks and their corresponding evaluators (users) and content items.
Main is responsible for the communication between the components. Firstly, it gets the parameters and use them in order to connect database and retrieve user feedbacks. After that, the feedbacks and criteria are sent to Co-Evaluation Data Processing and the qualities of users and content sources (targets) are collected at the end of the process. Finally, results are sent to Result Recorder.
Result Recorder is used in order to store the qualities of target variables to the database. Each result has the information about variable, target (unique identifier of evaluator or content), time, value, and probability.
Co-Evaluation Data Processing is responsible for processing the data. It pro-cess user feedbacks in order to calculate target qualities.
As we mentioned before, the software can be applied to various fields. For each field, it should be possible to run the software by defining different sets of criteria. In our system, each performance of the software is defined as a case. In order to distinguish the outcome of each case, the results are stored with their corresponding case id.
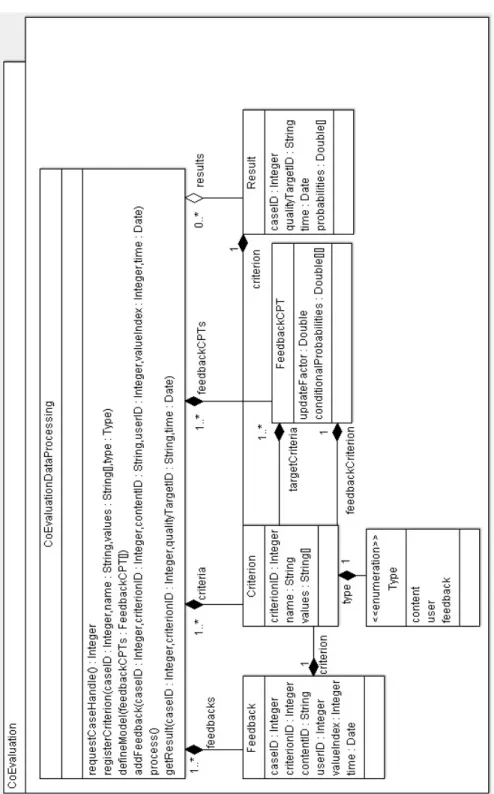
Figure 3.6 presents the class diagram of the application programming interface (API) of Co-Evaluation Data Processing. The main component of the API is CoEvaluationDataProcessing class. The class is used as follows:
• A case is setup by the method requestCaseHandle().
• Criteria are defined by the methods registerCriterion(...) and de-fineModel(...).
• A feedback is added by addFeedback(...). • Feedbacks are processed by process(). • Results are collected by getResult(...).
CHAPTER 3. CO-EVALUATION OF CONTENT AND USER QUALITIES17
CHAPTER 3. CO-EVALUATION OF CONTENT AND USER QUALITIES18
The roles of the methods are explained below:
• requestCaseHandle() : Integer - Creates new case and returns the case ID
• registerCriterion(caseID : Integer, name : String, values : String[], type : Type) - Registers new criterion with specified name value and type to a given case
• defineModel(feedbackCPTs : FeedbackCPT[]) - Defines a model which includes a set of CPTs (conditional probability tables) for given feed-back and target criteria.
• addFeedback(caseID : Integer, criterionID : Integer, contentID : String, userID : Integer, valueIndex : Integer, time : Date) - Adds a feedback which has specified content, user, value and time to the given case and criterion
• process() - Processes all respective data submitted by addFeedback(...) • getResult(caseID : Integer, criterionID : Integer, qualityTargetID
: String, time : Date) - Returns result for a particular case, quality target, criterion, and time
The method process() uses feedbacks and calculates quality values of contents and users with respect to specified criteria and model. The details of the method is presented in Algorithm 1. The system iterates over all of the feedbacks and builds a Bayesian network for each content item. After previously defined amount of time passes, inference is done for parent variables by considering the value of the feedbacks, prior probability distributions of the target variables and conditional probabilities between the variables. Then the system stores the result for the current time and removes the relevant Bayesian network. The probabilities which are calculated in this step are used as prior probabilities for the next steps. At the end, we have probability distributions of both content sources and users for different time points.
CHAPTER 3. CO-EVALUATION OF CONTENT AND USER QUALITIES19
Algorithm 1 Co-Evaluation Data Processing Input: feedbacks F eedbacks, time period create variable N etworks
for each f eedback in F eedbacks do content = f eedbackcontent
user = f eedbackuser
value = f eedbackvalue
time = f eedbacktime
inserted = f alse
for each network in N etworks do if content is in network then
add variable vuser to network
add variable vf eedback to network
assign probability values of the variables vuser, and vf eedback
add observation vf eedback = value
inserted = true end if
if time − networkcreationtime> period then
for each variable in network do
if variabletype =0 content0 or variabletype=0 user0 then
calculate posterior probabilities of variable record probabilities of variable
end if end for
remove network from N etworks end if
end for
if inserted = f alse then
create a Bayesian network network assign networkcreationtime = time
add variable vcontent to network
add variable vuser to network
add variable vf eedback to network
assign probability values of the variables vcontent, vuser, and vf eedback
add observation vf eedback = value
add network to N etworks end if
CHAPTER 3. CO-EVALUATION OF CONTENT AND USER QUALITIES20
In Co-Evaluation API, there are also sub-components for defining criterion, feedback, conditional probability table, and result. The class Criterion is used to define feedback, user, and content variables and has the attributes criterionID, name, values, and type. The attribute criterionID specifies unique id of the criterion. The name of the variable is represented by name attribute. The values of the variable are stored in the attribute of values. The attribute type represents whether the variable is in type content, user, or feedback. The enumeration Type is also created because of this purpose.
The second class Feedback is used to represent the attributes of a feedback. A feedback keeps the information about content, user, value, and time which are identified by the attributes contentID, userID, valueIndex, and time respectively. The attribute criterionID is used in order to associate the feedback with relevant variable.
The information about a conditional probability table is kept by the class Feed-backCPT. The attributes feedbackCriterion, and targetCriteria represent feedback and target (user and content) variables for which the conditional probability table is generated. In our approach, we do not use posterior probability values, which are obtained as outputs of Bayesian networks, directly. These values affects the general quality by some rate which is defined by updateFactor. The calculation of general quality can be seen in Equation 3.1.
P(Quality) = Pprior(Quality)×(1−updateF actor)+Pposterior(Quality)×updateF actor
(3.1) The last attribute conditionalProbabilities holds the conditional probabilities in a matrix in the following format:
P (f v1|cv1, uv1) P (f v1|cv1, uv2) ... P (f v1|cv2, uv1) P (f v1|cv2, uv2) ... P (f v2|cv1, uv1) P (f v2|cv1, uv2) ... P (f v2|cv2, uv1) P (f v2|cv2, uv2) ... ... ... ... ... ... ...
f vn, cvn, and uvn denote the nth values of feedback, content, and user
vari-ables respectively. If the number of the values are f (for feedback variable), c (for content variable), and u (for user variable), the column and row numbers of the
CHAPTER 3. CO-EVALUATION OF CONTENT AND USER QUALITIES21
matrix will be c × u and f respectively.
Result class is used to store the values of the user or content qualities respec-tively for different times. It holds the information about the case ID (caseID ), the user or content variable (criterion), the description of content source or user (qualityTargetID), the record time (time), and the probability values (probabili-ties).
Chapter 4
Experiments
In this chapter, the details about experiments are explained. There are two main aims of the experiments:
• Assessing the content and user qualities • Demonstrating the feasibility of the approach
In order to perform experiments, the MovieLens data set [10] is used. The data set consists of ratings submitted for movies. A rating also has the information about its evaluator, value, and submission time which are essential inputs of our methodology. The main advantage of the data set is that it includes 10M ratings which are submitted between the years 1996 and 2009. Since many ratings are given in wide range of time, we will have considerable number of results to observe the change in qualities over time.
We performed four types of experiments in order to assess the qualities of movies and evaluators.
• Experiment 1: Co-Evaluation USER EXPERTISE/ DIRECTOR QUALITY: In this experiment, we assume that the quality level of a movie is similar to the quality level of its director, so we define directors of
CHAPTER 4. EXPERIMENTS 23
movies as their source channel. We also assume that the expertise of a user affects the ability of him / her to rate the quality of movies correctly. For this experiment, we use a Bayesian network whose variables represent the quality of a movie director and the expertise of a user.
• Experiment 2: Extension GENRE-Related EXPERTISE/ DI-RECTOR QUALITY: As an extension of the first experiment, we define the expertise of a user as a function of a genre, because high experience of a user in a genre does not mean that the user is also an expert in another genre. For this experiment, the variables of a Bayesian network represent the quality of a director and the genre-expertise of a user.
• Experiment 3: Co-Evaluation USER EXPERTISE/ MOVIE QUALITY: In this experiment, we changed the first assumption of the first experiment. A movie data set may not be suitable for the idea of source channel, so we ignore directors. Instead of a director, each movie is its source channel in this experiment. The assumption about users is the same as the assumption in the first experiment, so the variables of a Bayesian network represent the quality of a movie and the expertise of a user.
• Experiment 4: Extension GENRE-Related EXPERTISE/ MOVIE QUALITY: This is the extension of the third experiment, and the genre-expertise of a user is used instead of the general expertise.
In order to demonstrate the feasibility of our methodology, we compare the performance of the methodology with a classical approach. Since IMDb [8] is considered to be most reliable system in evaluating movies, top movies in IMDb is chosen as a gold standard for high quality movies. Precisions of two approaches are measured in order to compare the performances of them.
CHAPTER 4. EXPERIMENTS 24
4.1
Experimental Setup
4.1.1
Data Set
As it is mentioned at the beginning of the chapter, we choose the MovieLens data set which contains the ratings of the movies. The data set has the following data:
• 10M ratings
• submitted by 71567 users • for 10681 movies
We consider two files ratings.dat and movies.dat in our experiments. The struc-tures of the files are explained below.
4.1.1.1 Ratings
Each line of the file holds the information about a rating value of a movie sub-mitted by a user and has the following format:
UserID::MovieID::Rating::Timestamp
Ratings are submitted on a 5-star scale, with half-star increments.
This file supplies user feedbacks which have the information about users, con-tent items, values, and times for our system.
4.1.1.2 Movies
The file keeps the information about movie titles, and genres of a movie and has the following format:
CHAPTER 4. EXPERIMENTS 25
In order to provide the information about source channels for our experiments, we associate the MovieID values with the IDs of the movies in IMDb. The association allows us to gather the information about directors, writers, and stars of the movies.
Genres column represents the genres from the set {Action, Adventure, Ani-mation, Children’s, Comedy, Crime, Documentary, Drama, Fantasy, Film-Noir, Horror, Musical, Mystery, Romance, Sci-Fi, Thriller, War, and Western}.
4.1.2
Experimental Parameters
In this part, we determine the values of some parameters for each experiment. These parameters are the variables of the Bayesian network, their values, prior probabilities of the values, conditional dependencies between the variables, up-date factor, lifetime of Bayesian networks, and source channel.
4.1.2.1 Variables
For each experiment, we define three variables for content-sources, users, and feedbacks.
As we mentioned in Section 3.3, the features of a feedback variable are deter-mined according to the data set. The values of the feedback variable should be the same as the rating values in MovieLens.
• Rating: The variable represents the value of a rating. The values of this variable are 1 star, 1.5 star, 2 star, 2.5 star, 3 star, 3.5 star, 4 star, 4.5 star, and 5 star which are the same as the values in MovieLens data set.
We define the remaining two variables for each experiment below. Since the computational complexity of inference is high, we limit the number of the values to three for each variable.
CHAPTER 4. EXPERIMENTS 26
• Co-Evaluation USER EXPERTISE/ DIRECTOR QUALITY: – M ovieDirectorQuality: Since we try to find out whether the
qual-ity of a movie is similar with the qualqual-ity of its director, the variable represents the director quality which is the source channel of the cor-responding movies. The values of the variable are low, average and high.
– U serExperience: The variable shows the experience level of a user. Its values are novice, intermediate, and expert.
• Extension GENRE-Related EXPERTISE/ DIRECTOR QUAL-ITY:
– M ovieDirectorQuality: The variable and its values are same as the director quality variable and its values in the first experiment.
– U ser(Genren)Experience: Multiple variables are defined in order to
represent the expertise of a user for a specific genre. The names of the variables are determined according to the genre (e.g. UserComedyEx-perience, UserDramaExUserComedyEx-perience, etc.). The values of the variables are novice, intermediate, and expert.
• Co-Evaluation USER EXPERTISE/ MOVIE QUALITY:
– M ovieQuality: The variable represents quality of a movie because each movie is its source channel. The values of the variable are low, average and high.
– U serExperience: As in the first experiment, this variable shows the experience level of a user. Its values are novice, intermediate, and expert.
• Extension GENRE-Related EXPERTISE/ MOVIE QUALITY: – M ovieQuality: The variable and its values are the same as the movie
CHAPTER 4. EXPERIMENTS 27
– U ser(Genren)Experience: As in the third experiment, there are
mul-tiple variables in order to define the expertise level of a user for a genre. The values of the variables are novice, intermediate, and expert.
4.1.2.2 Probability Table
The probability tables represent the conditional probabilities between the vari-ables in a Bayesian network. According to our initial theory, one Bayesian network is created for one content item. In the first and third experiments, one Bayesian network is for each movie. However, in the genre extensions of the experiments, we try to calculate the genre expertise of the users. If a movie has multiple genres, we create a Bayesian network for each movie-genre pair.
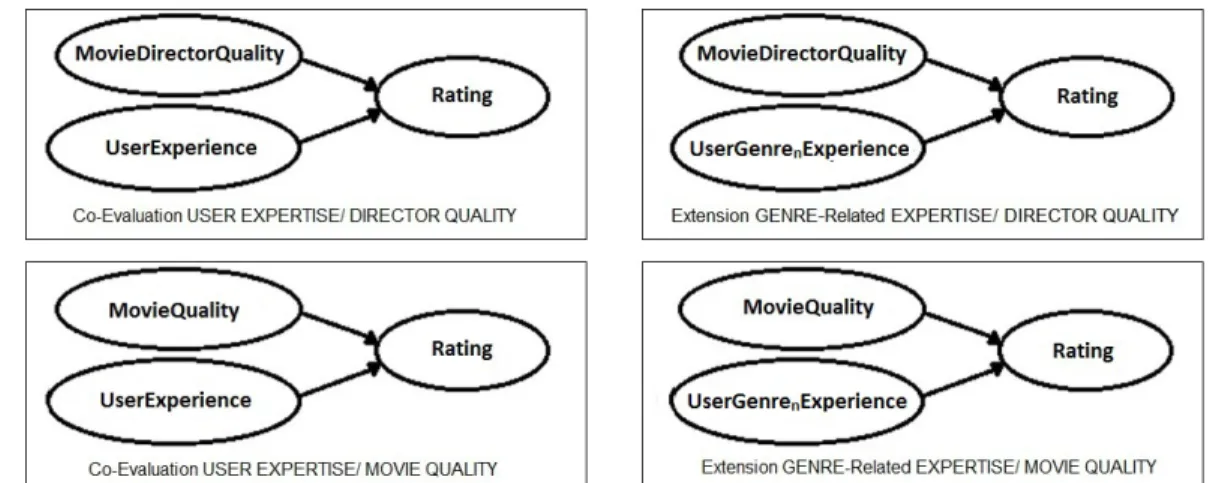
Figure 4.1 shows the dependencies between the variables in each experiment. According to the figure, a rating value (Rating) is dependent on the quality of a movie (M ovieQuality) or a director (M ovieDirectorQuality) and general (U serExperience) or genre (U ser(Genren)Experience) experience of a user.
Genren represents one of the genres of the corresponding movie.
Figure 4.1: Structure of the Bayesian Networks in the experiments
The way of determining the conditional probabilities is explained in Sec-tion 3.3. According to that, expert users give ratings most accurately, the variance of the probability distribution is low for them. The ratings of novice users are
CHAPTER 4. EXPERIMENTS 28
distributed in wide range which means the variance of the probability distribution is high.
We determined a set of conditional probabilities by using the way which is de-scribed above. In order to increase the performance of classifying users according to their expertise level, we create another set of conditional probability values by considering the behaviors of users in different conditions. Since the second set gives better results, we use it in the experiments.
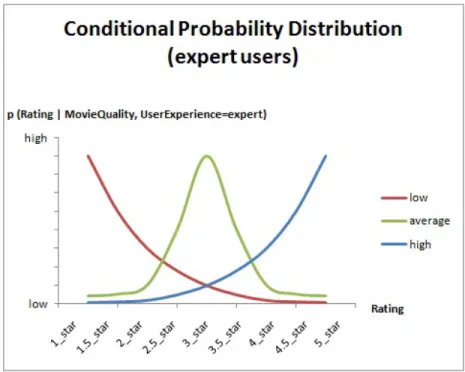
Figure 4.2: Conditional Probability Distribution Functions for Expert Users In order to model the behaviors of users, we assume that there are two factors which affect the decision of a user about a movie.
• Understanding of users • Expectation of users
Understanding of users is about whether the users are able to understand movies and the expectation is that how much the users expect from a movie. Our first estimation is that the expert users can generally understand movies, and they
CHAPTER 4. EXPERIMENTS 29
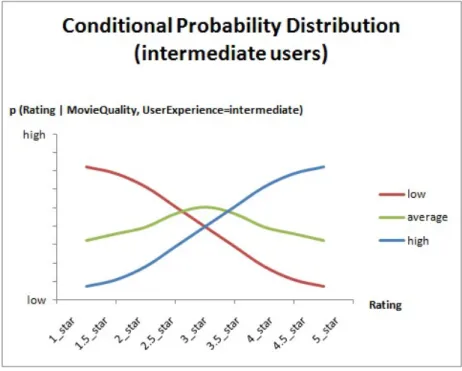
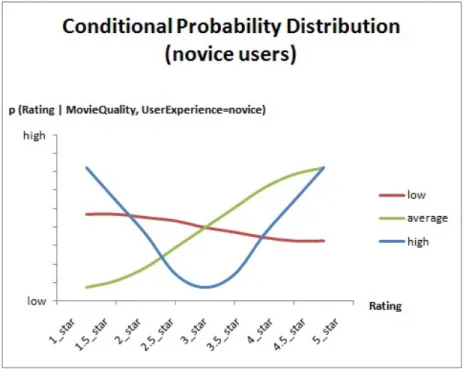
have high expectations. So they tend to give high ratings for the high quality movies, average ratings for the average quality movies, and low ratings for the low quality movies. The intermediate users can also understand movies, but it is not as much as the understanding of an expert. Their expectations are also lower than the expectations of the expert users. So they tend to give high and average values for the high quality movies; low, average, and high ratings for the average quality movies; and low and average ratings for the low quality movies. Our final assumption is that the novice users can often understand the low and average quality movies, and they can rarely understand the high quality movies. Their expectations are generally very low. Because of the low expectations of the novice users, they tend to give low, average, and high ratings for the low quality movies; and average and high ratings for the average quality movies. The novice users tend to give low and high ratings to the high quality movies, because we assume that they generally cannot understand them and give low rating, or they somehow understand the movie and give high ratings. Here, we also assume that they do not give average ratings to the high quality movies.
Figure 4.3: Conditional Probability Distribution Functions for Intermediate Users In order to determine the conditional probability values, we created prob-ability distribution functions by considering the criteria for different types
CHAPTER 4. EXPERIMENTS 30
of users and movies. Figure 4.2 presents the conditional probability dis-tribution function for expert users. The x-axis represents the values of the variable Rating and the legends represent the values of the variable M ovieQuality. The y-axis of the chart represents the conditional probabil-ity value p(Rating|M ovieQualprobabil-ity, U serExperience = expert) which means the probability distribution of rating values for different quality level of movies and expert users. For example, red line represents the probability distribution of Rating when M ovieQuality is low and U serExperience is expert. According to the distribution, the expert users tend to give low ratings for the low quality movies as we mentioned before. Figure 4.3 and Figure 4.4 present the conditional probability distributions for intermediate and novice users respectively.
Figure 4.4: Conditional Probability Distribution Functions for Novice Users By using the probability distribution functions, we determine conditional probability values for each condition. Table 4.1 represents the conditional proba-bility values of a rating for different user and movie types. The first two columns of the table represent the conditions (values of the variables M ovieQuality or M ovieDirectorQuality and U serExperience or U serGenrenExperience
respec-tively), and the other columns shows the probability distribution of Rating under these conditions.
CHAPTER 4. EXPERIMENTS 31
M Q1 U E2
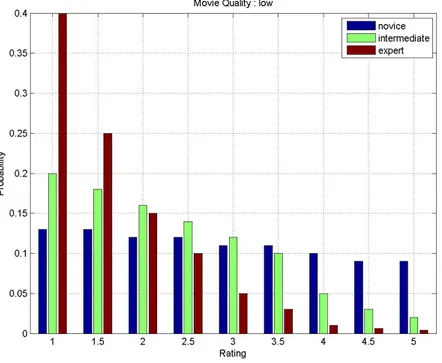
1 star 1.5 star 2 star 2.5 star 3 star 3.5 star 4 star 4.5 star 5 star low nov 0.130 0.130 0.120 0.120 0.110 0.110 0.100 0.090 0.090 low int 0.200 0.180 0.160 0.140 0.120 0.100 0.050 0.030 0.020 low exp 0.400 0.250 0.150 0.100 0.050 0.030 0.010 0.006 0.004 avg nov 0.020 0.030 0.050 0.100 0.120 0.140 0.160 0.180 0.200 avg int 0.100 0.110 0.110 0.120 0.120 0.120 0.110 0.110 0.100 avg exp 0.020 0.030 0.050 0.200 0.400 0.200 0.050 0.030 0.020 high nov 0.200 0.150 0.100 0.040 0.020 0.040 0.100 0.150 0.200 high int 0.020 0.030 0.050 0.100 0.120 0.140 0.160 0.180 0.200 high exp 0.004 0.006 0.010 0.030 0.050 0.100 0.150 0.250 0.400 1M ovie/DirectorQuality 2U ser/Genre nExperience
Table 4.1: Conditional probability distribution values
Figure 4.5: Conditional probability distribution (low quality movie/director) Fig. 4.5, Fig. 4.6, and Fig. 4.7 represent the probability distribution charts of the ratings when the movie/director quality is low, average, and high respectively. The x-axis shows us the feedback values and the y-axis represents the probability of these values under the specified conditions. The chart legends novice, inter-mediate, and expert are the experience level of a user.
CHAPTER 4. EXPERIMENTS 32
Figure 4.6: Conditional probability distribution (average quality movie/director)
CHAPTER 4. EXPERIMENTS 33
4.1.2.3 Lifetime of Bayesian Networks
As we mentioned in Chapter 3, feedbacks are processed and one Bayesian network is created for each content item. After some amount of time passes, inference is done for parent variables and the relevant network is removed from the set. In this section, we determine the amount of time which is used as lifetime of Bayesian networks. Because of the computational limitation of Bayesian inference, we limit the maximum number of the target variables (user and content) in a network to ten.
In experiments, since our system creates one network for each movie, we analyze the number of the ratings submitted for a movie in a specific length of time. In Table 4.2, we see the information about how many ratings are submitted for how many movies in one month period.
Number of the Ratings Number of the Movies
1 - 10 8477 11 - 20 937 21 - 30 396 31 - 40 191 41 - 50 130 51 - 60 103 61 - 70 62 71 - 80 38 81 - 90 39 91 - ... 25
Table 4.2: Number of Movies Grouped by Monthly Ratings According to the table, less than or equal to ten ratings are submitted for 81% of movies in a month. So one month-length period is suitable for the experiments. For the remaining 19% of movies, we define a threshold value of ten variables.
CHAPTER 4. EXPERIMENTS 34
4.1.3
Description of the Experiments
In the experiments, we split the data set and use randomly selected 8M of them to assess user and content qualities. Since the expert users have the ability to make correct judgments, their ratings should be more predictable if we know the correct qualities of movies. In order to evaluate the ability of our system to identify expert users, we use the remaining 2M ratings and try to predict the values of them. For each prediction, we calculate an error value by taking the difference between the actual and predicted values. If we can assess movie qualities correctly, low error values for expert users means that our system is also good at classifying users according to their expertise level.
4.1.3.1 Co-Evaluation USER EXPERTISE/ DIRECTOR QUALITY
In this experiment, we find the quality values of the variables M ovieDirectorQuality and U serExperience for different times. In order to predict the value of a rating, we firstly check the time of the rating, and then take the probabilities of target variable values which are recorded most recently in the past time. If there is no such record, then we skip the rating. After we get the probabilities of the tar-get variable values, we calculate the distribution of the rating by considering the conditional probability table which is defined before. Since we need a single value for prediction, we calculate the mean, median, and maximum likelihood of the distribution. An error value is recorded for each prediction type. Since we have to pick the value from the set {1, 1.5, 2, 2.5, 3, 3.5, 4, 4.5, 5}, we take the value which is closest to the calculated mean, median, or maximum likelihood respec-tively. The mean of a distribution is calculated by Equation 4.1. The values of a rating are {1, 1.5 ... 4.5, 5} and P (Rating = value) represents the probability of Rating being value.
mean = X
value∈Rating
(P (Rating = value) × value) (4.1) The median of a distribution is value which satisfies the condition in Equation 4.2.
P (X ≤ median) ≥ 1
CHAPTER 4. EXPERIMENTS 35
The maximum likelihood is the value whose probability value P (Rating = value) is the maximum.
4.1.3.2 Extension GENRE-Related EXPERTISE/ DIRECTOR QUAL-ITY
The main difference between this and the first experiment is that we calculate the expertise value of a user for each genre. In order to decrease the compu-tational time, we decide to choose a subset of the genres which are represented in Section 4.1.1. First of all, we analyze the numbers of the movies which are associated with the genres. For each genre, we also calculate the number of the movies which are only related with that genre.
Genre Number of All Movies Number of Movies (only specified genre)
ACTION 1485 79 Adventure 1004 32 Animation 376 3 Children’s 524 4 COMEDY 3654 1035 Crime 1104 25 DOCUMENTARY 457 346 DRAMA 5277 1770 Fantasy 531 1 Film-Noir 147 12 HORROR 1000 260 Musical 433 26 Mystery 502 6 Romance 1656 37 Sci-Fi 743 53 Thriller 1683 126 War 495 18 Western 270 91
Table 4.3: Number of Movies Grouped by Genres
CHAPTER 4. EXPERIMENTS 36
have greatest numbers in third column. In order to lose less movies, we have to choose these four genres. The fifth genre which has the greatest value in third column is thriller. Since this genre is similar to the genre horror (the number of common movies for these genres is high), we skip it and take the genre action in order to distinguish the genres better.
In the quality assessment part, we create a Bayesian Network for each movie-genre pair. Since most of the movies have more than one movie-genre, we generally have multiple networks for them. At the end, we have the quality values for directors and user-genre pairs. In the prediction part, if a movie has more than one genre, we do the prediction and error calculation steps - which are explained in the first experiment - for each genre.
4.1.3.3 Co-Evaluation USER EXPERTISE/ MOVIE QUALITY
This experiment is very similar to the first experiment. Here, we use the variable M ovieQuality instead of M ovieDirectorQuality.
4.1.3.4 Extension GENRE-Related EXPERTISE/ MOVIE QUAL-ITY
The description of this experiment is similar to the description of the second experiment. However, the quality of a movie is considered instead of the quality of a director.
4.2
Experimental Results
In this section, we present the results in order to evaluate the feasibility of our approach and the ability of the system to identify expert users. In the first part, we compare our system with a classical approach in order to measure the success of assessing movie qualities. If our system succeeds in determining movie
CHAPTER 4. EXPERIMENTS 37
qualities, we evaluate the performance of the prediction according to expertise level of users. Since the experts are good at evaluating movies, more successful prediction for experts means that we are able to classify the users according to their expertise level.
4.2.1
Comparison with Classical Approach
In order to check whether our co-evaluation approach makes improvement on the classical approach, we evaluate the performance of them by using the data in IMDb. We consider the list of top 250 movies in IMDb [9] as gold standard for the high quality movies. After we associate the movies in IMDb and MovieLens, we have 228 top quality movies because some of the movies are not included in MovieLens.
In order to start evaluation, we ordered the movies according to the quality values which are obtained as an output of co-evaluation software. We configured the software with the same parameters which are used in experiment 3. After that, we take the first 228 movies and the movies which have the same quality values with the 228th. Finally we calculate the precision, recall, and F-measure values which are calculated by the equations below.
precision = |{T opM ovies}
T{RetrievedM ovies}|
|{RetrievedM ovies}| (4.3) recall = |{T opM ovies}
T{RetrievedM ovies}|
|{T opM ovies}| (4.4) F = 2precision × recall
precision + recall (4.5) As a classical approach, we calculate the quality value of a movie by taking the average of the ratings which are submitted for the relevant movie. After that, we ordered the movies according to the average rating values. As we did in our approach, we take the best 228 movies and the movies which have the same average rating values with the 228th.
CHAPTER 4. EXPERIMENTS 38
In MovieLens data set, some of the movies have very low number of ratings, so the reason of the difference between the performance of our approach and the classical approach can be because of both of the learning power of Bayesian networks (the movies should be voted by many users in order to be determined as high quality if Bayesian approach is used) and the concept of co-evaluation (trust of the user is also included in process). In order to observe the effect of co-evaluation, we filtered the movies and take those which have at least 1000 ratings and apply classical approach for them. Decrease or increase in the threshold value (1000) causes a decrease in precision.
Classical Classical with Filter Co-Evaluation Precision 0.4912 0.5482 0.6214
Recall 0.4912 0.5482 0.6623 F-measure 0.2456 0.2741 0.3206
Table 4.4: Precision, Recall and F-Measure Values per Approach The precision, recall, and F-measure values of three approaches are presented in Table 4.4. According to these values, Bayesian co-evaluation approach over-rides the classical approach although additional filtering is applied. These results prove that our system is good at assessing movie qualities.
4.2.2
Ability of the System to Identify Experts
In this section, we evaluate the ability of our system to classify expert users. In order to measure the performance of prediction, we group the users according to their expertise level and calculate average error values for each prediction type. The average error values are calculated by taking the averages of the prediction errors. At the beginning, we consider the correlation between the average errors and the user expertise at a given time. The expertise level of a user at a given time is calculated based on the values of UserExperience variable in time when the corresponding rating is given. We also calculate the expertise level of a user at the end in order to check whether our system identifies the experts better after processing all of the ratings. Since there is no major difference between those two
CHAPTER 4. EXPERIMENTS 39
types of results, we just present the charts for the expertise at given time. The value of expertise represents the general or genre experience according to the experiment. It is calculated by the following equation:
expertise = (P (intermediate) + 2 × P (expert))/2 (4.6) In the formula, P(intermediate)/P(expert) represents the probability that a user is intermediate/expert. The expertise value lies in the range [0,1].
The format of the data and the charts for each experiment are given below. The data which is used to draw charts are presented in Appendix A.
4.2.2.1 Co-Evaluation USER EXPERTISE/ DIRECTOR QUALITY • Validation
Timestamp::UserID::MovieID::MeanError::MedianError::MlError • User
Timestamp::UserID::Novice::Intermediate::Expert • Movie MovieID::DirectorID
Validation table holds the information about the success of the prediction of a rating submitted by a user (UserID ) for a movie (MovieID ). The columns Mean-Error, MedianMean-Error, and MlError represent the difference between the actual value and the estimated value which is found by mean, median, or maximum likelihood prediction respectively.
We create a user table in order to keep the information about the expertise level of users for different times. The table is used to calculate expertise values defined in Equation 4.6.
Movie table is created to associate a movie to its director because we consider directors as source channel of the movies in this experiment.
CHAPTER 4. EXPERIMENTS 40
Figure 4.8 shows the relation between the average error values and user ex-pertise. The y-axis represents the average error values and the x-axis repre-sents the expertise level of users. The legends show the average error values for different prediction types. Here, expertise is calculated based on the values of U serExperience variable in time when rating is given.
The data which is used to draw the chart is presented in Table A.1. The users are grouped according to their expertise values (0.00, 0.05, 0.10 ... 0.95, 1.00), and the numbers of the users per group are given in the fifth column of the table.
Figure 4.8: Change in Average Errors According to Expertise
According to the figure, we make better predictions for expert users in all type of prediction ways. In generally, median prediction performs better but after the expertise level 0.8, mean average error is the least. The graph also shows that maximum likelihood prediction performs worst for all of the expertise level.
CHAPTER 4. EXPERIMENTS 41
4.2.2.2 Extension GENRE-Related EXPERTISE/ DIRECTOR QUAL-ITY
Figure 4.9: Change in Mean Average Error According to Expertise
• Validation
Timestamp::UserID::Genre::MovieID::MeanError::MedianError::MlError • User
Timestamp::UserID::Genre::Novice::Intermediate::Expert • Movie MovieID::DirectorID
For this experiment, validation table keeps the information about the success of the prediction which is done based on genre-experiences instead of general expe-riences. Each prediction is recorded according to UserID, Genre, and MovieID
CHAPTER 4. EXPERIMENTS 42
information. The columns MeanError, MedianError, and MlError represent the error values as in the first experiment.
User table holds the information about the quality level of users according to genres for different times. The table is used to calculate expertise values defined in Equation 4.6 for each genre.
Movie table is created for the same purpose with the first experiment.
Figure 4.10: Change in Median Average Error According to Expertise Figures 4.9, 4.10, and 4.11 show the relation between the mean / median / maximum likelihood average errors and expertise. Here, the order of successes of prediction types is the same as the order in the previous experiment. The performance of the prediction for the genres action, comedy and horror are almost similar. However, the success of the prediction for drama movies is lower for the maximum likelihood prediction and novice users. It means that a user should be more expert in order to make accurate decision about the drama movies. If
CHAPTER 4. EXPERIMENTS 43
Figure 4.11: Change in Maximum Likelihood Average Error According to Exper-tise
we consider the documentary movies, we come to the similar conclusion with the drama movies. For the median prediction - whose accuracy is the highest - the performance is better for the documentary movies and the expert users. It means that the experts in this area have the ability to make more correct judgments. The reason of rises and falls in the curves for documentary is that the number of the ratings given to this type of movies is not adequately high.
4.2.2.3 Co-Evaluation USER EXPERTISE/ MOVIE QUALITY • Validation
Timestamp::UserID::MovieID::MeanError::MedianError::MlError • User
CHAPTER 4. EXPERIMENTS 44
In this experiment, the format of the result data is almost similar to the format in the first experiment, but we do not have a movie table because movies are source channels instead of directors.
Figure 4.12 presents the change in average error values with respect to the expertise level of the users. The results are similar with the results in the first experiment.
Figure 4.12: Change in Average Errors According to Expertise
4.2.2.4 Extension GENRE-Related EXPERTISE/ MOVIE QUAL-ITY
• Validation
Timestamp::UserID::Genre::MovieID::MeanError::MedianError::MlError • User
CHAPTER 4. EXPERIMENTS 45
Timestamp::UserID::Genre::Novice::Intermediate::Expert
The format of the data is like the format in the second experiment, but there is no movie table because of the same reason which is mentioned in the details of the third experiment.
Figure 4.13: Change in Mean Average Error According to Expertise Figures 4.13, 4.14, and 4.15 represent the change in average error values according to the expertise level of the users. The results are similar with the results in the third experiment.
CHAPTER 4. EXPERIMENTS 46
Figure 4.14: Change in Median Average Error According to Expertise According to the results of the experiments, the prediction performance is significantly higher for expert users. These results show that our system has the ability to determine the user expertise level.
CHAPTER 4. EXPERIMENTS 47
Figure 4.15: Change in Maximum Likelihood Average Error According to Exper-tise
4.2.3
Comparison between Experiments
In this section, we present the average error values for each experiment in order to compare the prediction performances. The values are given in Table 4.5.
According to the values, median is the best way to determine a single rating by using the probability distribution of rating values. Determining the quality of movies instead of the quality of directors makes significant improvement in the prediction. The genre extensions of the experiments do not cause significant improvement in the performance of the prediction.
CHAPTER 4. EXPERIMENTS 48
Experiment Mean Avg. Err. Median Avg. Err. ML.1 Avg. Err.
1 0.8407 0.7500 0.9910 2 0.8455 0.7456 0.9775 3 0.7842 0.7105 0.9587 4 0.7938 0.7073 0.9482 1 Maximum likelihood
Table 4.5: Average Error Values per Experiment
4.3
Evaluation
In this section, we evaluate the results which are given in Section 4.2.
In order to indicate the feasibility of the study, we compare our methodology with a classical approach which is used to find the quality of the movies. Accord-ing to the result of that comparison, Bayesian co-evaluation approach causes a significant improvement in determining the quality of the movies.
Since our system has the ability to detect the high quality movies, we are able to measure the capability of it to classify the users according to their expertise level. Since the expert users evaluate movies more accurately, the users whose ratings are predicted precisely are defined as experts in our system. Since there is a positive correlation between the prediction performance and expertise level, our system is able to identify the expert users correctly.
According to the comparison between the experiments, the idea of using di-rector information as source channel decreases the performance in the domain the evaluation of movies. In addition, genre extensions do not cause a significant improvement in predictions. Our final analyze is that the median prediction is the best way to estimate a single value from a distribution.