DOI: 10.1002/ejic.201501116
Full Paper
Hydroxyapatite Thin Films
CLUSTERISSUESalt-Acid-Surfactant Lyotropic Liquid Crystalline Mesophases:
Synthesis of Highly Transparent Mesoporous Calcium
Hydroxyapatite Thin Films
Ebrima Tunkara
[a]and Ömer Dag*
[a]Abstract: Even though calcium hydroxyapatite [Ca10(PO4)6
-(OH)2, HAp] is one of the most investigated materials in the
literature, the synthesis of mesoporous transparent thin film of HAp has not yet been reported. We show herein that mixtures of phosphoric acid (H3PO4·H2O, PA), calcium nitrate tetrahydrate
[Ca(NO3)2·4H2O, CaN] and non-ionic surfactant [C12H25
-(OCH2CH2)10OH, C12E10] can self-assemble into stable lyotropic
liquid crystalline (LLC) mesophases. The clear aqueous solutions of the mixtures can be spin-coated over any substrate and then calcined to form highly transparent mesoporous HAp (mHAp)
Introduction
Many salts with low melting points and/or high solubility in aqueous media form stable lyotropic liquid crystalline (LLC) mesophases with non-ionic surfactants.[1,2] In this assembly
process, the salt species in the hydrophilic domains of the LLC mesophase melt at relatively low temperatures or dissolve in smaller amounts of water. It is also known that the melting points of the salts further decrease[1]and their water solubility
is enhanced[2] when they are confined within the hydrophilic
domains of the mesophase. This confinement in nanoscale space is known as the soft confinement effect (SCE).[3–6] In
these assemblies, the metal ions have either a hydration sphere or are coordinated by water coordination.[1,2]For instance, aqua
complexes of most first-row and some second-row transition metals undergo self-organization with non-ionic surfactants into various mesostructures.[7]
The decrease in the melting point and increase in the solubil-ity can also be considered to be due to deliquescence relative humidity (DRH), which is known to be responsible for species self-dissolving by absorbing ambient water at room tempera-ture. Therefore many salts and highly hygroscopic chemical spe-cies either melt or dissolve and cooperatively self-assemble with non-ionic surfactants [such as oligo(ethylene oxides) and pluronics] to form stable LLC mesophases.[1,2,7,8] Both H
3PO4
and Ca(NO3)2·4H2O have very low melting points and they
[a] Department of Chemistry, Bilkent University, 06800 Ankara, Turkey
E-mail: [email protected] http://www.fen.bilkent.edu.tr/~dag/
Supporting information for this article is available on the WWW under http://dx.doi.org/10.1002/ejic.201501116.
thin films. From among the compositions studied, three molar ratios of CaN/PA/C12E10 [3.3:2:1 (low), 5.8:3.5:1 (intermediate)
and 8.4:5:1 (high)] were chosen for large-scale preparation to investigate their structural and thermal properties. The mHAp films form at around 300 °C and fully crystalize at 500 °C, retain-ing their transparency, uniformity and porosity in all composi-tions with few differences. The surface area and pore volume decrease, and the pore size and pore size distribution increase with increasing annealing temperature for all compositions.
spontaneously absorb water and dissolve under ambient condi-tions. This makes them important candidates as non-volatile solvents for the self-assembly of non-ionic surfactants in the design of new porous materials.[9,10]Some alkali and
alkaline-earth metal salts such as Ca(NO3)2, CaCl2, MgCl2and LiX (X =
Cl–, Br–, I–, NO
3–), and likely many more, can also be effectively
hydrated and dissolved in a very small volume of water to form stable mesophases.
Calcium hydroxyapatite [Ca10(PO4)6(OH)2, abbreviated as
HAp] is one of the most promising materials in bone and tissue engineering because of its osteoconductivity, non-inflamma-tory, non-toxicity, compatibility and ability to replace worn-out tissues.[11]These properties make HAp a good candidate for use
in drug and protein delivery systems as well as in other medical applications.[12–19]Synthesized HAp comes in two forms: porous
or dense. The former has attracted more attention from re-searchers because of the large surface area. In addition to sur-face area, the size and volume of the pores are also important features to consider when synthesizing this material. So far, re-ported synthetic techniques include sol–gel synthesis, emulsion techniques, a mixed surfactant-mediated approach, low-tem-perature hydrothermal processes, precipitation and hydroly-sis.[12–34]Despite numerous synthetic techniques, few attempts
to synthesize mesoporous thin films have been reported.[35]
In-stead, most of the aforementioned techniques result in the pro-duction of HAp powders with small surface areas and hollow nanospheres.[34]The major challenge in these synthetic
meth-ods is the fast precipitation/crystallization of calcium phosphate species.[34]Some of these synthetic methods also involve LLC
templating,[35–38] but the calcium ion concentrations used in
those investigations were too low to obtain films or monoliths of HAp and as a result led to the production of small quantities
of apatite in the gel phase.[35–38]To the best of our knowledge,
uniform and transparent thin films of mesoporous apatite have not yet been prepared. The synthesis of uniform mesoporous HAp films over various substrates could be very important not only in bone and tissue implantation, but also in the creation of inert surfaces for cell proliferation and other biological appli-cations. Note also that pores larger than 10 nm are useful for the delivery of proteins, genes and large-molecule drugs, with smaller pores being suitable for the delivery of smaller drug molecules.[39]
In this investigation, we show that calcium nitrate and phos-phoric acid in the presence of non-ionic surfactants can self-assemble into stable LLC mesophases that can be calcined at higher temperatures to produce sponge-like (L3 phase)[40]
highly transparent mHAp thin films. The mesophases and re-sulting mHAp films were characterized by SEM, TEM, N2
sorp-tion, FTIR and Raman spectroscopy and PXRD and electron dif-fraction (ED) techniques.
Results and Discussion
A non-ionic surfactant such as C12H25(OCH2CH2)10OH (C12E10)
forms stable liquid crystalline mesophases with 85 % phos-phoric acid (H3PO4·H2O, PA),[41] pure calcium nitrate
tetra-hydrate [Ca(NO3)2·4H2O, CaN][42]and a mixture of the two. The
PA-C12E10mesophases are stable over a very broad range of PA/
C12E10molar ratios (2 to 20) and temperatures (–30 to 130 °C).
The CaN-C12E10mesophases are also stable over a wide range
of CaN concentrations. Note also that both the PA-C12E10and
CaN-C12E10 mesophases are cubic at high PA/C12E10 and CaN/
C12E10molar ratios.[41,42]In this work we focussed on the LLC
mesophase of a mixture of PA, CaN and C12E10, and its
transfor-mation into mesoporous HAp (mHAp). Clear aqueous solutions of the constituents can be prepared over a very broad concen-tration range of PA and CaN and are stable for months; there is no precipitation of calcium phosphate species due to the high acidity of the media. The solutions can be spin-coated over any substrate. During the coating process, the excess water quickly evaporates and leaves behind a mesophase of the PA-CaN-C12E10mixture with a very small amount of water. In this
assem-bly process, the CaN and PA collectively act as a solvent to induce the self-assembly of the surfactant into an LLC meso-phase. The mesophase is also stable on the substrate for days at room temperature due to the acidity of the media, which prevents the precipitation of the calcium phosphate species.
No definite solid transformation was observed during the aging process at room temperature. However, there were some changes in the media during the aging of the gel-like films (for details see the FTIR section). Figure 1 shows a schematic representation of the LLC mesophase and mHAp after the trans-formation. The LLC phase is ordered (diffracts at small angles) up to a CaN/PA/C12E10molar ratio of 8.4:5:1. In this investigation
we studied compositions with molar ratios between 2.5:1.5:1 and 8.4:5:1 CaN/PA/C12E10. The ratio of calcium to phosphate
was always maintained at 1.67 (Ca2+/PO
43–ratio in the HAp) in
all compositions. Note also that these concentrations are high enough to produce thick pore walls that can resist calcination during the formation of the mesoporous network (see Figure 1).
Figure 1. Schematic representation of the LLC mesophase (left) and mesopo-rous HAp (right).
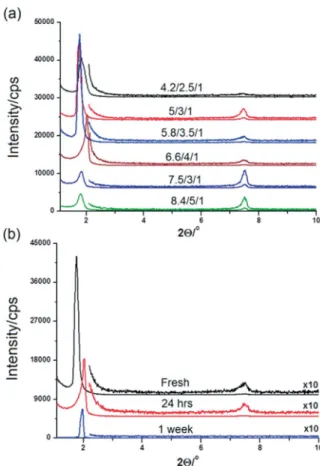
Figure 2 (a) shows a series of small-angle powder X-ray dif-fraction patterns collected from various thin films of the fresh samples. The small-angle diffraction line observed at a 2θ value of between 1.7 and 2.0° (d spacing 52–44 Å) is due to the LLC mesophase. The observed single line makes it difficult to pre-dict the structure of the mesophase. However, the thicker sam-ples are dark between the cross polarizers under a polarized optical microscope (POM), which, collectively, suggests that the mesophase is cubic, similarly to the individual phases (PA-C12E10
and CaN-C12E10). Another diffraction line is observed at around
7.50° (d spacing 11.8 Å) owing to the presence of CaHPO4·2H2O
or Ca(H2PO4)2·H2O in the freshly prepared samples. However,
this line disappears over time, which indicates the complete solubility of the calcium species in the LLC media (see Figure 2,
Figure 2. PXRD patterns of fresh gel thin films of CaN-PA-C12E10with the CaN/ PA/C12E10molar ratio in the range of 3.3:2:1 to 8.4:5:1 (a) and after aging for up to 1 week (b), as indicated on the plots.
b) and can be attributed to both the high solubility of the ionic species in a confined space[2]and the high acidity of the media.
As shown in Figure 1, the acid and calcium salt species are evenly distributed in the hydrophilic region of the mesophase and are ready to form calcium phosphate species. Note also that the diffraction patterns do not show much response to an increase in the aqueous species in the hydrophilic domains. It is already known from the salt-surfactant system that increasing the salt/surfactant ratio expands the unit cell of the mesophase to accommodate more salt species.[43]Therefore, the new
be-haviour (no change in the unit cell) can be interpreted as a decrease in the aggregation number of the surfactant, that is, the number of surfactants per unit volume, in the mesophase to accommodate more aqueous species per surfactant. There-fore, the content of the hydrophilic domains likely does not change much with increasing aqueous species in the media.
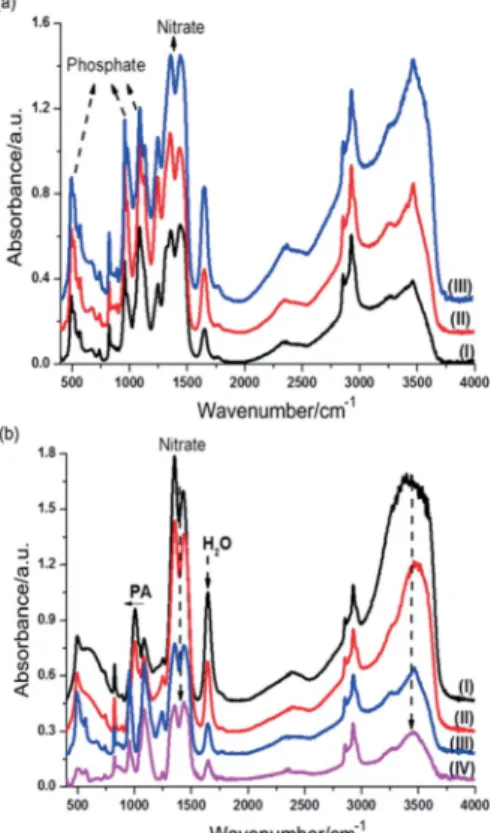
To further elucidate the nature of the species in the LLC me-dia, we also recorded FTIR spectra of fresh samples with differ-ent compositions and during the aging process (Figure 3). Note that the peaks relating to the PA and nitrate gradually increase with increasing CaN and PA content in the samples (Figure 3, a). The peaks at around 2340 and 2930 cm–1are characteristic
of PA and arise from symmetric and anti-symmetric ν-OH modes.[44–46] The high frequency broad peak at around
3560 cm–1is also characteristic of the free (non-hydrogen
bond-ing) OH moiety of H3PO4.[44–46] The other broad features at
around 3200–3500 cm–1 are due to the free and coordinated
water molecules around the ions. The peak at around
Figure 3. (a) FTIR spectra of fresh samples with CaN/PA/C12E10molar ratios of (I) 4.2:2.5:1, (II) 5.8:3.5:1 and (III) 7.5:4.5:1. (b) FTIR spectra of a fresh sample of 8.4:5:1 CaN/PA/C12E10recorded at room temperature over time: (I) immedi-ately, (II) 10 min, (III) 60 min and (IV) 1 week.
1003 cm–1, and its high frequency shoulder in the pure PA,
shifts to 956 cm–1.
Many changes can be observed in the spectra during the aging process; the water peak at 1640 cm–1 and the nitrate
related peaks[47]at 1045, 1296, 1370 and 1490 cm–1lose
inten-sity, whereas new peaks emerge at 493, 520, 544, 568, 855, 956 and 1130 cm–1(see Figure 3, b). These peaks are well resolved
and quite sharp, indicating that they originate from crystalline phosphate species. The spectral changes also reveal that huge amounts of water and nitrates are eliminated from the media as water vapour and likely nitric acid, respectively. The evapora-tion of both water and nitric acid enhances the formaevapora-tion of the calcium phosphate type species.[44–46] Because we could
identify the presence CaHPO4·2H2O or Ca(H2PO4)2·H2O in the
PXRD pattern, these spectral changes can be attributed to the formation of those phosphates in the freshly prepared sam-ples.[45]The FTIR spectral changes also confirm that these
spe-cies re-dissolve over time and many sharp peaks disappear from the spectra (compare spectra III and IV in Figure 3, b). However, the samples are gel-like and stable for months without achiev-ing the complete formation of calcium phosphate or calcium hydroxyapatite. It is likely that the formation of insoluble phos-phate species is hindered, because the media is still quite acidic. For further investigations we chose three different composi-tions of CaN-PA-C12E10 to prepare in large quantities [denoted
as low (3.3:2:1 CaN/PA/C12E10molar ratio, sample A),
intermedi-ate (5.8:3.5:1 CaN/PA/C12E10 molar ratio, sample B) and high
(8.4:5:1 CaN/PA/C12E10molar ratio, sample C)]. Around 150–200
glass slides were coated using the clear solutions of these three compositions. The samples were then calcined at various tem-peratures and analysed by FTIR spectroscopy, PXRD, N2-sorption
measurements and TEM. Figure 4 shows the variation in the FTIR spectra upon heating sample A. The surfactant-related peaks remain, with only some small changes, up to 250 °C, but completely disappear at around 300 °C. The remaining broad peaks, observed at 575, 951 and 1061 cm–1, are characteristic of
calcium hydroxyapatite.[48]The peaks at 569, 600 and 632 cm–1
are due to phosphate and hydroxide bending modes, and those
Figure 4. FTIR spectra of sample A at different temperatures (as indicated on the spectra): (a) on a Si wafer (low temperature) and (b) in KBr pellets of a powder sample (high temperatures).
at 960, 1046 and 1091 cm–1are due to phosphate stretching
modes. A new sharp peak also appears at 3574 cm–1due to the
stretching mode of the OH groups of the hydroxyapatite.[46]
The HAp-related peaks first appear at 300 °C and become sharper and well resolved at higher temperatures. However, the nitrate- and likely carbonate-related peaks are also weakly ob-served at this stage and they completely disappear at around 500 °C (see 1200–1600 cm–1region). The sharp peak at around
1384 cm–1is due to crystalline KNO
3, which forms when
nitrate-containing samples are pressed into KBr pellets. As shown in the spectra, this peak gradually disappears with increasing an-nealing temperature. No additional changes were observed upon further heating to 500 °C. The samples B and C display similar spectral changes upon annealing at different tempera-tures (see Figure S1 in the Supporting Information). Therefore, a simplified overall reaction is given by Equation (1).
10Ca(NO3)2+ 6H3PO4+ 2H2O→ Ca10(PO4)6(OH)2+ 20HNO3 (1)
Note also that many methods reported in the literature use basic media for the precipitation of calcium hydroxyapatite. Here, we have shown for the first time that a highly acidic me-dia and heat treatment can also be used to synthesize mHAp. The likely byproduct of the annealing process is nitric acid and/ or its decomposition products, produced during calcination and further annealing steps. The calcined films are of high quality, crack free and highly transparent up to 500 °C and become opaque at around 600 °C (see Figure 5).
Figure 5. Photograph of a transparent mesoporous HAp thin film coated upon a microscope slide.
Around 150–200 transparent films were prepared on glass slides, calcined at 300 °C and then scraped from the glass sur-face, to collect around 60 mg of powder samples for the PXRD and N2-sorption measurements. The PXRD and N2-sorption
measurements were carried out at 300, 400 and 500 °C using the same powder samples. Figure 6 and Figure S2 in the Sup-porting Information show the PXRD patterns of powder sam-ples A, B and C at those three temperatures. Clearly, all the diffraction lines correspond to calcium hydroxyapatite (by com-parison with the ICDD PDF card #01-074-0566). The only change in the PXRD patterns is that the lines become sharper and well resolved with increasing annealing temperature, which indicates the growth and/or further crystallization of the cal-cium hydroxyapatite pore walls (see TEM analysis below). For all compositions we obtained HAp with slightly different crystal-linity. For instance, sample C300 (prepared at 300 °C using sam-ple C with the highest CaN and PA molar ratio of 8.4:5) displays
Figure 6. PXRD patterns of A300, A400 and A500 (CaN/PA/C12E10molar ratio of 3.4:2:1) at three different temperatures (as marked on the patterns; bottom pattern is the PDF card #01-074-0566 in the ICDD database).
broader diffraction lines, but it also fully crystallizes upon heat-ing at 500 °C (see Figure S2). Figure 7 and Figure S3 show the N2-sorption isotherms of samples A, B and C calcined at 300,
400 and 500 °C. Clearly, all the isotherms are type IV isotherms, characteristic of mesoporous materials, and show hysteresis. The BET surface area of sample A changes from 96 to 24 m2/g
upon increasing the calcination temperature from 300 to 500 °C. The BJH pore-size distribution plots, from desorption branches, peak at 20 nm (with a shoulder at 13 nm) and 25.3 nm for A300 and A400, respectively. However, the pore-size distribution plot of A500 shows a weak and sharp feature at 3.0 nm and a weak and very broad feature at around 42 nm. The pore volume of sample A follows the trend in pore size, with values of 0.58, 0.40 and 0.08 cm3/g at 300, 400 and 500 °C,
respectively. Similar changes were observed for samples B and C. The N2-sorption data for the other compositions are given in
Table 1 (see also Figures S3 and S4 for detail). The pore-size distribution plots display a dependence on the composition (at 300 °C) and both A300 and B300 show two features (see the TEM image in Figures 5, 7; see also Figure S4c in the Supporting Information), whereas C300 has a uniform pore-size distribution and peaks at around 12 nm. Note also that the PXRD pattern of C300 displays much broader diffraction lines than A300 and B300 (compare the PXRD patterns in Figure 6 and Figure S2). It is likely that C300 has thinner pore walls or lower crystallinity than samples A300 and B300. However, for all compositions the pore size increases and displays a broad distribution upon heating at 400 °C, but the surface area and pore volume de-crease with further heating, whereas the pore size distribution becomes extremely broad. Both the PXRD and N2-sorption data
are consistent and provide information regarding the mesopo-rous walls that increase in size and crystallize upon heating at higher temperatures and collapse at around 600 °C (also see the TEM analysis).
Figure 7. (a) N2sorption (77 K) isotherms of (I) A300, (II) A400 and (III) A500 and (b) pore-size distribution plots for C300, C400 and C500 (temperatures are marked in the plots).
Table 1. N2sorption data of HAp prepared at three different compositions. Sample T[a][°C] SA[b][m2/g] PV[c][cm3/g] PS[d][nm] A 300 96 0.58 13/20 400 61 0.40 25.3 500 24 0.08 42 B 300 86 0.58 12/27 400 40 0.26 40 500 26 0.10 25 C 300 78 0.40 12.4 400 36 0.27 38.4 500 23 0.10 30–60
[a] T = calcination temperature. [b] SA = BET surface area. [c] PV = BJH pore volume from desorption branch. [d] PS = BJH pore size from desorption branch.
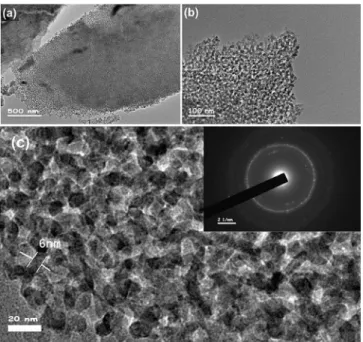
To further verify the formation of mHAp, a series TEM images were collected at three different temperatures. Figure 8 (a) shows a large-area image of the film of sample A350. Figure 8 (b,c) show higher resolution images; the porous network is clearly seen with an average pore-wall thickness of around 6.0 nm. The selected area electron diffraction (SAED) pattern shown in the inset of Figure 8 (c) shows the crystalline nature
Figure 8. (a–c) TEM images of thin film of mHAp A350 at different magnifica-tions. Inset to (c): SAED image.
of the pore walls. With further heating, the pore walls grow and further crystallize, as observed in the PXRD (shown in Figure 6) and SAED patterns and high-resolution TEM images. The thick-ness of the pore walls increases to around 20 nm at 500 °C, retaining a sponge-like porosity (Figure 9, a). Therefore, it is reasonable to observe such a decrease (from 96 to 24 m2/g) in
the surface area.
Figure 9. TEM images of mHAp films of sample A calcined at (a) 500 °C (inset: enlarged domains on the edge of the film) and (b) 600 °C. (c) SAED pattern of A600. (d) Fast Fourier transformed (FFT), masked and then back FFT images from a selected area in panel (b).
The TEM images of the samples calcined at 600 °C still show some porous domains as well as larger crystallites (20–30 nm, see Figure 9, b). Further annealing enhances the crystallinity of the samples (compare SAED patterns in inset to Figure 8 (c) and
Figure 9, c). However, these samples are quite opaque due to the formation of larger crystallites and multiple cracks in the film. The high-resolution images of the crystalline pore walls were further analysed to prove that the walls are calcium hydroxyapatite. Figure 9 (d) displays an inverse fast Fourier transform (FFT) image of a selected area in Figure 9 (b), masked and back FFT, that clearly displays lattice fringes with a spacing of 0.816 nm, which corresponds to the (100) plane of the hexagonal Ca10(PO4)6(OH)2. Some of the other common planes
of HAp have also been evaluated by using these high-resolution TEM images. All the techniques employed in this investigation (SAED, PXRD, TEM, N2sorption and FTIR) collectively show that
the films are mesoporous and the pore walls are formed from pure and crystalline calcium hydroxyapatite.
The TEM images of samples B and C clearly display two pore systems at low temperatures. Figure S5 in the Supporting Infor-mation shows small and large pores in sample B350, with the small pores predominating over large pores in sample C350. Overall, the images clearly show the spongy L3 phase of mHAp. These results are also consistent with the N2-sorption data. Note
that the pores, both small and large, are much larger than the typical micelle domain size of the LLC mesophase. It is likely that, at higher temperatures, not only the mesophase under-goes many changes, but the thinner pore walls collapse to yield thicker pore walls and create larger pores. The major reason for this must be the large change in the PA-CaN composition in the hydrophilic domains of the mesophase upon transformation to HAp during calcination. This is a reasonable explanation be-cause sample C has the largest PA and CaN composition, but the smallest pores at low temperatures. Altogether, it is reason-able to suggest that at low concentrations the pore walls crys-tallize and grow at the expense of the collapse of the smaller pores, but at higher temperatures all the compositions produce more or less similar sponge-like mesoporous films.
Conclusions
Calcium nitrate and phosphoric acid can be dissolved in aque-ous media in the presence of C12E10, a non-ionic surfactant, to
obtain clear solutions that can be spin-coated onto any sub-strate to form lyotropic liquid crystalline thin films. The mixtures in the solution phase stay stable as clear solutions indefinitely at room temperature, without undergoing precipitation. How-ever, the LLC thin films undergo some changes, but remain as gels for months for all compositions. During calcination, the ordered LLC phase undergoes structural changes and by the time the mesostructure solidifies, the mesophase becomes a sponge-like L3phase[40]and produces sponge-like mHAp for all
compositions. The calcination could be carried out between 300 and 500 °C to obtain transparent mHAp films. The pore size (12–42 nm), pore volume (0.58–0.08) and wall thickness (6– 20 nm) can be adjusted by controlling the calcination tempera-ture. Compositional changes have smaller effects on these pa-rameters. All compositions, from low CaN and PA concentra-tions (sample A) to very high CaN and PA concentraconcentra-tions (sam-ple C), produced similar materials. It is likely that by increasing
the concentrations of CaN and PA in the media, the aggregation number of the surfactant in the mesophase decreases to pro-duce a similar mesophase and, as a result, similar pore struc-tures are observed in all compositions upon calcination.
The salt/phosphoric acid/C12E10mesophase is an important
synthetic route for the synthesis of mHAp thin films and this work is the first example of the use of acid and salt in the same LLC media. Note also that many transition-metal nitrates also form LLC mesophases with non-ionic surfactants.[7,8]Therefore,
incorporating phosphoric acid and a transition-metal nitrate salt into LLC mesophases may be beneficial for producing many other mesoporous metal phosphate thin films for use in various energy applications.
Experimental Section
Materials: All chemicals were purchased from Sigma–Aldrich and
used without further treatment. Fresh water obtained from a Milli-pore Synergy 185 water purifier was used in the preparation of all samples.
Preparation of Calcium Nitrate and Phosphoric Acid Solutions and LLC Thin Films: C12EO10(2.000 g) was added to water (7.0 mL) in a pre-cleaned and dried vial. The mixture was then placed on a magnetic stirrer and stirred for 30 min to ensure homogenization. The appropriate amount of calcium nitrate (the mass depends on the intended concentration) was then added to the mixture, which was stirred for another 30 min before the required amount of phos-phoric acid was finally added to the mixture. In all samples the CaN/PA molar ratio was kept at 1.67 (the ratio of Ca/P in calcium hydroxyapatite). The solution was stirred for a further 10 h to ensure homogeneous mixing. The resulting clear solution remained clear indefinitely due to the high acidity of the media (pH ≈ 0.73). Thin films of various compositions were formed in their LLC phases upon spin-coating of substrates. The exact numbers, in grams, of each of the precursors used in the preparations are tabulated in Table 2).
Table 2. Initial compositions of the samples used in this investigation. CaN/PA mol ratio[a] PA [g] CaN [g] C12E10[g]
2.5:1.5 0.552 1.886 2.000 3.4:2 (A) 0.736 2.514 2.000 4.3:2.5 0.921 3.142 2.000 5:3 1.105 3.499 2.000 5.9:3.5 (B) 1.289 4.083 2.000 6.7:4 1.473 4.665 2.000 8:4.5 1.657 5.248 2.000 8.4:5 (C) 1.841 5.833 2.000 [a] Molar ratios are given relative to the surfactant C12E10. A, B and C are specific samples investigated in detail.
Synthesis of Transparent Mesoporous Calcium Hydroxyapatite Thin Films: After homogenizing for 24 h, the above solutions were
spin-coated at 5000 rpm over pre-cleaned 75 mm × 25 mm glass microscope slides to obtain LLC thin films. To avoid the formation of side-products that could inhibit the synthesis, the films were immediately calcined at temperatures in the range 300–600 °C in a pre-heated oven. After placing the samples in an oven, the temper-ature was set to 100 °C and was then slowly increased to the de-sired temperature at a rate of 1.0 °C/min and then kept at the speci-fied final temperature for 1 h to obtain the transparent mesoporous
thin films. Samples A, B and C were produced in large quantities to collect PXRD and N2-sorptıion data.
Sample Preparation and Instrumentation: To obtain TEM images,
the calcined films were carefully scraped from the glass substrate and ground for approximately 20 min in a mortar using a small amount of pure ethanol and then transferred to a vial. Then the vial containing the mixture was subjected to ultrasound for 30 min in ethanol to obtain a well-dispersed solution. The well-dispersed solutions were later drop-cast onto a hole-carbon support film TEM grid and immediately dried under a powerful light for 10 min to prevent re-aggregation of the dispersed particles. The samples were imaged by using a JEOL JEM 2100F microscope at an operating voltage of 200 kV. For the N2-sorption and PXRD measurements, around 200 glass slides bearing transparent mesoporous Ca10(PO4)6(OH)2 films calcined at 300 °C were scraped to collect around 60 mg of powder, which was used for the first N2-sorption and XRD measurements. After the first measurements, the same powder was heated to the subsequent temperature (400 °C and then finally 500 °C) for the next sorption and PXRD measurements. The N2(77.4 K) sorption measurements were performed with a Tri-Star 3000 automated gas adsorption analyser (Micrometrics) in a relative pressure range, P/P0, of 0.01–0.99. To provide high accuracy and precision in the determination of P/P0, the saturation pressure P0 was measured over 120 min intervals. The powder samples, which were obtained by scraping approximately 200 glass slides bearing the films, were dehydrated under a vacuum (ca. 10–2Torr) for 3 h at 250 °C before measuring in order to remove adsorbed water and volatile species from the pores. The N2-sorption measure-ments were performed by evacuating the chamber at a pressure of 10 Torr under a vacuum of 150 μm Hg for 1 h. Both a leak test and out-gas test were performed at 120 and 180 s, respectively. The whole period of measurement lasted about 9 h, after which the sample was removed from the tube and then heated again to the subsequent temperature. The PXRD measurements were performed with a Rigaku Miniflex diffractometer equipped with a high power Cu-Kα source operating at 30 kV and 15 mA. The same samples used in the N2sorption measurements were also used for the XRD measurements. For the SEM measurements, a small portion of the film was scraped from the glass substrate and placed over carbon-tape-covered aluminium SEM sample holders for imaging and EDX measurements. The SEM data were collected with a ZEISS EVO-40 microscope operating at 15 kV and the same microscope and Bruker AXS XFlash detector 4010, respectively. The FTIR measure-ments were either performed by coating the samples over Si wafers (for the fresh samples, and samples heated between room temp. and 200 °C) or by preparing KBr pellets (for calcined samples). The FTIR spectra were collected with a Bruker Tensor 27 model FTIR spectrometer equipped with a Digi Tect TM DLATGS detector with a resolution of 4.0 cm–1in the range 400–4000 cm–1.
Acknowledgments
E. T. thanks the Islamic Development Bank (IDB) for an M. Sc. scholarship. Ö. D. is a member of the Science Academy, Istanbul, Turkey.
Keywords: Mesoporous materials · Thin films · Liquid crystals · Surfactants · Calcium
[1] C. Albayrak, N. Özkan, Ö. Dag, Langmuir 2011, 27, 870–873.
[2] C. Albayrak, A. Cihaner, Ö. Dag, Chem. Eur. J. 2012, 18, 4190–4193. [3] K. Binder, J. Horbach, R. Vink, A. de Vigiliis, Soft Matter 2008, 4, 1555–
1568.
[4] P. Chi, Z. Wang, B. H. Li, A. C. Shi, Langmuir 2011, 27, 11683–11689. [5] C. Cramer, T. Cramer, F. Kremer, R. Stannarius, J. Chem. Phys. 1997, 106,
3730–3742.
[6] L. M. Wang, F. He, R. Richert, Phys. Rev. Lett. 2004, 92, 095701-4. [7] Ö. Çelik, Ö. Dag, Angew. Chem. Int. Ed. 2001, 40, 3799–3803; Angew.
Chem. 2001, 113, 3915.
[8] G. Barım, C. Albayrak, E. Yılmaz, Ö. Dag, Langmuir 2014, 30, 6938–6945. [9] C. Karakaya, Y. Türker, Ö. Dag, Adv. Funct. Mater. 2013, 23, 4002–4010. [10] C. Karakaya, Y. Türker, C. Albayrak, Ö. Dag, Chem. Mater. 2011, 23, 3062–
3071.
[11] R. Z. LeGores, Chem. Rev. 2008, 108, 4742–4753. [12] I. Soten, G. A. Ozin, J. Mater. Chem. 1999, 9, 703–710. [13] B. J. Melde, A. Stein, Chem. Mater. 2002, 14, 3326–3331.
[14] T. T. Morgan, H. S. Muddana, E. I. Altinoglu, S. M. Rouse, A. Tabakovic, T. Tabouillot, T. J. Russain, S. S. Shanmugavelandy, P. J. Butler, P. C. Eklund, J. K. Yun, M. Kester, J. H. Adair, Nano Lett. 2008, 8, 4108–4115. [15] M. Y. Ma, Y. J. Zhu, L. Li, S. W. Cao, J. Mater. Chem. 2008, 18, 2722–2727. [16] Y. Cai, H. Pan, X. Xu, Q. Hu, L. Li, R. Tang, Chem. Mater. 2007, 19, 3081–
3083.
[17] T. Matsumoto, M. Okazaki, A. Nakahira, J. Sasaki, H. Egusa, T. Sohmura, Curr. Med. Chem. 2007, 14, 2726–2733.
[18] M. A. Rauschmann, T. A. Wichelhaus, V. Stirnal, E. Dingeldein, L. Zichner, R. Schnettler, V. Alt, Biomaterials 2005, 26, 2677–2684.
[19] K. Lin, Y. Zhou, Y. Zhou, H. Qu, F. Chen, Y. Zhu, J. Chang, J. Mater. Chem.
2011, 21, 16558–16565.
[20] D. Li, Y. Zhu, Z. Liang, Mater. Res. Bull. 2013, 48, 2201–2204.
[21] J. Yao, W. Tjandra, Y. Z. Chen, K. C. Tam, J. Ma, B. Soh, J. Mater. Chem.
2003, 13, 3053–3057.
[22] S. Sadasivan, D. Khushalani, S. Mann, Chem. Mater. 2005, 17, 2765–2770. [23] T. Long, Y.-P. Gou, S. Tang, Y.-J. Guo, Z.-A. Zhu, RSC Adv. 2014, 4, 11816–
11825.
[24] S. Bose, S. K. Saha, Chem. Mater. 2003, 15, 4464–4469. [25] J.-M. Tarasco, M. Armand, Nature 2001, 414, 359–367.
[26] N.-S. Choi, Z. Chen, S. A. Freunberger, X. Ji, Y.-K. Sun, K. Amine, G. Yushin, L. F. Nazar, J. Chao, P. G. Bruce, Angew. Chem. Int. Ed. 2012, 51, 9994– 10024; Angew. Chem. 2012, 124, 10134.
[27] R. L. Kerr, S. A. Miller, R. K. Shoemaker, B. J. Elliott, D. L. Gin, J. Am. Chem. Soc. 2009, 131, 15972–15973.
[28] F. Jiao, K. M. Shaju, P. G. Bruce, Angew. Chem. Int. Ed. 2005, 44, 6550– 6553; Angew. Chem. 2005, 117, 6708.
[29] H. C. Shum, A. Bandyopadhyay, S. Bose, D. A. Weitz, Chem. Mater. 2009, 21, 5548–5555.
[30] J. Zhang, M. Fujiwara, Q. Xu, Y. Zhu, M. Iwasa, D. Jiang, Microporous Meso-porous Mater. 2008, 111, 411–416.
[31] N. Ikawa, H. Hori, T. Kimura, Y. Oumi, T. Sano, Langmuir 2008, 24, 13113– 13120.
[32] Y. T. Huang, M. Imura, Y. Nemoto, C.-H. Cheng, Y. Yamauchi, Sci. Technol. Adv. Mater. 2011, 12, 045005-6.
[33] H. Wang, L. Zhai, Y. Li, T. Shi, Mater. Res. Bull. 2008, 43, 1607–1614. [34] B. P. Bastakoti, M. Inuoe, S.-I. Yusa, S.-H. Liao, K. C.-W. Wu, K. Nakashima,
Y. Yamauchi, Chem. Commun. 2012, 48, 6532–6534.
[35] G. A. Ozin, N. Varaksa, N. Coombs, J. E. Davies, D. D. Petrovic, M. Ziliox, J. Mater. Chem. 1997, 7, 1601–1607.
[36] M. Uota, H. Arakawa, N. Kitamura, T. Yoshimura, J. Tanaka, T. Kijima, Lang-muir 2005, 21, 4724–4728.
[37] M. Kanapathipillai, Y. Yusufoglu, A. Rawal, Y.-Y. Hu, C.-T. Lo, P. Thiyagara-jan, Y. E. Kalay, M. Akinc, S. Mallapragada, K. Schmidt-Rohr, Chem. Mater.
2008, 20, 5922–5932.
[38] W. He, P. Kjellin, F. Currie, P. Handa, C. S. Knee, J. Bielecki, L. R. Wallenberg, M. Andersson, Chem. Mater. 2012, 24, 892–902.
[39] Q. He, L. Pan, Y. Wang, F. C. Meldrum, Cryst. Growth Des. 2015, 15, 723– 731.
[40] K. M. McGrath, D. M. Dabbs, N. Yao, I. A. Aksay, S. M. Gruner, Science
1997, 277, 552–556.
[41] E. Tunkara, C. Albayrak, E. O. Polat, C. Kocabas, Ö. Dag, ACS Nano 2014, 8, 11007–11012.
[43] C. Albayrak, A. M. Soylu, Ö. Dag, J. Colloid Interface Sci. 2010, 341, 109– 116.
[44] W. W. Rudolph, Dalton Trans. 2010, 39, 9642–9653.
[45] Y. Fadeeva, L. P. Safonova, I. Persson, Phys. Chem. Chem. Phys. 2010, 12, 8977–8984.
[46] A. C. Tas, J. Am. Ceram. Soc. 2009, 92, 2907–2912.
[47] Ö. Dag, O. Samarskaya, C. Tura, A. Günay, Ö. Çelik, Langmuir 2003, 19, 3671–3676.
[48] M. Corno, C. Busco, B. Civalleri, P. Ugliengo, Phys. Chem. Chem. Phys.
2006, 8, 2464–2472.
Received: September 30, 2015 Published Online: December 2, 2015