Introduction
The genus Dryomys in Turkey is represented by two species, Dryomys nitedula and Dryomys laniger (YIĞIT et al. 2003). D. nitedula (PALLAS 1779) occurs widely in Turkey, whereas D. laniger, fi rst described by FELTEN and STORCH (1968) from Çığlıkara - Elmalı (Antalya), ranges throughout Taurus Mountains (KRYSTUFEK, VORHALIK 2005).
A number of studies have dealt with the karyolog-ical, morphologkaryolog-ical, blood serum protein and allozymic variation in Turkish populations of the genus Dryomys. The diploid chromosome numbers were reported to be distinct between the two species; D. nitedula with 2n = 48 and D. laniger with 2n = 46 (DOĞRAMACI and KEFELIOĞLU 1990, CIVITELLI et al. 1995, KIVANÇ et al. 1997). The
slight colour variations over the distribution range of D. nitedula in Turkey and adjacent countries led to assignation of a number of subspecies, e.g.: D. n. pictus (BLANFORD 1875) from Hakkari province (Eastern Turkey), which has also been considered as a separate species by MURSALOĞLU (1973), D. n. wingei (NEHRING 1902) from Greece, D. n. phry-gius (THOMAS 1907) from Uşak province (Western Turkey), D. n. robustus (MILLER 1910) from Bulgaria and D. n. tichormirovi (SATUNIN 1920) from Armenia. A similar colour variation was reported between the sub-populations of D. nitedula by YIĞIT et al. (2003) but no substantial cranial variation was found. Apart from this, YIĞIT et al. (2003) compared D. nitedula and D.
Biometric and Allozymic Variations
in the Genus Dryomys (Rodentia: Gliridae) in Turkey
Nuri Yiğit
1*, Ercüment Çolak
1, Reyhan Çolak
1, Aydın Özlük
2, Nursel Gül
1,
Pınar Çam
1, Fulya Saygılı
11 Ankara University, Faculty of Science, Dept. of Biology, 06100 Beşevler, Ankara, Turkey; E-mail: [email protected] 2 Hitit University, Faculty of Arts and Science, Dept. of Biology, Çorum, Turkey
Abstract: Biometric and allozymic variations were analysed in three populations of Dryomys nitedula one
popula-tion of Dryomys laniger from Turkey. Multivariate analysis of 32 external and cranial measurements was performed on 44 specimens. Of the morphometric variables, twenty-six characters were found to be sig-nifi cantly different between both species (Tukey HSD, p < 0.05), and the total variance was explained by seven principle components (80.1%). The Black Sea population of D. nitedula and that of D. laniger were markedly separate on the fi rst two canonical functions. The genetic analysis was carried out on 17 enzyme systems of 36 specimens. Nine out of twenty loci were found to be polymorphic in D. nitedula popula-tions and fi ve were polymorphic in D. laniger. Ldh and Gpi loci were fi xed for different alleles between
D. nitedula and D. laniger. The mean value of the fi xation index (FST = 0.13) indicated moderate to high genetic differences between the populations of D. nitedula. Nei’s measure of genetic distance (D) varied from 0.006 to 0.030 among the populations of D. nitedula, whereas the highest genetic distance appeared between the Black Sea population of D. nitedula and D. laniger (D= 0.187).
laniger, noting that the shape of the braincase, tympan-ic bullae and mandible morphologtympan-ically distinguished them. The blood serum proteins were examined using the SDS-PAGE technique and were reported to have no taxonomic importance for these taxa (YIĞIT et al. 2003). Allozymic and biometric comparisons between sub-populations of D. nitedula were also performed by FILIPUCCI et al. (1994). According to their results, the Israeli samples were found to be distinguished from European sub-populations by four loci (Ldh-I, G6pdh, Pep-I and Lap-2). They also reported that seven loci were polymorphic in the sub-population of Edirne (Turkish Thrace); the proportion of polymorphic loci was 20%, the mean heterozygosity observed (Ho) was 0. 047, the average number of alleles per locus was 1.2. However there are no data available, with regard to the allozymic variation between both Dryomys spe-cies. Such allozymic patterns of D. laniger, as well as the biometric differences of D. laniger and D. nitedu-la, using discriminant analysis, are given for fi rst time in this study, in an effort to reveal new, discriminatory characters between the two species and further study the interpopulational variation within D. nitedula.
Sampling Area and Specimens
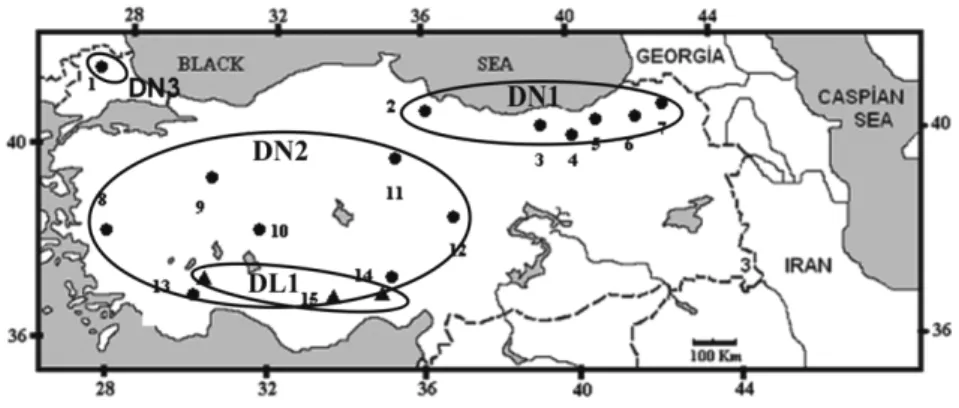
Specimens of Dryomys were collected from differ-ent localities in Turkey between 2005 and 2007. DL1 is represent to Southern Turkey (Elmalı N=2; Bolkar Mountains N=10; Aladağlar N=3, Gökbel Plateau N=1); DN1 is represent to Eastern Black Sea Region (Çamlıhemşin N=4; Çat N=3; Karanlıkmeşe N=1; Şavşat N=1; Çakallı N=1; Cankurtaran N=1; Kaptanpaşa N=1); DN2 is represent to Western Anatolia (Elmalı N=2; Çay N=1; Pınarbaşı N=1; Bolkar Mountains N=2, Bozüyük N=2; Çorum N=1; Kemalpaşa N=1); DN3 is represent to Turkish Thrace (Edirne N=13). The collection details are given in Fig. 1.Materials and Methods
Morphological study (Statistic evaluations; DL= 14, DN1; 7, DN2; 10, DN3; 13 specimens).
For the morphological comparison, 4 external and 27 skull characteristics were measured in a total of 44 adult specimens, using watch-faced calipers with a sensitivity of 0.01 mm. Measurements of
char-acteristics were analyzed by MANOVA (two-way multivariate analysis of variance). Pair wise com-parisons of these species by each variable were per-formed using the post hoc Tukey’s HSD test with unequal sample. For ordination analysis, Principal Component Analysis (PCA) was performed with the means of the characteristics measured. Discriminant Function Analysis (DFA) was carried out by SPSS 13. Phenotypic relationships among groups were obtained by UPGMA cluster analysis (SNEATH and SOKAL 1973, ROHLF 2000; NTSYS-pc version 2.1).
Abbreviations used for characteristic mea-sured: TBL (Total body length), TL (Tail length), HFL (Hind foot length), EL (Ear length), ZB (Zygomatic breadth), IC (Interorbital constriction), CBL (Condylobasal length), CNL (Condylonasal length), ONL (Occipitonasal length), BL (Basal length), NL (Nasal length), NW (Nasal width), FL (Frontal length), PRL (Parietal length), LFR (Length of facial region), LBC (Length of brain-case), MAB (Mastoid breadth), BCWB (Braincase height with bullae), BCW (Braincase height without bullae), OW (Occipital width), BW (Braincase wi-dth), DL (Diestama length), PL (Palatal length), FI (Foramen incisiva), HTB (Height of tympanic bul-lae), LTB (Length of tympanic bulbul-lae), WTB (Width of tympanic bullae), MAL (Mandible length), MAH (Mandible height), UML (Upper premolar length), LML (Lower premolar length).
Allozymic study (Specimens studied; DL= 12, DN1; 11, DN2; 6, DN3; 7).
The electrophoretic procedures were carried out, following SHAW and PRASAD (1970) and HARRIS and HOPKINSON (1976); the percentage of starch gel was 12% and the running of samples was performed dur-ing 4 – 6 h at 120 V. The different buffers for runndur-ing and dying were used in accordance with the enzyme systems Genetic variation was assessed using stand-ard horizontal gel electrophoresis and 17 enzymes coding for 20 presumptive loci were analyzed on 36 specimens (DL: n=12, DN1: n= 11, DN2: n= 6, DN3: n= 7). Homogenates obtained from muscle were run in horizontal starch gel electrophoresis for the fol-lowing enzymatic proteins: α-glycerophosphate dehydrogenase (E.C. 1.1.1.8; α-Gpdh), lactate
de-hydrogenase (E.C. 1.1.1.27; Ldh), malate dehydro-genase (E.C. 1.1.1.37, Mdh-1 and Mdh-2), malic enzyme (E.C. 1.1.1.40; Me), isocitrate dehydroge-nase (E.C. 1.1.1.42; Idh-1 and Idh-2), phosphoglu-conate dehydrogenase (E.C. 1.1.1.44; Pgd), glucose-6-phosphate dehydrogenase (E.C. 1.1.1.49; G6pdh), glyceraldehyde-3-phosphate dehydrogenase (E.C. 1.2.1.12; G3pdh), superoxide dismutase (E.C. 1.15.1.1; Sod), phosphoglucomutase (E.C. 2.5.7.1; Pgm), hexokinase (E.C. 2.7.1.1; Hk), aldolase (E.C. 4.1.2.13; Ald), carbonic anhydrase (E.C. 4.2.1.1; Ca-1 and Ca-2), fumarase (E.C. 4.2.1.2; Fum), aco-nitate hydratase (E.C. 4.2.1.3; Acon), mannose phos-phate isomerase (E.C. 5.3.1.8; Mpi), and glucose phosphate isomerase (E.C. 5.3.1.9; Gpi).
The observed electrophoretic band patterns were analysed following the method of HARRIS and HOPKINSON (1976). Presumptive alleles were desig-nated alphabetically by their relative mobility, with the allele variant migrating farthest towards the an-ode denoted as ‘A’. Allozymic data were analysed as allele frequencies with BIOSYS-2 (BLACK 1997; original version: BIOSYS-1 Release 1.7 program of SWOFFORD and SELANDER 1989, and modifi cations to HDYWBG and FSTAT by WILLIAM C. BLACK IV). The genetic variation between intra-specifi c popula-tions was estimated as the mean heterozygosity per locus of observed (Ho) and expected (HE)
frequen-cies of heterozygotes under the Hardy-Weinberg equilibrium, the proportion of polymorphic loci in the population, and the mean number of alleles per locus. The BIOSYS-1 Release 1.7 program was used
to calculate overall and population-specifi c Wright’s F-statistics estimators of FST,FIT and FIS. Fixation indices (F-statistics; Wright, 1951, 1965) were used to summarize the distribution of genetic variation within and between populations. Estimates of over-all gene fl ow between populations (Nm) were de-rived from the approximation FST =1 / (1 + 4Nm) as recommended by SLATKIN and BARTON (1989). The amount of genetic divergence between species was estimated with the indices of standard genetic identity (I) and distance (D, Nei unbiased distance) proposed by NEI (1978). A Neighbour joining den-drogram of the genetic relationships among the spe-cies was constructed by using the allele frequenspe-cies obtained from BIOSYS-1 Release 1.7 program.
Results
Biometric Analysis
In multivariate analysis of variance (MANOVA), the pair-wise comparisons performed with Tukey’s HSD test, using 31 variables showed signifi cant differenc-es in 26 variabldifferenc-es between the three sub-populations of D. nitedula and the D. laniger population. Of these characteristics, 22 were found to be different between D. nitedula and D. laniger, and 13 among the three sub-populations of D. nitedula. HFL, ZB, NW, BCW, MAL and MAH distinguished D. lani-ger from D. nitedula (p < 0.01). With regard to D. nitedula, DN1 differed from DN2 and DN3, based on MAB, BW, HTB, LTB, UML and LML, and was proven to be the most distinct sub-population.
Fig. 1. The collecting cites of specimens in Turkey. 1: Turkish Thrace (Edirne): 2-7: Eastern Black Sea Region (2:
Kaptanpaşa, 3: Çamlıhemşin, 4: Çat, 5: Cankurtaran, 6: Karanlıkmeşe, 7: Şavşat) 8-14: Western Anatolia (8: Kemalpaşa, 9: Bozüyük 10: Çay, 11: Çorum, 12: Pınarbaşı, 13: Elmalı, 14: Bolkar Mountains, 15: Aladağlar).
In PCA, Kaiser-Meyer-Olkin Measure of Sampling Adequacy also showed a moderate level of Sampling Adequacy with the value of 0.642. Principal Component Analyses (PCA) extracted seven PCs that explained 79.9% of the total variance (Table 1). The initial eigenvalues of the components which explain the total variance were poor in dis-criminating between groups of two species. The fi rst component explained 36.1% total variance and the second 15.7%. The highest contribution to PC1 was found in the characteristics such as CBL, ZB, CNL, ONL, BL, LFR, NW, BCWB, BL, MAL, MAH with the values above of 0.700, and four characteristics (HTB, LTB, BW, WTB) to PC2.
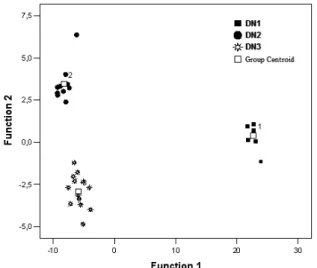
DFA showed that of the 44 specimens from both species, 31 (93.2%) were classifi ed correctly. Total variation was clarifi ed by three components in DFA. The characteristics with Wilks’ lambda values assume that the characteristics with low values are more dis-criminative between the sub-populations and popula-tions. Wilks’ lambda values which explain the tests of equality of group means were found signifi cant for most characteristics (P< 0.01). Canonical discrimi-nant function based on three components of 1 through 3 yielded a highly signifi cant Wilks’ Lambda of 0.003 (χ2= 214.455, DF= 30, P< 0.005). The fi rst canonical
variate which explained 89.2% of the variance clearly divided D. laniger samples from the sub-populations of D. nitedula, and also the second component which ex-plained 9.4% of total variability distinguished the Black Sea sub-population from the other sub-populations of D. nitedula and D. laniger (Fig 2). When considering sub-populations of D. nitedula, the fi rst canonical vari-ate markedly separvari-ated the DN1 sub-population from DN2 and DN3. However, the second canonical variate distinguished DN2 from DN3. Thus DN2, DN3 and DN1 were somehow separated from each other. The best classifi ed population in D. nitedula was DN2, with the value of 100%, followed by DN2 with 90% and by DN1 with 84.6%. According to the results obtained from DFA, D. laniger is signifi cantly differentiated from D. nitedula. In the populations of D. nitedula, the statistical result proved that DN1 had a very distinct group, suggesting that they are phenetically different from other sub-populations (Fig. 3).
Analysis of allozymic variations
Eight of the twenty loci coded by seventeen enzyme
Table 1. Total Variance Explained (First seven principal
component explains 79.9 % of total variance).
Com-ponent Initial Eigenvalues
Total % of Variance Cumulative %
1 11.183 36.076 36.076 2 4.861 15.679 51.755 3 3.143 10.140 61.895 4 1.864 6.013 67.908 5 1.477 4.764 72.672 6 1.233 3.976 76.647 7 1.023 3.301 79.948
Extraction Method: Principal Component Analysis
Fig. 2. The result of discriminant function analysis of
morphological characters of all populations of Dryomys (1=D. laniger ‘DL1’), (D. nitedula; 2=Black Sea region ‘DN1’; 3=Central Anatolia ‘DN2’; 4=Turkish Thrace ‘DN3’).
Fig. 3. The result of discriminant function analysis of
morphological characters of populations of Dryomys
ni-tedula (1=Black Sea region ‘DN1’; 2=Central Anatolia
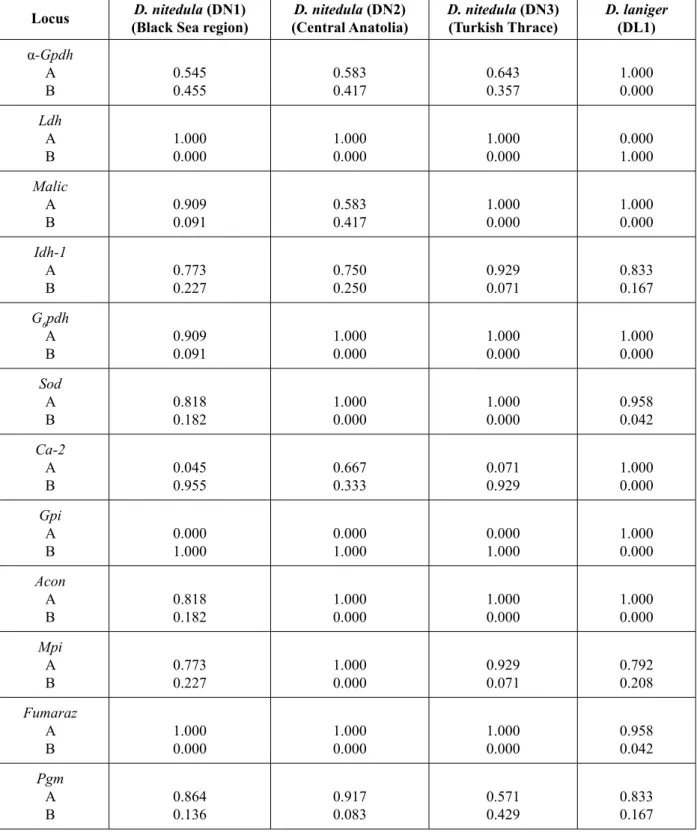
systems analyzed were monomorphic and fi xed for the same allele in all populations: Mdh-1, Mdh-2, Idh-2, G3pdh, Ald, Ca-1, Pgd and Hk. Of the 20 loci, nine were polymorphic in the sub- populations of D. nitedula and fi ve in D. laniger (Table 2). The loci Idh-1, Sod, Mpi, Pgm were found to be polymorphic in the both species. The loci Ldh and Gpi clearly
dis-tinguished D. nitedula from D. laniger in the analyzed specimens.
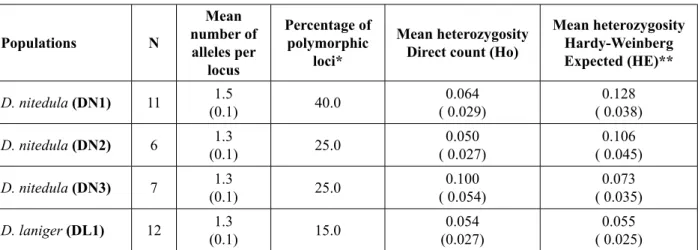
The genetic variation levels within populations are summarized in Table 3. Considering both taxa, it can be said that the genus Dryomys has moderate genetic diversity. The expected heterozygosity (HE) was ranging from 0.073 (DL1) to 0.128 (DN1) in D.
Table 2. Allele frequencies of 12 polymorphic loci in populations of Dryomys spp.
Locus (Black Sea region)D. nitedula (DN1) (Central Anatolia)D. nitedula (DN2) D. nitedula (DN3)(Turkish Thrace) D. laniger (DL1)
α-Gpdh A B 0.545 0.455 0.583 0.417 0.643 0.357 1.000 0.000 Ldh A B 1.000 0.000 1.000 0.000 1.000 0.000 0.000 1.000 Malic A B 0.909 0.091 0.583 0.417 1.000 0.000 1.000 0.000 Idh-1 A B 0.773 0.227 0.750 0.250 0.929 0.071 0.833 0.167 G6pdh A B 0.909 0.091 1.000 0.000 1.000 0.000 1.000 0.000 Sod A B 0.818 0.182 1.000 0.000 1.000 0.000 0.958 0.042 Ca-2 A B 0.045 0.955 0.667 0.333 0.071 0.929 1.000 0.000 Gpi A B 0.000 1.000 0.000 1.000 0.000 1.000 1.000 0.000 Acon A B 0.818 0.182 1.000 0.000 1.000 0.000 1.000 0.000 Mpi A B 0.773 0.227 1.000 0.000 0.929 0.071 0.792 0.208 Fumaraz A B 1.000 0.000 1.000 0.000 1.000 0.000 0.958 0.042 Pgm A B 0.864 0.136 0.917 0.083 0.571 0.429 0.833 0.167
nitedula and was 0.055 in D. laniger. However, the observed heterozygosity (HO) was found to vary from 0.050 to 0.100 in D. nitedula, and was 0.054 in D. laniger. The mean percentage of polymorphic loci was 30%, ranging from 25% to 40% in D. nitedula and 15% in D. laniger. The highest percentage of pol-ymorphic loci was found in the population of Black Sea region (DN1) (40%) with the mean number of alleles per locus equal to 1.5. The lowest percentage of polymorphic loci was in the D. laniger population. In D. nitedula, six loci (α-Gpdh, Pgm, Me, G6pdh, Acon, Mpi) violated the Hardy-Weinberg equilibrium in DN1 and one locus (Ca-2) in DN2. Ca-2 was also found to deviate from the Hardy-Weinberg equilib-rium in D. laniger (P < 0.05).
Population structure and distance
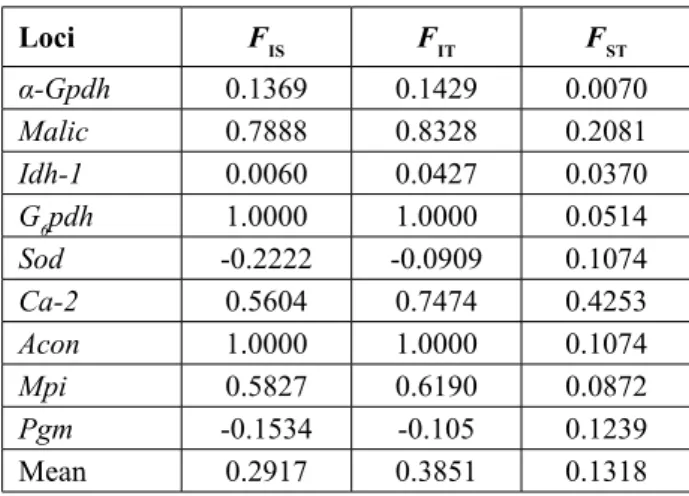
Estimates of F-statistics for polymorphic loci of D. nitedula were calculated with Biosys-2 (Table 4). D. laniger population was excluded from this analysis because it was evaluated as a single group. The mean value of the fi xation index FST = 0.13 indicates that 13% genetic variation in D. nitedulapopulations re-fl ect moderate or slightly high genetic differentiation. The loci Ca2, Me, Sod, Acon and Pgm signifi -cantly contribute to the differentiation between the studied sub-populations (Table 4). The values of FIS, indicating the effect of inbreeding on an individual within samples, were also moderately high (mean 0.2917) and negative for two of nine loci, although negative FIS values were not excessive. The values of FISwere found to be in the range of -0.1534 – 1 in
nine loci. Of these loci, G6pdh and Acon showed the highest value of FIS indicating the inbreeding effect. The values of FIT with the mean value of 0.3851, in-dicating the inbreeding effect of an individual on the total population, refl ected the similar genetic differ-entiation of FST and FIS. The value of Nm (number of migrants) between sub-populations of D. nitedula which was calculated from the approximation FST =1 / (1 + 4Nm) indicates the overall gene fl ow, and there is a negative correlation between the values FST and Nm. The Nm was calculated as 0.165, indicating a relatively low level of gene fl ow between the sub-populations.
The values of NEI’s (1978) unbiased genetic iden-tity (I) and distance (D) were calculated from pairwise comparisons of populations (Table 5). The neighbour
Table 3. Levels of genetic variation based on 20 loci in all populations.
Populations N Mean number of alleles per locus Percentage of polymorphic loci* Mean heterozygosity Direct count (Ho)
Mean heterozygosity Hardy-Weinberg Expected (HE)** D. nitedula (DN1) 11 (0.1)1.5 40.0 ( 0.029)0.064 ( 0.038)0.128 D. nitedula (DN2) 6 (0.1)1.3 25.0 ( 0.027)0.050 ( 0.045)0.106 D. nitedula (DN3) 7 (0.1)1.3 25.0 ( 0.054)0.100 ( 0.035)0.073 D. laniger (DL1) 12 (0.1)1.3 15.0 (0.027)0.054 ( 0.025)0.055
* A locus is considered polymorphic if the frequency of the most common allele does not exceed 0.95. ** Unbiased estimate (see NEI 1978)
Fig. 4. Neighbour joining dendrogram summarising the
genetic relationships among the Dryomys populations studied (D=Nei’s (1978) unbiased genetic distance, based on 20 enzyme loci). (DL: D. laniger, DN1: D. nitedula1, DN2: D. nitedula2, DN3: D. nitedula3).
joining dendrogram summarizing the genetic rela-tionships between the populations is given in Fig. 4. The highest genetic distance was found as D= 0.187 between D. nitedula1 and D. laniger. These values varied from D= 0.006 to D= 0.030 in the sub-popula-tion of D. nitedula. The highest distance value in the sub-population of D. nitedula was calculated as D= 0.030 between D. nitedula2 and D. nitedula3. These values indicated that the Black Sea sub-population is genetically close to the sub-population of Turkish Thrace. The specimens from Western Anatolia were connected to this group with a distance of D= 0.030.
Discussion
Biometric and allozymic comparisons between sub-populations of D. nitedula were performed by FILIPUCCI et al. (1994). More recently YIĞIT et al. (2003) compared two species of the genus Dryomys and noted that the shape of the braincase, tympanic bullae and mandible morphologically distinguished D. nitedula from D. laniger.
In biometrical analyses, F et al. (1994)
re-ported that ten characteristics were signifi cantly differ-ent among the six sub-populations of D. nitedula. The highest values for the F-test were for interorbital con-striction, mandible length, height of ramus mandibu-lae, mandibular tooth row length. They also noted that Israeli specimens were most distinct and that dormice from Turkish Thrace and Western Anatolia overlapped considerably, suggesting they are phenetically close. However YIĞIT et al. (2003) revealed that nine charac-teristics including weight and the ratio of the tail length to body length were statistically different between the specimens from Turkish Thrace and Western Anatolia using the t-test. In this study, using pair-wise compari-sons in Tukey’s HSD test, the sub-population from the Black Sea (DN1) was found to be the most dis-tinct sub-population among three sub-populations. Only one characteristic (BL) differed signifi cantly between Turkish Thrace and Western populations. This fi nding is consistent with that of FILIPUCCI et al. (1994). The six sub-populations subjected to discri-minant function analyses showed that the Israeli sub-population of D. nitedula was also the most distinct population; this sub-population was segregated from the other fi ve sub-populations by two canonical vari-ates which explained 90% of the variance (FILIPUCCI et al. 1994). In this study, the total variance was ex-plained by three components and D. nitedula and D. laniger were clearly separated from each other. In D. nitedula populations in Turkey, Black Sea sub-population was found to be the most distinct.
In allozymic comparisons, FILIPUCCI et al. (1994) stated that electrophoretically Israeli sample was found to be discriminated from European sub-populations by four loci (Ldh-I, G6pdh, Pep-I and Lap-2). They also reported that seven loci were found to be polymorphic in the sub-population of Edirne (Turkish Thrace); the proportion of polymorphic loci was 20%, the mean heterozygosity observed (Ho) was 0. 047, the average number of alleles per locus was 1.2. According the 20 loci analyzed, a discriminative locus was not found in the specimens from Black Sea (DN1), Western Anatolia (DN2) or Turkish Thrace (DN3). The mean heterozy-gosity observed and the mean percentages of poly-morphic loci were found to be slightly higher than that given for the specimens from Turkish Thrace. However the value of mean heterozygosity of the three sub-populations studied are in the range of the values given for European and Israeli sub-populations. The
Table 4. F-statistics of variable loci in the populations
of D. nitedula calculated using the method of WRIGHT
(1965). Loci FIS FIT FST α-Gpdh 0.1369 0.1429 0.0070 Malic 0.7888 0.8328 0.2081 Idh-1 0.0060 0.0427 0.0370 G6pdh 1.0000 1.0000 0.0514 Sod -0.2222 -0.0909 0.1074 Ca-2 0.5604 0.7474 0.4253 Acon 1.0000 1.0000 0.1074 Mpi 0.5827 0.6190 0.0872 Pgm -0.1534 -0.105 0.1239 Mean 0.2917 0.3851 0.1318
Table 5. Values of Nei’s (1978) unbiased distance (D;
above the diagonal) and genetic identity (I; below the di-agonal) between Dryomys populations
Population 1 2 3 4
1 D. laniger ***** 0.187 0.140 0.175 2 D. nitedula1 0.829 ***** 0.027 0.006 3 D. nitedula2 0.869 0.973 ***** 0.030 4 D. nitedula3 0.839 0.994 0.970 *****
genetic distance based on allozymic variations was also reported for the specimens ranging from Italy to Israel (FILIPUCCI et al. 1994). The mean value of Nei’s genetic distance observed between the two Italian sub-species was lower (D= 0.03), corresponding to values generally observed between local sub-populations, but the Israeli sub-population has four discriminate loci and the mean value of Nei’s genetic distance was D= 0.186 for Israeli and European sub-populations. AVISE and AQUADO (1982) suggested that such a value for genetic distances is generally associated with closely related sibling species. A high value varying from D= 0.140 to D= 0.187 was found between D. nitedula and D. laniger in Turkey. The highest value (D= 0.030) is similar to the value given for the Italian subspecies of D. nitedula by FILIPUCCI et al. (1994). They also suggested that the Israeli sub-population of D. nitedula could be a separate species. Supporting this suggestion, THROPE (1982) and NEI (1978) stated that allopatric populations of dubi-ous status that have a genetic distance (D) higher than 0.160 are probably not conspecifi c. Apart from these,
References
AVISE J. C., C. F. AQUADRO. 1982. A comparative summary of
ge-netic distances in the vertebrates. In: HECHT M.K, WALLACE
B & PRANCE G.T (Eds). – Evolutionary Biology. Plenum Publishing Corporation, 15: 151-185.
BLACK W. C. VI 1997. A Computer Program for the Analysis
of Allelic Variation in Genetics. Modifi cation of original version (BIOSYS-1) by David L. Swofford and Richard B. Selander.
CHALINE J., P. MEIN 1979. Les Rongeurs et l’évolution. Doin, Paris.,
235 p.
DAAMS R. 1981. The dental pattern of the dormice Dryomys, Myo-mimus, Microdyromys and Peridyromys. – Utrecht Micropa-leontologie Bulletin, Special Publication, 3: 115 p.
DOGRAMACI S., H. KEFELIOGLU 1990. The karyotype of Dryomys nitedula (Mammalia: Rodentia) in Turkey. – Turkish Jour-nal of Zoology, 16: 316-328.
CIVITELLI M., V., M. G. FILIPPUCCI, C. KURTONUR and B. OZKAN
1995. Chromosome analysis of three species of Myoxidae. Proc. II Conf. on Dormice (Rodentia, Myoxidae) – Hystrix (n.s.), 6 (1-2) (1994), 117-126.
FILIPPUCCI M. G. , T. KOTSAKIS 1995. Biochemical systematics and
evolution of Myoxidae. Proc. II Conf. on Dormice (Rodentia, Myoxidae). – Hystrix (n.s.), 6 (1-2) (1994), 77 -97.
FILIPPUCCI M. G., B. KRYSTUFEK, S. SIMSON, C. KURTONUR and B. OZKAN
1995. Allozymic and biometric variation in Dryomys nitedula (Pallas, 1779). Proc. II Conf. on Dormice (Rodentia, Myo-xidae). – Hystrix (n.s.), 6 (1-2) (1994), 127-140. HARRIS H., D. A. HOPKINSON 1976. Handbook of enzyme
elec-trophoresis in human genetics. American Elsevier, New
York. 282 p.
the genus Dryomys is considered the most recent ge-nus in the family Myoxidae (STORCH 1978, CALINE and MEIN 1979, DAAMS 1981). The oldest fossil records known for this species are from Middle Pleistocene age in Central Europe and Chios Island (Greece) (JANOSSY 1962, STORCH 1975, HORACEK 1987), but this species was also found to be from Early Pliocene in Poland by NADACHOWSKI (1990). SPITZENBERGER (1976) noted that Dryomys can not be considered as recent due to the sym-patric occurrence in Taurus Mountains of D. nitedula and D. laniger. According to FILIPUCCI et al. (1994), the electrophoretic data supports Spitzenberger’s hypothesis that the genus Dryomys is highly differentiated across a fragmented and large distribution area. The FST value which shows moderate or slightly high genetic differ-entiation also supports this hypothesis. In order to es-tablish phylogenetic and paleontological relationships, further research, especially using molecular techniques, and with Caucasian and Iranian specimens included in the evaluation, is necessary for both species.
Acknowledgements: This study was fi nancially supported by
BAP (2005-070-51-02) of Ankara University.
HORACEK I. 1987. Fossil records and chorological status of dormice
in Czechoslovakia. Part II. Dryomys and Muscardinus. – Folia
Musei Rerum Naturalium Bohemiae Occidentalis. Zoologica,
26: 80-96.
JANOSSY D. 1962. Vorläufi ge Mitteilung über die Mittelpleistozäne
Vertebratenfauna der Tärko-Felsnische (NO-Ungarn, Bükk-Gebirge). – Annales Historico-Naturales Musei Nationalis
Hungarici, 54: 155-176.
KIVANC E., M. SOZEN, E. COLAK and N. YIGIT 1997. Karyological
and phallic characteristics of Dryomys laniger Felten and Storch, 1968 (Rodentia: Gliridae) in Turkey. Israel Journal
of Zoology, 43: 401-103.
KRYSTUFEK B., V. VORHALIK 1994. Distribution of the forest
Dor-mouse Dryomys nitedula (Pallas, 1779) (Rodentia: Myoxi-dae) in Europa. – Mammalian Review, 24 (4): 161-177. KRYSTUFEK B., V. VORHALIK 2005. Mammals of Turkey and Cyprus.
Rodentia I: Sciuridae, Dipodidae, Gliridae, Arvicolinae.
Koper: University of Primorska, Science and Research Centre, 292 p.
MARKOV G. G. 2001. Cranial sexual dimorphism and
microgeo-graphical variability of the forest Dormouse (Dryomys
nit-edula Pall., 1779). – Trakya University Journal of Scientifi c Research., Series B 2 (2): 125-135.
MITCHELL-JONES A. J., G. AMORI, W. BOGNADOWICZ, B. KRYSTUFEK,
P. J. H. REIJDERS, F. SPITZENBERGER, M. STUBBE, J. B. M.
THISSEN, V. VORHALIK and J. ZIMA 1999. The Atlas of
Euro-pean Mammals. T. & A. D. Poyser Ltd. London. 484 p. MURSALOGLU B. 1973. New records for Turkish Rodent
(Mam-malia). – Communications, Faculty of Science, University
NADACHOWSKI A. 1990. Review of fossil Rodentia from Poland
(Mammalia). – Senckenbergiana Biologica, 70 (1989): 229-250.
NEI M. 1978. Estimation of average heterozygosity and genetic
distance from a small number of individuals. – Genetics,
89: 583-590.
ONDRIAS J. C. 1966. The taxonomy and geographical distribution
of the rodents of Greece. – Säugetierkundliche. Mitteilun-gen. 14: 1-136.
ROHLF F J. 2000. NTSYS – pc: Numerical taxonomic and multivariate
analysis system, version 2.1. Exeter Software, New York. SHAW C. R., R. PRASAD 1970. Starch gel electrophoresis of
en-zymes- A compilation of recipes. – Biochemical Genetics,
4: 297-320.
SLATKIN M., N. BARTON N. 1989. A comparison of three indirect
methods for estimating average level of gene fl ow. –
Evolu-tion, 43: 1349–1368.
SNEATH P. H. A., R. R. SOKAL 1973. Numerical Taxonomy. W.
H.Freeman, San Francisco, 573 p.
SPITZENBERGER F. 1976. Beitrage zur Kenntnis von Dryomys laniger Felten and Storch, 1968 (Gliridae: Mammalia). – Zeitschrift für Säugetierkunde, 41: 237-249.
STORCH G. 1978. Dryomys nitedula (Pallas, 1779) Baumschlafer.
Pp. 227-237. – In von NIETHAMMER, J. and KRAPP, F. (eds):
Handbuch der Säugetiere Europas, Band I, Rodentia I. Akademische Verlagsgesellschaft Wiesbaden, 476 p. SWOFFORD D. L., R. B. SELANDER 1989. BIOSYS-2: A computer
program for the Analysis of Allelic Variation in Popu-lation Genetics and Biochemical Systematics based on BIOSYS-1, modifi ed by W. C. Black. 1997. Colorado State Univ., Fort Collins, CO.
THROPE J. P. 1982. The molecular clock hypothesis: biochemical
evolution, genetic differentiation, and systematics. – Annual
Review of Ecology and Systematics, 13: 139-168.
WILSON E., M. D. REEDER 1993. Mammal Species of the World- A
Taxonomic and Geographic Reference. 2nd Ed. Washing-ton, C, Smithsonian Institution Press. 1206 p.
WRIGHT S. 1951. The genetical structure of populations. – Annals of Eugenics, 15: 323-354.
WRIGHT S. 1965. The interpretation of population structure by
F-statistics with special regard to systems of mating. –
Evolution, 19: 395-420.
YIGIT N., E. ÇOLAK, R. ÇOLAK, B. OZKAN and Ş. OZKURT 2003. On
the Turkish Population of Dryomys nitedula (Pallas, 1779) and Dryomys laniger Felten and Storch, 1968 (Mammalia: Rodentia). – Acta Zoologica Academiae Scientiarum
Hun-garicae, 49 (Suppl.1): 147-158.
Received: 28.05.2010 Accepted: 13.01.2011